# Dashboard
[](https://docs.medulla-tech.io/uploads/images/gallery/2025-07/abmVy8L9cdCszgid-image.png)
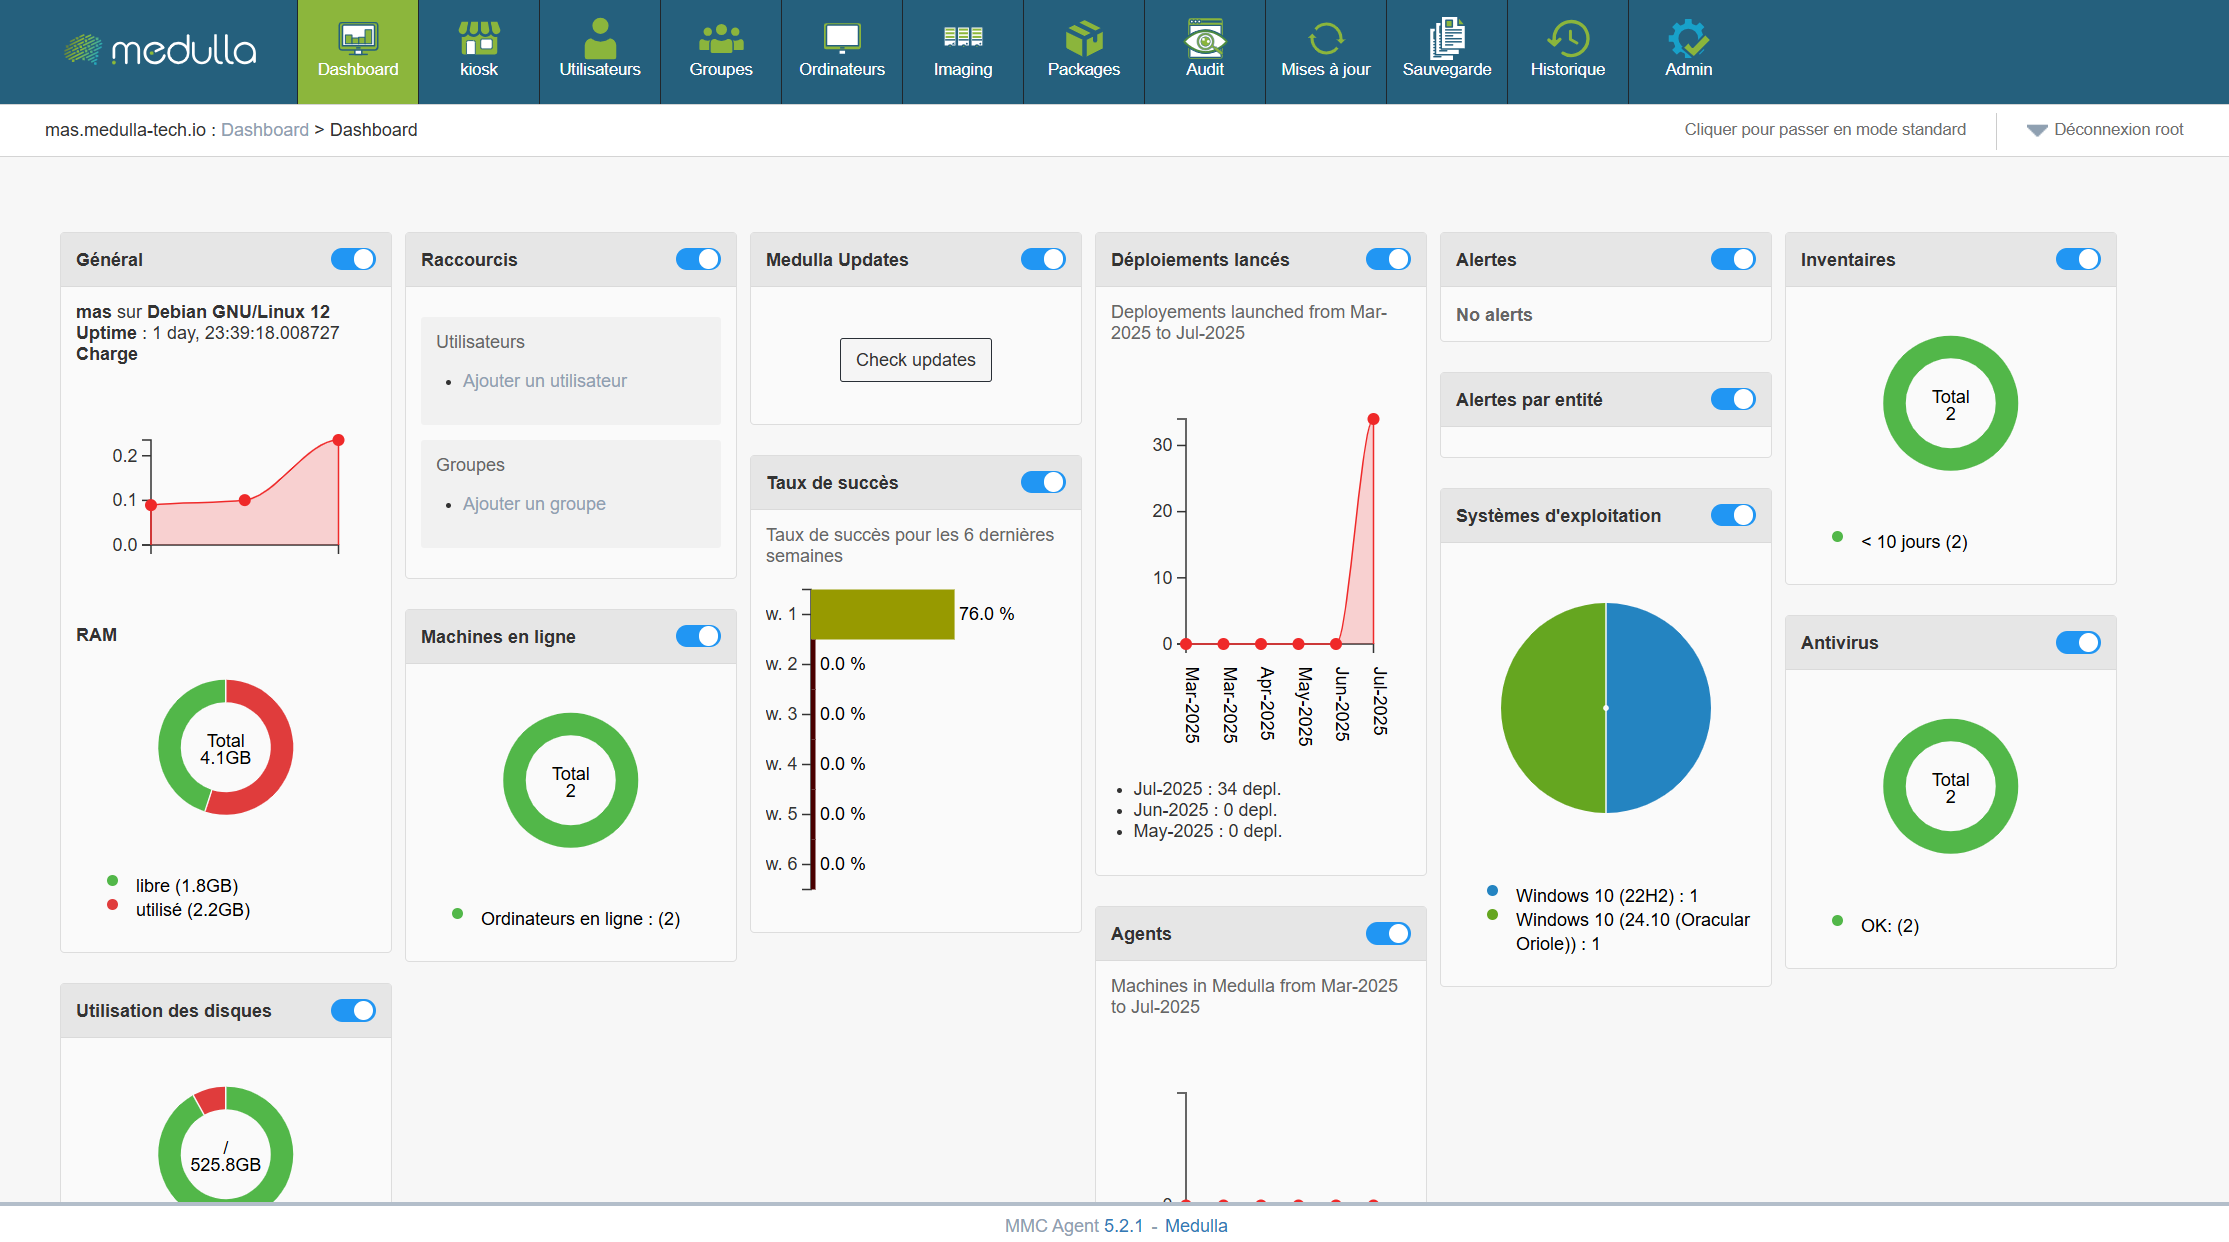
The Medulla dashboard allows you to monitor the real-time status of your infrastructure using customizable widgets. You can move, resize, and arrange the widgets as you wish. Each widget also has a button to show or hide it, depending on your needs.
Some widgets include dynamic charts for a better understanding of the data, updating in real time.
The following widgets allow you to create static groups directly so you can perform actions on them by clicking:
Inventory Widget, Operating System, Online Machines, Antivirus
In summary, the **Dashboard** is your centralized hub for managing and monitoring the status of your IT infrastructure. It is designed to be **flexible and responsive**, providing an overview of your machines’ and resources’ performance while allowing you to react quickly to any alerts or necessary updates.
With this set of tools and **graphical visualizations**, the dashboard gives you optimal control to **manage your systems efficiently**, while providing a clear and detailed view of your entire IT environment.