The dashboard
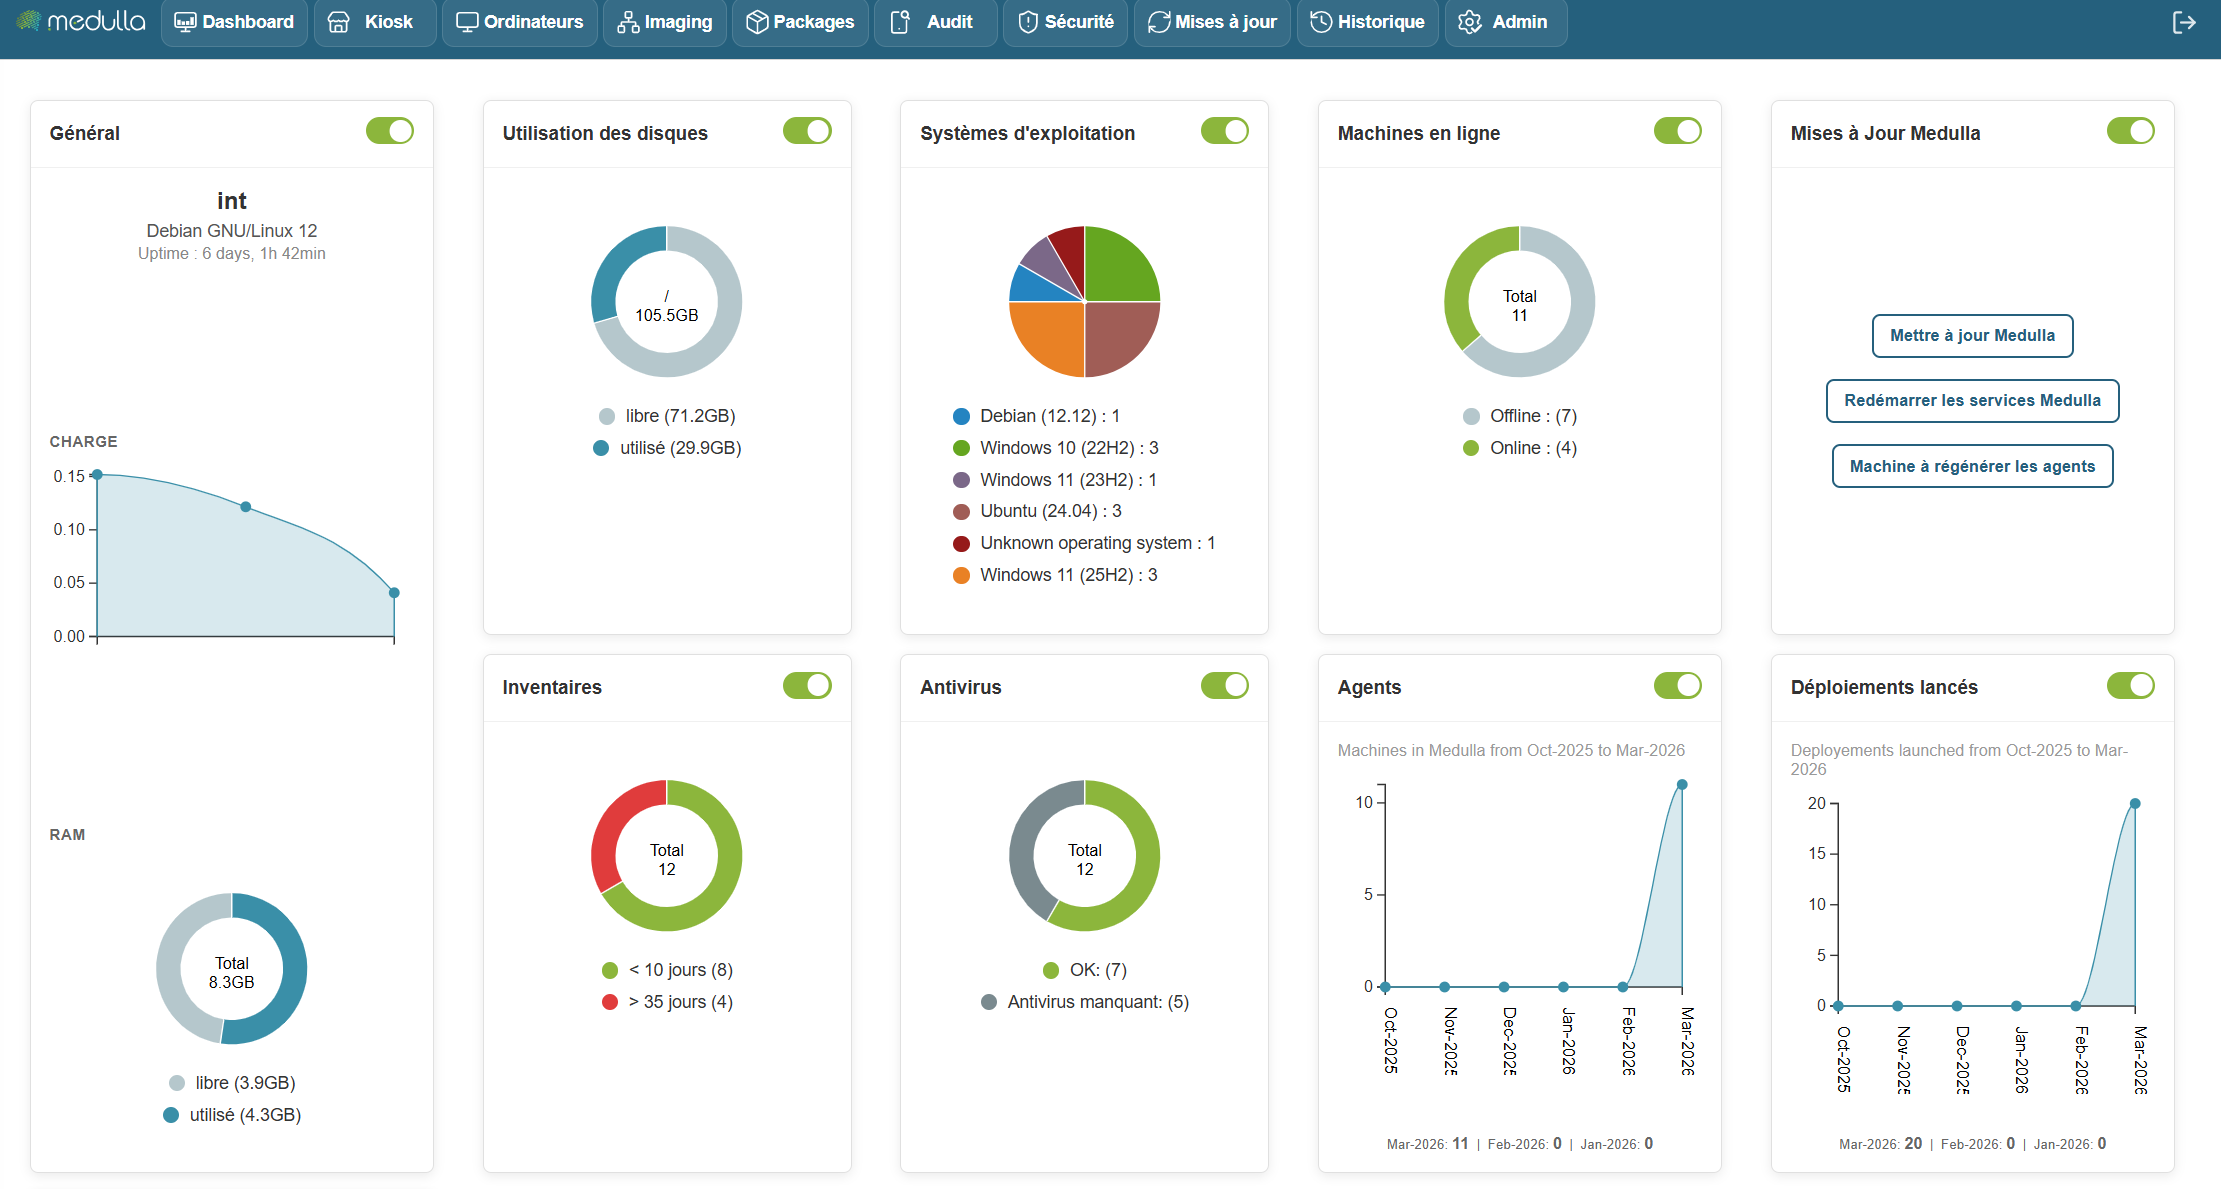
Dashboard Overview The Medulla dashboard provides a clear and detailed overview of the status of your IT infrastructure. Designed to give you a quick and accurate snapshot, it consolidates essential information and performance metrics to help you make informed decisions in real time.
Fully customizable, this dashboard allows you to tailor its content to your priorities by adding or removing widgets as needed.
Machine Status
The dashboard displays the status of machines in real time, whether they are online, offline, or experiencing specific issues such as failed deployments or non-compliance.
Recent Alerts
It allows you to view critical and non-critical alerts, such as:
- Deployment issues
- Pending updates
- Unreachable machines
- Failed backups
Each alert can be viewed and managed directly from this section.
History of actions and events
Detailed tracking of actions performed on the system, including:
- Completed deployments
- Backups performed
- Configuration changes
- Remote access
Update tracking
The dashboard lets you track the status of ongoing updates, with the ability to easily manage them: install immediately or schedule for later.
Resource management
You have direct access to system resource usage, such as:
- Bandwidth
- Available storage space
- Management server performance
Dashboard Customization
Thanks to widget customization, you can track key information such as:
- The number of machines working remotely
- Device compliance
- Deployment progress
Widgets can be easily rearranged using drag-and-drop, providing an experience fully tailored to your needs.
Dashboard interactivity
The dashboard is interactive, allowing you to:
- Click on an alert to view details and respond directly.
- Click on a machine to access its information and perform actions, such as deploying software.
- Click on an update to install it immediately or schedule it according to your schedule.
Benefits
- A quick and responsive overview of incidents, allowing you to react immediately.
- Direct access to critical actions, without having to navigate through complex menus.
- Save time with centralized management and constantly updated information.
To learn more or access advanced features, you can view the additional documentation by clickingDashboard.
For more information, visit our website: https://medulla-tech.io