# Chapter 3: Main interface

# The dashboard

Presentation of the dashboard The Medulla dashboard provides a clear and detailed overview of the state of your computer fleet. Designed to provide you with a quick and accurate overview, it brings together essential information and performance indicators to help you make informed decisions in real time.

Fully customizable, this dashboard allows you to adapt its content to your priorities by adding or removing widgets according to your needs.

![image.png](https://docs.medulla-tech.io/uploads/images/gallery/2025-05/scaled-1680-/nO3image.png)

#### Engine condition

The dashboard displays in real time the status of machines, whether online, offline or encounter specific problems such as failed deployments or non-compliances.

#### Recent alerts

It allows visualization of critical and non-critical alerts, such as:

- Deployment problems
- Pending updates
- Unreachable machinery
- Failed backups

Each alert can be viewed and managed directly from this section.

#### History of actions and events

Detailed monitoring of the actions carried out on the system, including:

- Deployments
- Saved
- Configuration changes
- Remote access

#### Follow-up of updates

The dashboard allows you to track the status of current updates, with the ability to manage them easily: install immediately or plan for later.

#### Resource management

You have direct access to the use of system resources, such as:

- bandwidth
- Available storage space
- Management server performance

#### Customizing the dashboard

By customizing widgets, you can track key information such as:

- Number of teleworking machines
- Machine conformity
- Progress in deployments

Widgets are easily reorganizable by simply dragging down, providing an experience that is fully tailored to your needs.

#### Interactivity of the dashboard

The dashboard is interactive, allowing you to:

- Click on an alert to see the details and answer them directly.
- Click on a machine to access its information and perform actions, such as software deployment.
- Click on an update to install immediately or plan it according to your schedule.

#### Benefits

- Quick and reactive overview of incidents, allowing you to react immediately.
- Direct access to critical actions, without having to navigate in complex menus.
- Save time through centralized management and constantly updated information.

<p class="callout success">To learn more or access advanced features, you can view the additional documentation by clicking[Scoreboard](https://wva.siveo.net/books/ka-test-book-de/page/tableau-de-bord "Tableau de bord").</p>

[![medulla_logo.png](https://wva.siveo.net/uploads/images/gallery/2025-04/scaled-1680-/N42n2B9uZEP1ONyG-medulla-logo.png)](https://medulla-tech.io/)

[For more information, visit our website :](https://medulla-tech.io/)<a data-end="509" data-start="495" rel="noopener" target="_new">www.medulla.fr</a>

# Menu and navigation

Overview The Medulla interface is designed to offer a smooth, clear and functional user experience. Thanks to a modular structure, each user can quickly access the information and actions they need.

[![image.png](https://docs.medulla-tech.io/uploads/images/gallery/2025-05/scaled-1680-/4K2image-png.png)
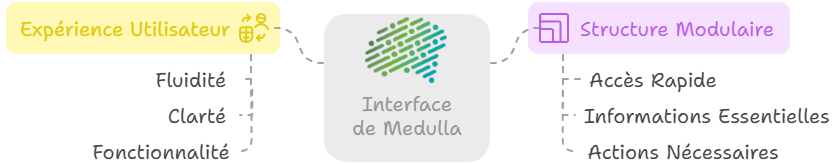
](https://docs.medulla-tech.io/uploads/images/gallery/2025-05/scaled-1680-/4K2image-png.png)

### Main navigation bar

Located at the top of the screen, the navigation bar gives you access to the main modules of the platform

[![image.png](https://docs.medulla-tech.io/uploads/images/gallery/2025-05/scaled-1680-/HLMimage.png)](https://docs.medulla-tech.io/uploads/images/gallery/2025-05/HLMimage.png)

#### Custom dashboard

The user can configure a **Custom Dashboard**With dynamic widgets:

- Number of active machines
- Current deployments
- Recent backups
- Critical alerts

[![medulla_logo.png](https://wva.siveo.net/uploads/images/gallery/2025-04/scaled-1680-/N42n2B9uZEP1ONyG-medulla-logo.png)](https://medulla-tech.io/)

[For more information, visit our website :](https://medulla-tech.io/)<a data-end="509" data-start="495" rel="noopener" target="_new">www.medulla.fr</a>

# Organisation of the interface

A modular and intuitive medulla interface is based on a modular interface, where each feature is grouped by theme into an independent module. This allows:

- Simplify daily use
- Navigate quickly to the desired action
- Adapt the tool to your business need

Each module works as an application in the application, with its own views, filters, tabs, and settings.

**Example of organization by module**

Here are some concrete examples:

### Computer Module

[![image.png](https://docs.medulla-tech.io/uploads/images/gallery/2025-05/scaled-1680-/Fedimage-png.png)](https://docs.medulla-tech.io/uploads/images/gallery/2025-05/scaled-1680-/Fedimage-png.png)

#### Main display:

List of computers with status (online/offline), user, last contact.

##### Tabs available:

Inventory, Actions,[ **LDCD**](https://docs.medulla-tech.io/books/medulla-vue-densemble-enp/page/glossaire "Glossaire"), Backup, History.

##### Filters for use:

Operating system, groups, connectivity.

##### Additional Features:**[![image.png](https://docs.medulla-tech.io/uploads/images/gallery/2025-05/scaled-1680-/UD3image-png.png)
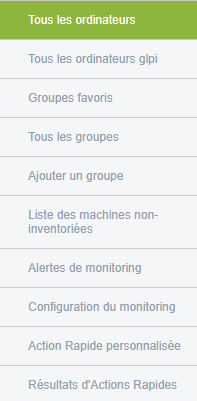
](https://docs.medulla-tech.io/uploads/images/gallery/2025-05/scaled-1680-/UD3image-png.png)**

- All computers / GLPI
- Favorite groups
- Non-inventory machines
- Monitoring alerts, configuration
- Rapid actions (personalised and results)
- XMPP view

##### Research:

By fields, entity, with deletion options.

**Example of machine listed:**

[![image.png](https://docs.medulla-tech.io/uploads/images/gallery/2025-05/scaled-1680-/YNrimage.png)](https://docs.medulla-tech.io/uploads/images/gallery/2025-05/YNrimage.png)

<p class="callout success">To learn more or access advanced features, you can view the additional documentation by clicking [Computers](https://wva.siveo.net/books/ka-test-book-de/chapter/chapitre-5-ordinateurs "Ordinateurs")</p>

[![medulla_logo.png](https://wva.siveo.net/uploads/images/gallery/2025-04/scaled-1680-/N42n2B9uZEP1ONyG-medulla-logo.png)](https://medulla-tech.io/)

[For more information, visit our website :](https://medulla-tech.io/)<a data-end="509" data-start="495" rel="noopener" target="_new">www.medulla.fr</a>