Chapter 5: Computers
- Computers
- All groups
- Network clock
- List of non-inventory machines
- Monitoring alerts
- Quick Action Custom
Computers

This section is dedicated to the complete management of all IT posts in Medulla. Whether you want to monitor, organize, or interact remotely with your machines, everything is centralized in a user-friendly and intuitive interface.
Computer management in Medulla is based on a centralized interface accessible via the XMPP view. From this interface, you have access to all the features necessary to monitor machine condition, perform targeted searches, apply filters, and perform various actions on your computers, all in real time.
XMPP View of Computer Posts
The XMPP view is the heart of post management in Medulla. It allows you to track and interact with each machine in real time. This module centralizes the information and possible actions for complete control of your computer fleet
Filters and Post Selection
At the top of the page, you have three radio filters to select the positions according to their connection state:
-
All computers : Displays all machines, regardless of their condition.
-
Computers online : Only displays currently connected posts.
-
Offline computers : Displays machines that are not connected at the moment.
These filters are convenient for quick and targeted machine management based on availability.
Entity Filtering
Global research
Through the search field "Search all fields", you can search for a machine by typing a keyword. This search field applies to all fields visible in the table, such as machine name, IP address, operating system, or associated entity.
Actions Available on Post
Under each IT station in Medulla, you have several actions at your disposal for remote management and control. These actions include advanced features such as machine inventory, monitoring, remote control, and much more. For a detailed view of each function, see Admin part which addresses these options in depth.
Here is an overview of the actions available:
![]() GLPI Inventory Monitoring and managing hardware and software configurations via integration with GLPI.
GLPI Inventory Monitoring and managing hardware and software configurations via integration with GLPI.
![]() Monitoring Real-time monitoring of machine performance.
Monitoring Real-time monitoring of machine performance.
![]() Remote control Direct access to machines to perform troubleshooting or maintenance actions.
Remote control Direct access to machines to perform troubleshooting or maintenance actions.
![]() Ur BackupManagement of machine backups via UrBackup.
Ur BackupManagement of machine backups via UrBackup.
![]() Software deployment Remote software installation or updating.
Software deployment Remote software installation or updating.
![]() Managing Imaging Deployment and management of system images.
Managing Imaging Deployment and management of system images.
![]() XMPP Console Verification of machine connectivity and real-time interaction via XMPP.
XMPP Console Verification of machine connectivity and real-time interaction via XMPP.
![]() Edit configuration files Changing remote configuration files.
Edit configuration files Changing remote configuration files.
All GLPI computers

This section displays only computers that have been synchronized withGLPI through automated inventory. You can view all machines registered in the GLPI system and check their status.
Features:
-
View similar to the main page : You will find a visual interface identical to that of the view "All computers", with options to filter machines in line or Offline.
-
GLPI fields displayed : Key information on GLPI synchronized computers is visible, such as:
-
Name of machine
-
Operating System (OS)
-
Entity to which the machine is attached
-
Last user
-
And other important information
-
-
Filtering by connection state : The interface allows you to filter machines online and offline according to their synchronization status with GLPI.
-
Display conditioned to GLPI connection : Only computers that have been properly synchronized with the GLPI inventory will display here. If no machine appears, this may mean that the GLPI inventory has not been properly configured or that the machines have not yet been synchronized.
If no posts appear here, this means that the GLPI inventory is not yet configured or that the machines have not been synchronized
All groups
Favorite groups
Once computer groups are created, you can mark some as favorites for quick access.
Favorite groups are useful for:
Teams that regularly work on the same set of positions
Preparation of clustered action scenarios (imagining, updating, etc.)
Monitoring critical or sensitive machines
All groups

This section displays all groups computers available in your Medulla instance. You can manage all groups centrally and carry out large-scale actions, such as:
Software deployment
Installation of updates
Remote restarting of machines
Export of reports in CSV format
It also allows for a large-scale set of actions, such as software deployment, installation of updates, reboot of remote machines, or export of reports in CSV format
Add Group
Medulla offers several ways to structure and organize your computer park through a flexible group system. When creating a group, you can choose between several methods:
Creating a dynamic group

The dynamic groups allow you to automatically target machines according to predefined criteria. These groups automatically update as soon as a machine meets or no longer meets the chosen criteria.
Modules available for creating a dynamic group:
GLPI : requests based on GLPI inventory (OS, hardware status...)
XMPPMaster: requests related to XMPP actions (real time communication, monitoring...)
Group: to cross or filter existing groups
Dynamic groups are particularly useful in constantly changing environments or for automated targeted deployment
Creation of a static group
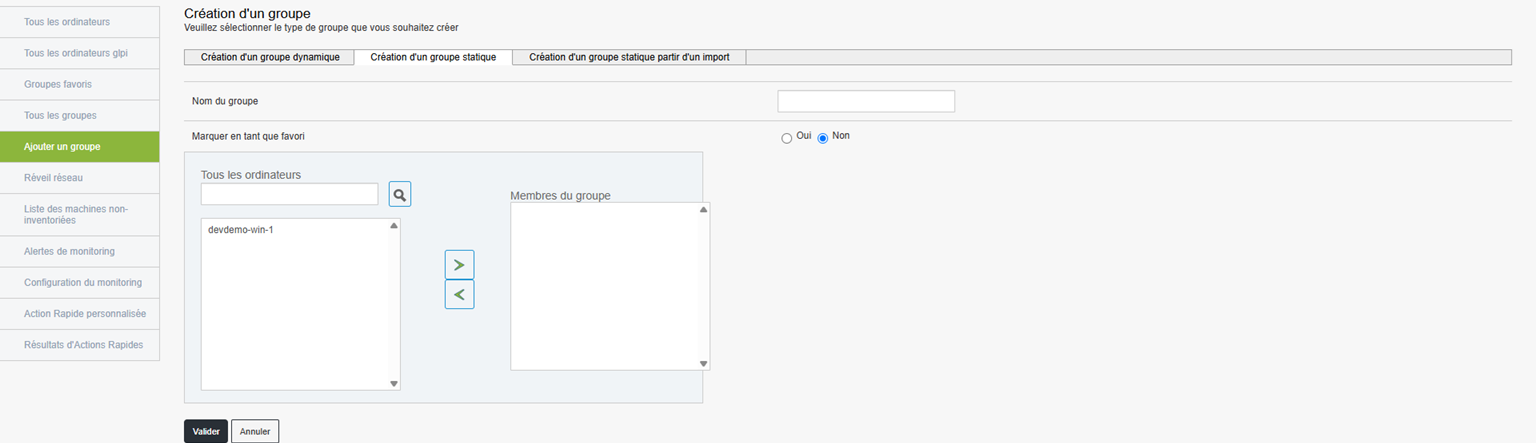
The static groups are created manually, explicitly selecting the machines to include. Unlike dynamic groups, the composition of a static group does not change automatically. You will need to add or remove machines as needed.
Operation:
Name of group : Give a clear and relevant name to the group.
Favorite : Check this option if you want the group to be easily accessible from the favourite groups menu.
Selection of machines Choose the computers to include in the group from the list of available machines.
Typical examples of use:
Create a group of Test machines.
Prepare a set of computers to manually configure.
Follow one fixed set of items in a specific context.
The static group is ideal for specific contexts or tracking
Creation of a static group from an import

If you already have a list of machines (in format CSV or Excel), you can easily create a group from this file.
Creation Steps:
Name of group : Enter a name for the group.
Favorite : Check this option if you want the group to be a favourite.
Import File : Click "Choose a file" to import your list (formats CSV or Excel compatible).
Define data types : Indicate the types of data contained in the file (e.g., Machine Name, User, Inventory Number, Operating System, etc.).
This method is perfect if you retrieve information from an external system or a structured Excel sheet.
Network clock

The Network clock (or Wake on LAN - WOL) is a convenient feature that allows you to remotely start off machines, provided they are configured to accept this command.
How does it work?
Accessible from the Medulla main menu, this feature displays a list of machines compatible with the network alarm. You will be able to take control remotely and manage the ignition of the stations without having to move physically.
Information available for each machine:
Name of machine : Identifier of the post you want to wake up.
Current status : Display the status of the machine (online or offline).
Action button : Lets you try to wake up the selected machine. A click on this button will try to send the alarm command.
Prerequisite:
The Wake-on-LAN based on an adequate configuration of the BIOS/UEFI of the positions. Make sure this feature is enabled on the machines before you can wake them up remotely.
Typical uses:
Start groups of machines before an operation deployment or maintenance.
Wake up computers for update or to launch backups during the night, in order not to disrupt the business activity during the day.
Benefits of Wake on LAN:
Time savings : Start multiple machines simultaneously remotely.
Flexibility : Keeps computer stations up to date and performs maintenance operations without physical intervention.
Increased productivity : Ideal for IT teams that have to manage a large number of machines without disturbing users.
This feature is based on the BIOS/UEFI settings of the stations (Wake-on-LAN must be enabled)
Typical use
Start a group of positions remotely before deployment
Wake up computers to keep them up to date or run backups at night
List of non-inventory machines

This section allows you to quickly identify machines that are not properly inventoried in Medulla. They may be machines that have never reassembled information, or machines that have been offline for too long.
Objective:
Identify inactive or poorly configured machines.
Check the correct functioning of XMPP/GLPI agents on machines.
Identify machines that have been removed without cleaning in the base.
Overview:
When accessing this page, a table will appear, listing all machines with inventory anomalies. Here is the information available in this table to help you diagnose and solve these problems:
Columns in the table:
XMPP machines : List of machines with an activated XMPP agent, allowing real-time communication with Medulla.
JID (Jabber ID) : Unique identifier of the XMPP agent, used to connect to Medulla.
Archi : Hardware architecture of the machine (e.g. x86_64, ARM, etc.).
Class : The class of the machine (e.g. PC, server, terminal, etc.).
Presence of kiosk : Indicator showing whether the Kiosk is installed and operational on the machine.
OR Users : Organization Unit associated with machine users.
OR Machinery : Organization Unit associated with the machine itself.
Cluster name : Name of the cluster to which the machine might belong (if applicable).
Cluster Description : Additional description or details on the machine cluster.
MAC address : MAC address of the machine, useful for uniquely identifying network devices.
IP XMPP : IP address used for XMPP communication.
Actions : Buttons allowing to perform actions on the machine, such as removing, updating or repairing the agent.
Typical use cases:
Inactive machine suspicion or defective agent:
If you suspect that a machine is no longer active or that the XMPP/GLPI agent is no longer working properly, this page is an excellent starting point for checking its condition. In particular, you can identify the machine through MAC or XMPP IP.Inventory cleaning or audit preparation:
If you are doing an inventory cleaning or preparing an audit, this list allows you to identify the machines to be checked or deleted from the database. You can quickly filter and locate audit machines, for example by consulting information such as the presence of the Kiosk or the XMPP status.
Practical tip:
If a machine appears in this list but no longer appears in "All computers", this may mean that it has been disconnected for a long time or that its XMPP/GLPI agent is misconfigured. You can then take the necessary steps to solve the problem (reinstallation of the agent, deletion of the entry, etc.).
Monitoring alerts

This section centralizes all alerts generated by monitored machines in your Medulla environment. It allows you to track, in real time or delayed, hardware or software incidents detected by supervisors deployed on your machines.
Objective
Identify critical or recurring incidents : such as disk failures, device errors, network anomalies, or any other problem affecting monitored machines.
Ensure clear traceability of events : by keeping a precise time stamp for each alert in order to ensure a complete follow-up.
Allow rapid reaction by alerting administrators to detected problems so that they can respond quickly.
Alert history
When no alert is currently active, you can view history of past events. This includes resolved alerts, thus ensuring complete traceability of incidents and interventions on your machines.
Information available in history:
If alerts are recorded, the table will show the following:
Name of machine : Name of the machine concerned by the alert.
Date of event Date and time of incident.
Type of event Category of incident (e.g. device error, hardware failure).
Machine message : Details of the error or problem raised by the machine.
Device concerned : The device related to the incident (e.g. hard drive, network card).
Status Current status of the alert (open, ongoing, resolved).
Message : Alert message generated by the Supervisory Officer.
Serial number : Device or machine serial number.
Firmware : Version of the firmware involved in the incident.
Commentary : Space for comments or clarifications on the incident.
Available actions : Actions to be undertaken on the incident (e.g. solve, ignore, export).
In particular: If the table is empty, this means that no alerts have yet been detected or stored in your environment.
Monitoring Configuration

In this section, you can customize the monitoring settings applied to positions via a centralized configuration file.
When you access this page, an edit area is displayed directly on the screen, allowing you to change the contents of the following configuration file
/var/lib/pulse2/xmpp_monitoring/confagent/monitoring_config.ini
All changes you make in this space are automatically recorded, no need to click on a validation button.
Recommendations
Before any modification, it is advisable to make a backup of existing file.
Apply the changes with precautionary and test them on a few machines.
Contact your system administrator if you have a doubt about a parameter.
Quick Action Custom

The Custom Quick Action section allows you to create and manage automated actions that will be executed remotely on your machines. These actions may include specific scripts or commands, thus facilitating mass management and automation of administrative tasks on multiple posts simultaneously.
Overview
Once in this section you will see a list of all the custom quick actions already configured for the user root. If no action has yet been created, an empty array will appear, allowing you to add custom commands.
The table contains the following information:
Custom order name : The name assigned to quick action. This name will be used to identify the action.
Description : A summary or a detail of what the action does. This allows you to quickly understand the purpose of the command without having to consult your script.
Operating system : The type of system for which quick action has been defined (e.g. Windows, Linux, macOS).
Actions : Options available for modify or delete rapid action already in place.
Create a new custom quick action

To create a new custom quick action, just click on the button "Create a personalized quick action" at the top of the page. This will redirect you to a form where you can define the parameters of your new order.
Form for creating a custom quick action
The form is divided into several essential fields:
Operating system :
Choose the target operating system on which the command will be executed. Example: Windows, Linux, macOS, etc.Order name :
Give a unique name to this quick action so that it can be easily identified among the other commands. This name must be clear and descriptive to avoid confusion.Command or Script :
Enter the exact command or script you want to run remotely on the target machines. For example, you can enter a command like:shutdown /r /t 0to immediately restart a Windows machine, or another administration script adapted to your needs.Description of the order :
Add a concise description explaining the objective of the order. This will help all administrators understand its usefulness, even if they are not responsible for its creation.
Once all fields are filled, you will only have to validate to record and activate the action. The action will now be available in the list of custom commands and can be executed on target machines.
Verification : Before performing an action on a large number of machines, test there on an isolated machine to make sure it works as intended.
Documentation : It is recommended that each quick action be well described so that all users can understand its usefulness and effects.
Security : Controls can have a significant impact on systems. Ensure that only authorized and necessary actions are performed.