Medulla Step by Step Guide
Take control of Medulla easily. This visual guide accompanies you step by step in the daily use of the tool, whether you discover Medulla or want to go further in its use.
With clear explanations, screenshots, concrete examples and essential reminders, explore each function with confidence without unnecessary jargon, but with the effectiveness you need.
- Chapter 1: Table of Contents
- Chapter 2: First steps in Medulla
- Chapter 3: Kiosk
- Chapter 4: Users
- Chapter 6: Groups
- Chapter 5: Computers
- Computers
- All groups
- Network clock
- List of non-inventory machines
- Monitoring alerts
- Quick Action Custom
- Chapter 6: Imagining I
- Chapter 7: Imagining II
- List of profiles
- Add Profile
- Configuring the imaginationg
- Sysprep Response File Manager
- Imagination groupsg
- Chapter 8: Packages
- List of packages available
- Add a new package
- Packages pending deployment
- List of deployment rules
- Add Custom Rule
- Launch and track deployment
- Section 9: Audit
- Chapter 10: Updates
- Chapter 11: Safeguarding
- Chapter 12: Background
- Chapter 13: Admin
Chapter 1: Table of Contents
Contents
Contents
Chapter 1: Contents
First steps in Medulla
The Kiosk module
Understanding roles and users
Organize your park with groups
Manage computers
- Computers
- All groups
- Network clock
- List of machines not inventoried
- Monitoring alerts
- Quick action customization
Imagining – Creating and deploying images
- Imagine
- Manage Masters
- Manage start-up services
- Default Start Menu
- Post-imagination scripts
- List of profiles
- Add Profile
- Imagination Configurationg
- Sysprep Response File Manager
- Imagination groupsg
Deployment of packages
- List of packages available
- Add a new package
- Packages pending deployment
- List of deployment rules
- Add Custom Rule
- Launch deployment and track execution
Newspapers, monitoring and audit
Manage updates
Backup
Background
Administration
Chapter 2: First steps in Medulla
How to connect to Medulla
To access Medulla's features, you need to log in with your credentials. This step guarantees the security of your data and personalized access.
 Connection steps
Choose your language
On the login page, select the language of your choice from the drop-down menu. By default, the language is French, but you can change it if necessary.
Enter your ID
Enter the username or e-mail address provided when creating your account.
Enter your password
In the Password field, enter your personal password. Make sure it is spelled correctly: upper and lowercases are taken into account.
Validate connection
Click the "Log In" button to access your user space.
For security reasons, avoid saving your password on shared devices.
In case of connection problems, contact your organisation's technical support
Scoreboard
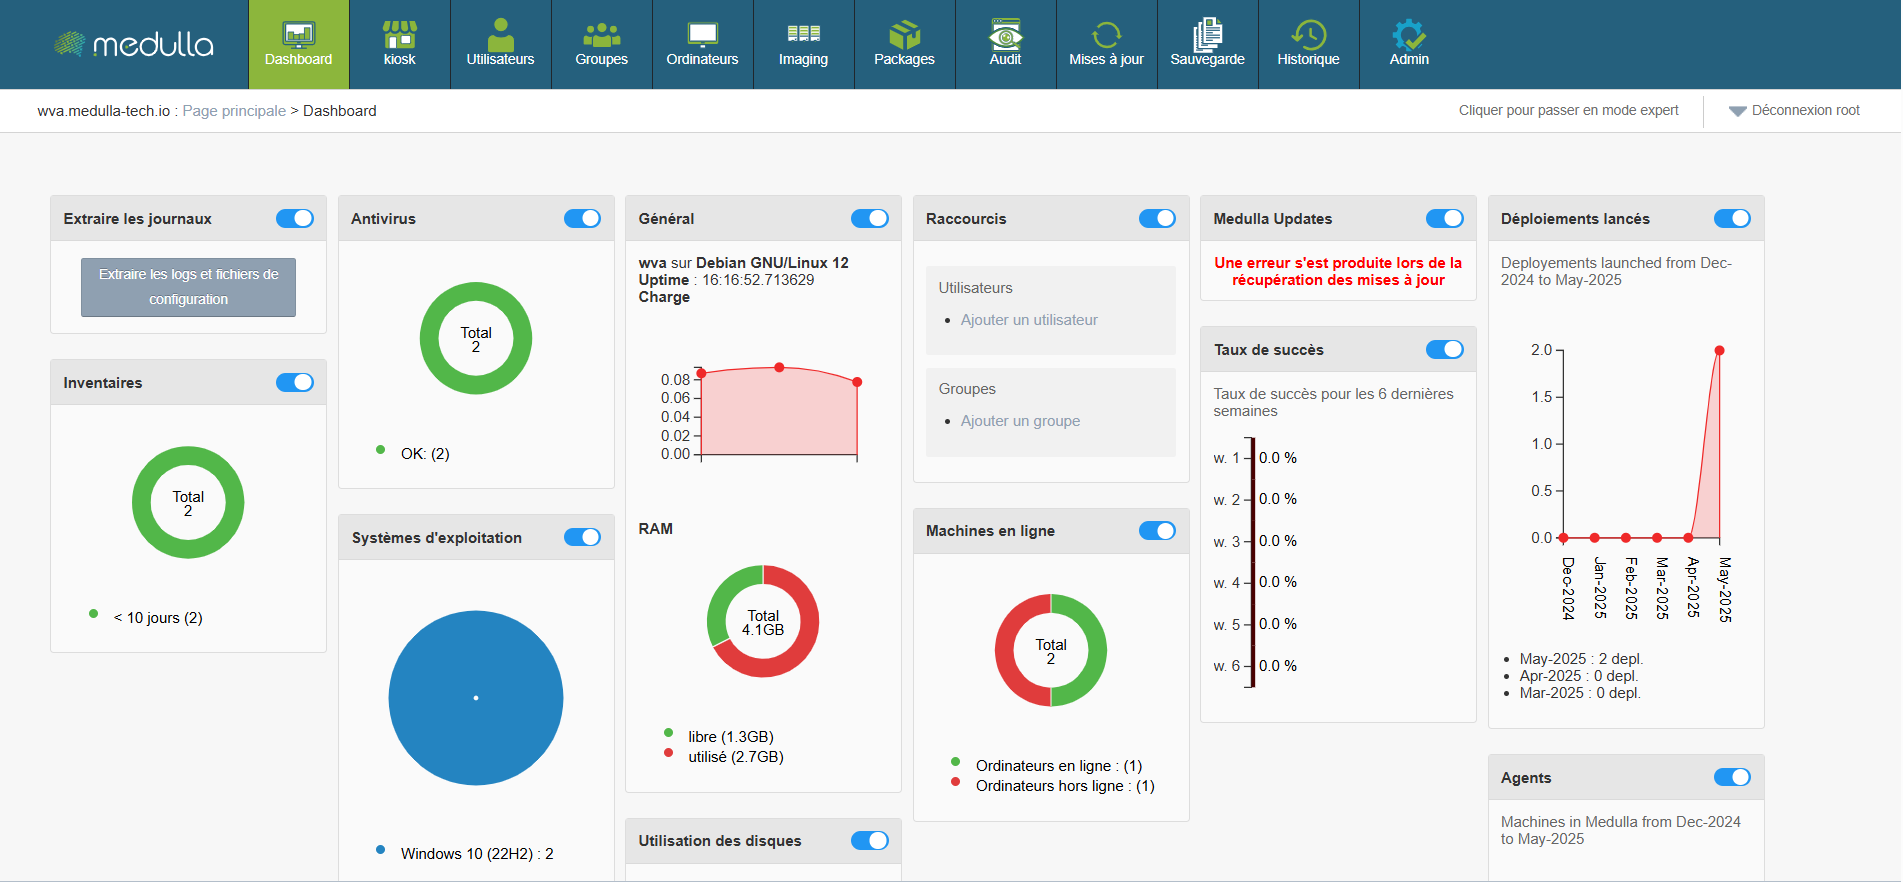
The Medulla dashboard allows you to track the real-time status of your infrastructure with customizable widgets. You can move, resize and organize widgets as you wish. Each widget also has a button to display or hide it, according to your needs.
Some widgets incorporate dynamic graphics for a better understanding of data, updating in real time.
Widgets available
Widgets are categorized by categories and allow you to view various information about your infrastructure. The following are the main categories:
General

Information provided
-
Server name (example: devdemo.siveo.net on Debian GNU/Linux 12)
-
Uptime (time since last system restart)
-
RAM Total RAM available, free and used
Customization
This widget can be moved wherever you want, and it is resizeable to display more or less information according to your needs. You can also hide it with the toggle if you do not need to see this information permanently.
Graphical representation

Online machines
Information provided
- Total number of machines online and offline.
Customization
This widget can be moved and resized as desired. The toggle allows you to display or hide it according to your preference.
Graphical representation
Circular graph to see the distribution of machines online and offline.

Inventory
Information provided
- Total number of items in the inventory and those not updated for more than 10 days.
Customization
The widget is customizable and can be moved and resized. You can also hide it if you don't need it.
Graphical representation
One circular chartshows the items in the inventory, and highlights those requiring updating, thus providing an overview of the inventory status
In summary, the Dashboard is your central entry point to manage and monitor the status of your IT infrastructure. It is designed to be flexible and reactive, providing an overview of the performance of your machines and resources, while allowing you to react quickly to any necessary alerts or updates.
With this set of tools and graphical visualizations, the dashboard gives you optimal control for managing your systems effectively, while having a clear and detailed view of your entire IT environment.
Chapter 3: Kiosk
Kiosk
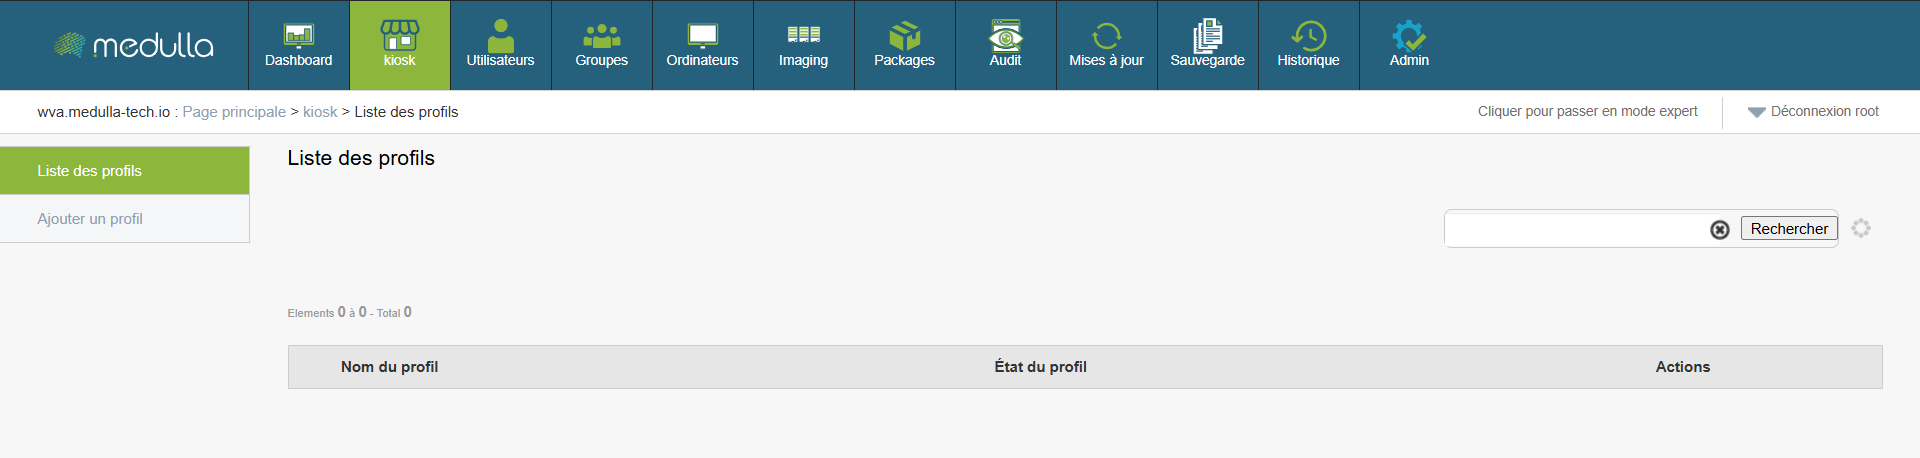
When you arrive on theKiosk interface main page, you are immediately directed to the section Profile List, located at the centre of the page. This is the first thing you will see when you arrive on this page.
The Profile List Section
This section is placed at the centre of the screen and displays all user profiles that have already been created. Depending on the number of existing profiles, you can see different information:
Existing profiles
If profiles have already been created, each profile will appear in a list with information such as:
- Profile Name : The name given to the profile when it was created.
- Profile Status : Whether the profile is Assets or Inactive.
- Management Options : You can edit or delete a profile if necessary.

No profiles created
Don't panic, creating a profile is simple and fast. Follow the steps below to add a new profile in Kiosk. We'll do it together, step by step.
Add Profile

To create a new profile, start with the area to the left of the page.
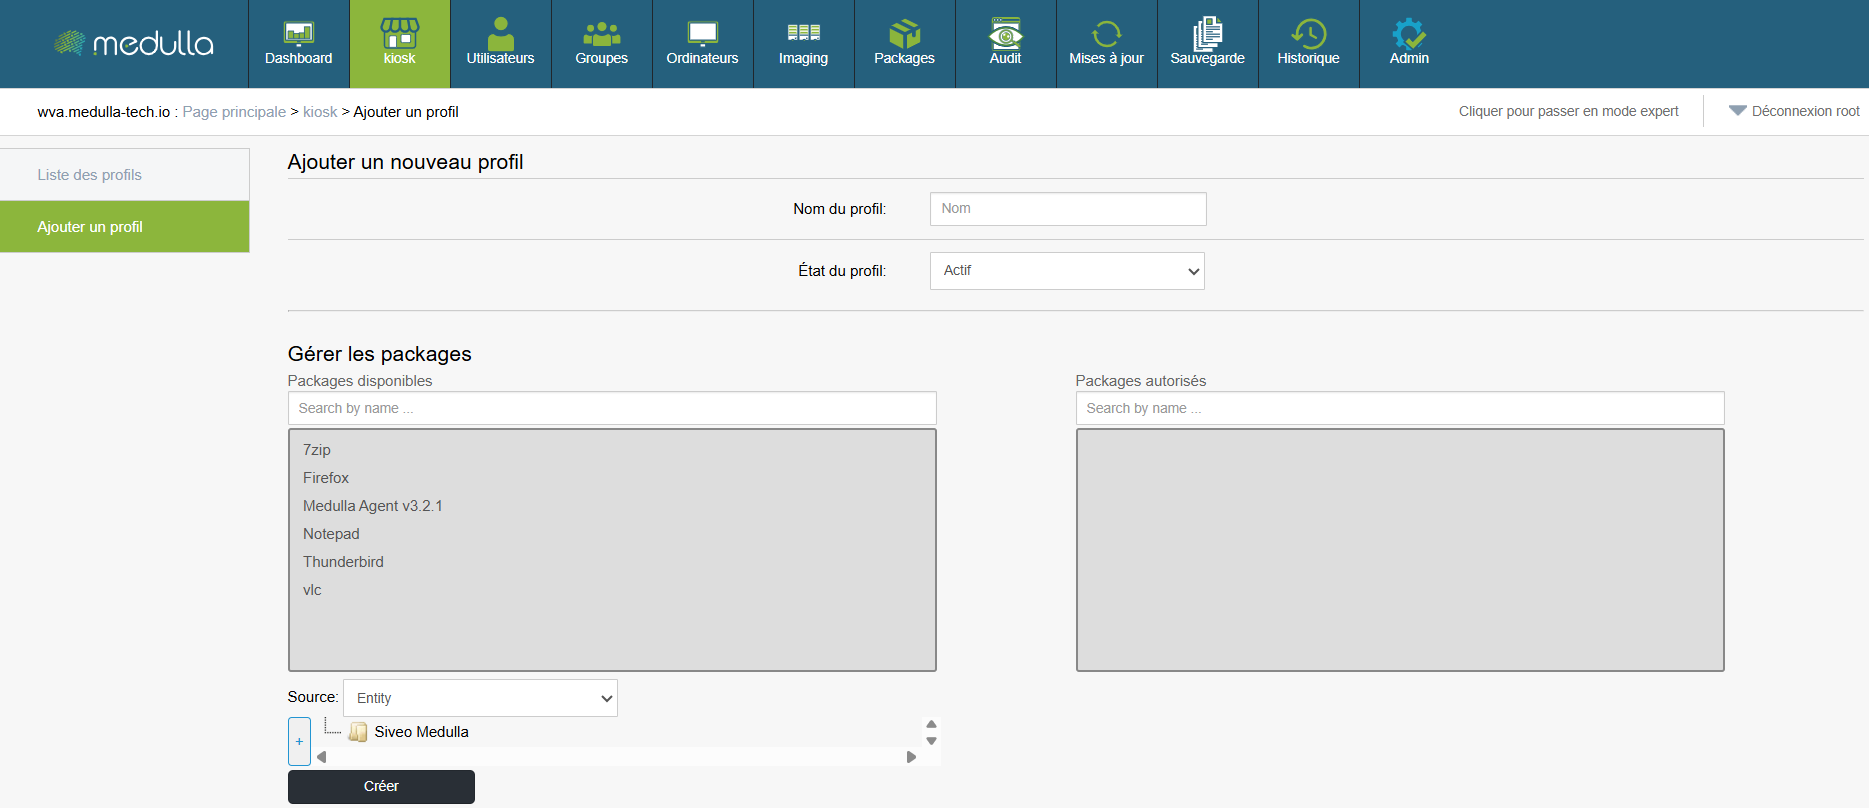
Profile Creation Steps
Click on "Add Profile"
You will find a link entitled Add a profile. Click on it to access the profile creation page.
Fill in the creation form
Once on the page, you will see the form to complete in the centre of the screen. This is where you will configure the profile information.
Information to be completed
-
Profile Name
Enter a name for the profile. This name will then appear in the profile list.
Examples: User1, HR Profile. -
Profile Status
Choose the status of the profile when creating it:-
Assets The profile will be operational immediately.
-
Inactive : The profile will be created but will remain inactive (it will have to be activated later).
-
-
Manage packages (associated applications)
Two blocks are present to manage applications:-
Available packages : List of applications you can add.
Use the field "Search by name..." to search for a specific application. -
Allowed packages : List of applications already added to the profile.
To add an application, select here in Available packages. It will then be added in .
-
-
Source of applications
At the bottom of the form, choose the source(s) of the applications to associate:-
Entity
-
LDAP
-
User
-
Finalization
Once all the information has been completed, click the button Create to validate the profile creation. The new profile will then be added to the Profile List, visible in the centre of the home page.
When adding packages to a Kiosk profile, it is essential that the profile is associated with an inventory.
Without this association, the assignment of packages cannot be carried out.
When deploying packages via Convergence, they must also be linked to an inventory.
Without this link, deployment cannot be performed.
Chapter 4: Users
User Management in Medulla
This section guides you in user management within Medulla. You will learn how to consult existing users, add new ones, assign them roles and organize them into groups.
Unlike the module Kiosk, which focuses on direct interaction, here the aim is to structure access and enhance security through clear permissions.
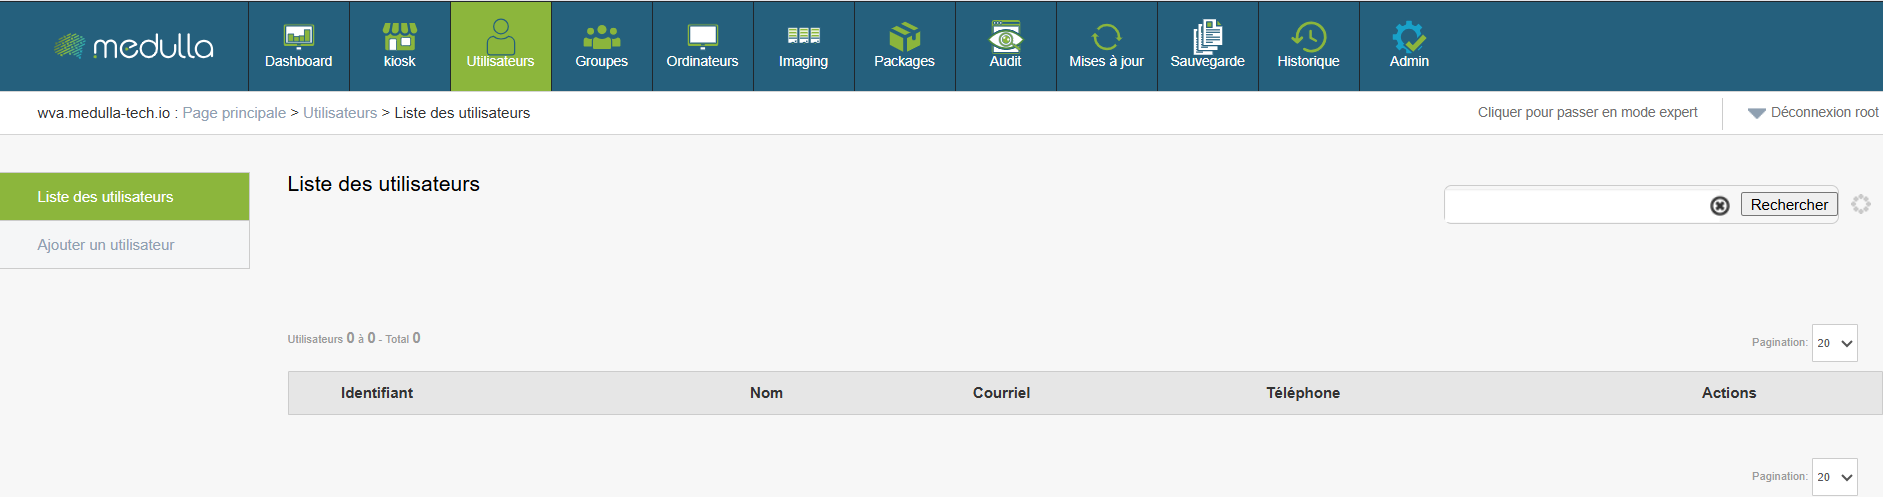
The User List section
Located in the centre of the screen, this section displays all registered users in your Medulla environment.

Existing users
If users have already been created, they will appear as a table with the following information:
-
Identifier : the unique number assigned to the user.
-
Name : full user name.
-
Email : registered email address.
-
Phone : telephone number (if indicated).
-
Actions : options for modify or delete user.
No registered user
If no user has been added again, the central section will remain empty. A message will show that no user has been saved.
See how to add a user
Add User

To create a new user in Medulla, everything happens in the left side column.
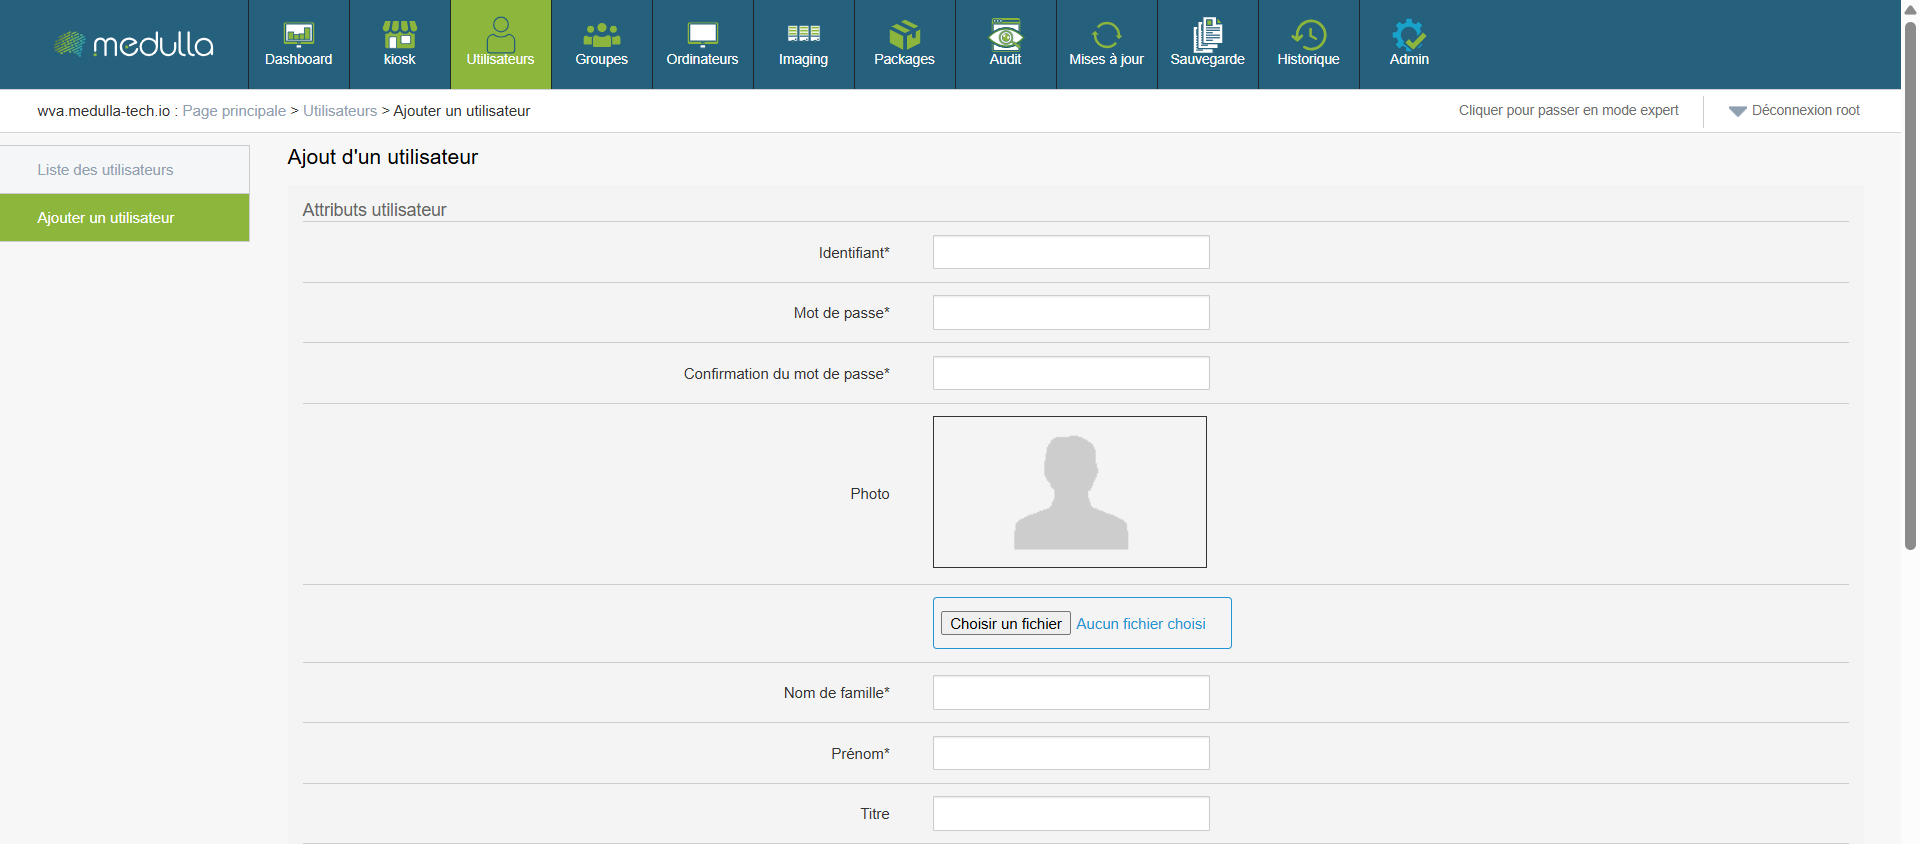
Accessing Creation
Click the linkAdd User to open the creation page.
The form will be displayed in the centre of the screen.
Complete the Creation Form
Here are the fields
-
Identifier : a unique identifier for this new user.
-
Password and confirmation The password that will allow the user to log in.
-
Photo (optional) : possibility to upload a profile photo.
-
Surname / First name
-
Email
-
Phone and Mobile
User groups

Group organisation makes it easy to manage access rights.
-
Primary group : the main group to which the user belongs.
-
Secondary groups : other groups to which you can add to extend its rights.
Define access rights (Entity rights)
At the bottom of the form you can set user access rights through several options:
-
Public
-
Super administrator
-
Recursive
-
Statistics
These options define the scope of actions that the user can perform in Medulla.
Finalizing the creation
Once all the fields are completed, click on .
The user will then be automatically added to the List of Users, visible in the centre of the main page
Edit an existing user

At any time, you can change the information of an existing user.
-
Go to the List of Users (centre of page).
-
Locate the user concerned.
-
Click Modify in the column "Actions"
-
Update the required fields (name, email, groups, roles, etc.).
-
Save the changes.
Modify MMC Rights
To adjust a user's access rights in Medulla, you can change its MMC rights (also called ACLs – Access Control Lists).
Quick access to MMC rights
sinceList of users, click on the small Key located to the right of the user line.
You will be redirected to the page .
You will see acomplete list of modules and pages de Medulla, sorted by categories Users, Groups, Computers, Logs, Imaging, etc.
-
Medulla's global logs, grouped by Kiosk module, Imagining, Remote Desktop, Backup, etc.
-
Past actions by all users according to its level of access
-
The date, user, and nature of each action Profile creation, group modification, machine removal
-
Technical details related to each action (IP, targeted machine, state, etc.)
If no not rights on a module (e.g. not see logs associated with this module in history, even if access to history is allowed.
Chapter 6: Groups
Groups

Group management is an essential pillar of administration in Medulla.
Instead of configuring the rights and resources for each user or machine individually, the groups enable the organization to be centralized and common rules to be applied more effectively.
The groups are used to:
-
Gathering users or posts functional or technical criteria
-
Implementing common policies (access, permissions, configurations)
-
Divide roles coherently
-
Simplifying rights management, especially in complex environments
This approach facilitates Global pilotage, improves Security and strengthens the organisational coherence.
Unlike Kiosk, which works by individual profiles, the logic of groups in Medulla is designed for a collective and structured management of accesses and configurations.
List of Groups
On the main page of this module you have access to a full overview of existing groups in your Medulla environment.

Existing groups
When groups are already created, they are displayed as a table, with the following information:
-
Name of group : The identifier assigned at the time of creation.
-
Remarks An optional description of the role or objective of the group.
-
Available actions :
-
Consult details of the group
-
Modify parameters
-
Remove the group if necessary
-

Continue here to see how create a group
Add Group

To create a new group in Medulla, follow these simple steps
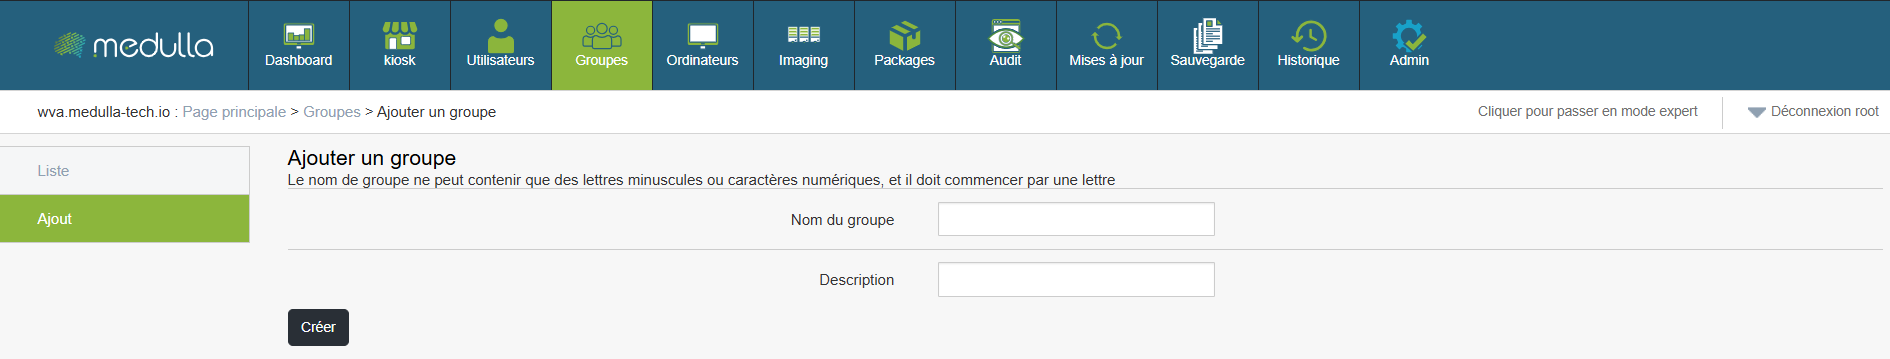
Go to the creation page
Form of creation
Once on the dedicated page, you will find a form to complete to define the group properties.
Fields to be completed
- Name of group :
The name must start with a letter, and contain only tiny characters or numbers. This ensures consistency throughout the system.
-
Description :
You can specify here the intended use of the group, e.g. "Support Team Group" or "Training Room Officers".
Finalizing the creation
Once all fields are filled, click on Create.
The group will then be recorded and added automatically to the List of Groups on the main page.
Chapter 5: Computers
Computers

This section is dedicated to the complete management of all IT posts in Medulla. Whether you want to monitor, organize, or interact remotely with your machines, everything is centralized in a user-friendly and intuitive interface.
Computer management in Medulla is based on a centralized interface accessible via the XMPP view. From this interface, you have access to all the features necessary to monitor machine condition, perform targeted searches, apply filters, and perform various actions on your computers, all in real time.
XMPP View of Computer Posts
The XMPP view is the heart of post management in Medulla. It allows you to track and interact with each machine in real time. This module centralizes the information and possible actions for complete control of your computer fleet
Filters and Post Selection
At the top of the page, you have three radio filters to select the positions according to their connection state:
-
All computers : Displays all machines, regardless of their condition.
-
Computers online : Only displays currently connected posts.
-
Offline computers : Displays machines that are not connected at the moment.
These filters are convenient for quick and targeted machine management based on availability.
Entity Filtering
Global research
Through the search field "Search all fields", you can search for a machine by typing a keyword. This search field applies to all fields visible in the table, such as machine name, IP address, operating system, or associated entity.
Actions Available on Post
Under each IT station in Medulla, you have several actions at your disposal for remote management and control. These actions include advanced features such as machine inventory, monitoring, remote control, and much more. For a detailed view of each function, see Admin part which addresses these options in depth.
Here is an overview of the actions available:
![]() GLPI Inventory Monitoring and managing hardware and software configurations via integration with GLPI.
GLPI Inventory Monitoring and managing hardware and software configurations via integration with GLPI.
![]() Monitoring Real-time monitoring of machine performance.
Monitoring Real-time monitoring of machine performance.
![]() Remote control Direct access to machines to perform troubleshooting or maintenance actions.
Remote control Direct access to machines to perform troubleshooting or maintenance actions.
![]() Ur BackupManagement of machine backups via UrBackup.
Ur BackupManagement of machine backups via UrBackup.
![]() Software deployment Remote software installation or updating.
Software deployment Remote software installation or updating.
![]() Managing Imaging Deployment and management of system images.
Managing Imaging Deployment and management of system images.
![]() XMPP Console Verification of machine connectivity and real-time interaction via XMPP.
XMPP Console Verification of machine connectivity and real-time interaction via XMPP.
![]() Edit configuration files Changing remote configuration files.
Edit configuration files Changing remote configuration files.
All GLPI computers

This section displays only computers that have been synchronized withGLPI through automated inventory. You can view all machines registered in the GLPI system and check their status.
Features:
-
View similar to the main page : You will find a visual interface identical to that of the view "All computers", with options to filter machines in line or Offline.
-
GLPI fields displayed : Key information on GLPI synchronized computers is visible, such as:
-
Name of machine
-
Operating System (OS)
-
Entity to which the machine is attached
-
Last user
-
And other important information
-
-
Filtering by connection state : The interface allows you to filter machines online and offline according to their synchronization status with GLPI.
-
Display conditioned to GLPI connection : Only computers that have been properly synchronized with the GLPI inventory will display here. If no machine appears, this may mean that the GLPI inventory has not been properly configured or that the machines have not yet been synchronized.
If no posts appear here, this means that the GLPI inventory is not yet configured or that the machines have not been synchronized
All groups
Favorite groups
Once computer groups are created, you can mark some as favorites for quick access.
Favorite groups are useful for:
Teams that regularly work on the same set of positions
Preparation of clustered action scenarios (imagining, updating, etc.)
Monitoring critical or sensitive machines
All groups

This section displays all groups computers available in your Medulla instance. You can manage all groups centrally and carry out large-scale actions, such as:
Software deployment
Installation of updates
Remote restarting of machines
Export of reports in CSV format
It also allows for a large-scale set of actions, such as software deployment, installation of updates, reboot of remote machines, or export of reports in CSV format
Add Group
Medulla offers several ways to structure and organize your computer park through a flexible group system. When creating a group, you can choose between several methods:
Creating a dynamic group

The dynamic groups allow you to automatically target machines according to predefined criteria. These groups automatically update as soon as a machine meets or no longer meets the chosen criteria.
Modules available for creating a dynamic group:
GLPI : requests based on GLPI inventory (OS, hardware status...)
XMPPMaster: requests related to XMPP actions (real time communication, monitoring...)
Group: to cross or filter existing groups
Dynamic groups are particularly useful in constantly changing environments or for automated targeted deployment
Creation of a static group
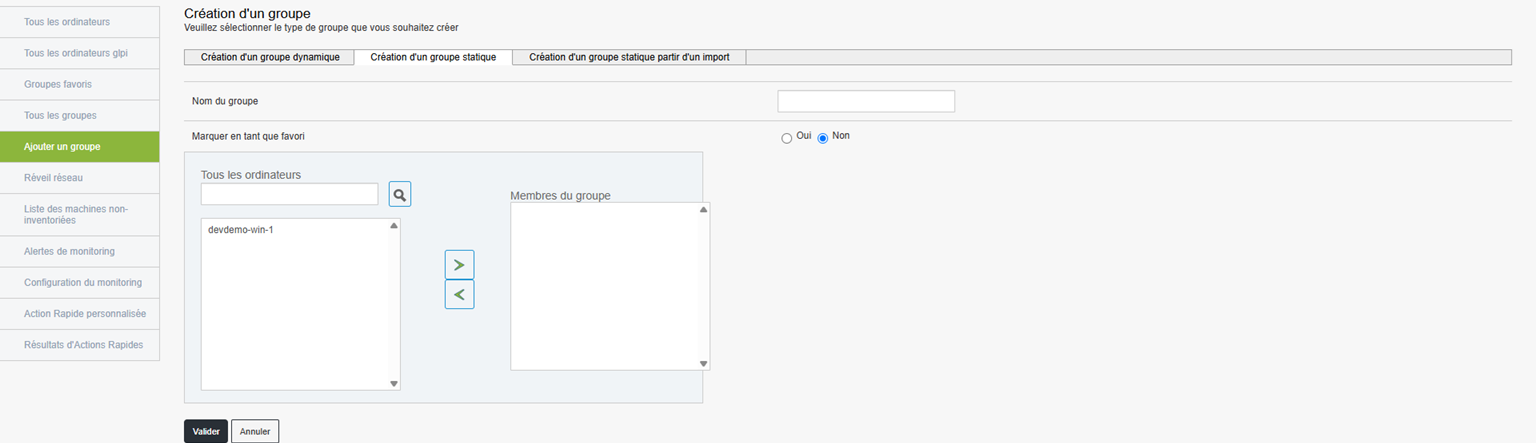
The static groups are created manually, explicitly selecting the machines to include. Unlike dynamic groups, the composition of a static group does not change automatically. You will need to add or remove machines as needed.
Operation:
Name of group : Give a clear and relevant name to the group.
Favorite : Check this option if you want the group to be easily accessible from the favourite groups menu.
Selection of machines Choose the computers to include in the group from the list of available machines.
Typical examples of use:
Create a group of Test machines.
Prepare a set of computers to manually configure.
Follow one fixed set of items in a specific context.
The static group is ideal for specific contexts or tracking
Creation of a static group from an import

If you already have a list of machines (in format CSV or Excel), you can easily create a group from this file.
Creation Steps:
Name of group : Enter a name for the group.
Favorite : Check this option if you want the group to be a favourite.
Import File : Click "Choose a file" to import your list (formats CSV or Excel compatible).
Define data types : Indicate the types of data contained in the file (e.g., Machine Name, User, Inventory Number, Operating System, etc.).
This method is perfect if you retrieve information from an external system or a structured Excel sheet.
Network clock

The Network clock (or Wake on LAN - WOL) is a convenient feature that allows you to remotely start off machines, provided they are configured to accept this command.
How does it work?
Accessible from the Medulla main menu, this feature displays a list of machines compatible with the network alarm. You will be able to take control remotely and manage the ignition of the stations without having to move physically.
Information available for each machine:
Name of machine : Identifier of the post you want to wake up.
Current status : Display the status of the machine (online or offline).
Action button : Lets you try to wake up the selected machine. A click on this button will try to send the alarm command.
Prerequisite:
The Wake-on-LAN based on an adequate configuration of the BIOS/UEFI of the positions. Make sure this feature is enabled on the machines before you can wake them up remotely.
Typical uses:
Start groups of machines before an operation deployment or maintenance.
Wake up computers for update or to launch backups during the night, in order not to disrupt the business activity during the day.
Benefits of Wake on LAN:
Time savings : Start multiple machines simultaneously remotely.
Flexibility : Keeps computer stations up to date and performs maintenance operations without physical intervention.
Increased productivity : Ideal for IT teams that have to manage a large number of machines without disturbing users.
This feature is based on the BIOS/UEFI settings of the stations (Wake-on-LAN must be enabled)
Typical use
Start a group of positions remotely before deployment
Wake up computers to keep them up to date or run backups at night
List of non-inventory machines

This section allows you to quickly identify machines that are not properly inventoried in Medulla. They may be machines that have never reassembled information, or machines that have been offline for too long.
Objective:
Identify inactive or poorly configured machines.
Check the correct functioning of XMPP/GLPI agents on machines.
Identify machines that have been removed without cleaning in the base.
Overview:
When accessing this page, a table will appear, listing all machines with inventory anomalies. Here is the information available in this table to help you diagnose and solve these problems:
Columns in the table:
XMPP machines : List of machines with an activated XMPP agent, allowing real-time communication with Medulla.
JID (Jabber ID) : Unique identifier of the XMPP agent, used to connect to Medulla.
Archi : Hardware architecture of the machine (e.g. x86_64, ARM, etc.).
Class : The class of the machine (e.g. PC, server, terminal, etc.).
Presence of kiosk : Indicator showing whether the Kiosk is installed and operational on the machine.
OR Users : Organization Unit associated with machine users.
OR Machinery : Organization Unit associated with the machine itself.
Cluster name : Name of the cluster to which the machine might belong (if applicable).
Cluster Description : Additional description or details on the machine cluster.
MAC address : MAC address of the machine, useful for uniquely identifying network devices.
IP XMPP : IP address used for XMPP communication.
Actions : Buttons allowing to perform actions on the machine, such as removing, updating or repairing the agent.
Typical use cases:
Inactive machine suspicion or defective agent:
If you suspect that a machine is no longer active or that the XMPP/GLPI agent is no longer working properly, this page is an excellent starting point for checking its condition. In particular, you can identify the machine through MAC or XMPP IP.Inventory cleaning or audit preparation:
If you are doing an inventory cleaning or preparing an audit, this list allows you to identify the machines to be checked or deleted from the database. You can quickly filter and locate audit machines, for example by consulting information such as the presence of the Kiosk or the XMPP status.
Practical tip:
If a machine appears in this list but no longer appears in "All computers", this may mean that it has been disconnected for a long time or that its XMPP/GLPI agent is misconfigured. You can then take the necessary steps to solve the problem (reinstallation of the agent, deletion of the entry, etc.).
Monitoring alerts

This section centralizes all alerts generated by monitored machines in your Medulla environment. It allows you to track, in real time or delayed, hardware or software incidents detected by supervisors deployed on your machines.
Objective
Identify critical or recurring incidents : such as disk failures, device errors, network anomalies, or any other problem affecting monitored machines.
Ensure clear traceability of events : by keeping a precise time stamp for each alert in order to ensure a complete follow-up.
Allow rapid reaction by alerting administrators to detected problems so that they can respond quickly.
Alert history
When no alert is currently active, you can view history of past events. This includes resolved alerts, thus ensuring complete traceability of incidents and interventions on your machines.
Information available in history:
If alerts are recorded, the table will show the following:
Name of machine : Name of the machine concerned by the alert.
Date of event Date and time of incident.
Type of event Category of incident (e.g. device error, hardware failure).
Machine message : Details of the error or problem raised by the machine.
Device concerned : The device related to the incident (e.g. hard drive, network card).
Status Current status of the alert (open, ongoing, resolved).
Message : Alert message generated by the Supervisory Officer.
Serial number : Device or machine serial number.
Firmware : Version of the firmware involved in the incident.
Commentary : Space for comments or clarifications on the incident.
Available actions : Actions to be undertaken on the incident (e.g. solve, ignore, export).
In particular: If the table is empty, this means that no alerts have yet been detected or stored in your environment.
Monitoring Configuration

In this section, you can customize the monitoring settings applied to positions via a centralized configuration file.
When you access this page, an edit area is displayed directly on the screen, allowing you to change the contents of the following configuration file
/var/lib/pulse2/xmpp_monitoring/confagent/monitoring_config.ini
All changes you make in this space are automatically recorded, no need to click on a validation button.
Recommendations
Before any modification, it is advisable to make a backup of existing file.
Apply the changes with precautionary and test them on a few machines.
Contact your system administrator if you have a doubt about a parameter.
Quick Action Custom

The Custom Quick Action section allows you to create and manage automated actions that will be executed remotely on your machines. These actions may include specific scripts or commands, thus facilitating mass management and automation of administrative tasks on multiple posts simultaneously.
Overview
Once in this section you will see a list of all the custom quick actions already configured for the user root. If no action has yet been created, an empty array will appear, allowing you to add custom commands.
The table contains the following information:
Custom order name : The name assigned to quick action. This name will be used to identify the action.
Description : A summary or a detail of what the action does. This allows you to quickly understand the purpose of the command without having to consult your script.
Operating system : The type of system for which quick action has been defined (e.g. Windows, Linux, macOS).
Actions : Options available for modify or delete rapid action already in place.
Create a new custom quick action

To create a new custom quick action, just click on the button "Create a personalized quick action" at the top of the page. This will redirect you to a form where you can define the parameters of your new order.
Form for creating a custom quick action
The form is divided into several essential fields:
Operating system :
Choose the target operating system on which the command will be executed. Example: Windows, Linux, macOS, etc.Order name :
Give a unique name to this quick action so that it can be easily identified among the other commands. This name must be clear and descriptive to avoid confusion.Command or Script :
Enter the exact command or script you want to run remotely on the target machines. For example, you can enter a command like:shutdown /r /t 0to immediately restart a Windows machine, or another administration script adapted to your needs.Description of the order :
Add a concise description explaining the objective of the order. This will help all administrators understand its usefulness, even if they are not responsible for its creation.
Once all fields are filled, you will only have to validate to record and activate the action. The action will now be available in the list of custom commands and can be executed on target machines.
Verification : Before performing an action on a large number of machines, test there on an isolated machine to make sure it works as intended.
Documentation : It is recommended that each quick action be well described so that all users can understand its usefulness and effects.
Security : Controls can have a significant impact on systems. Ensure that only authorized and necessary actions are performed.
Chapter 6: Imagining I
Imagine

This section is dedicated to thecheck the state of the server's imaginationg, an essential step before any action to deploy a system or create a reference image.
The imagining server is a central component of Medulla: it allows to send a system image (a complete "photocopy" of a computer) to one or more stations. If this server is unavailable or failing, no imaginative operation will succeed.
It is therefore recommended that: systematically check its status before each action of this type.
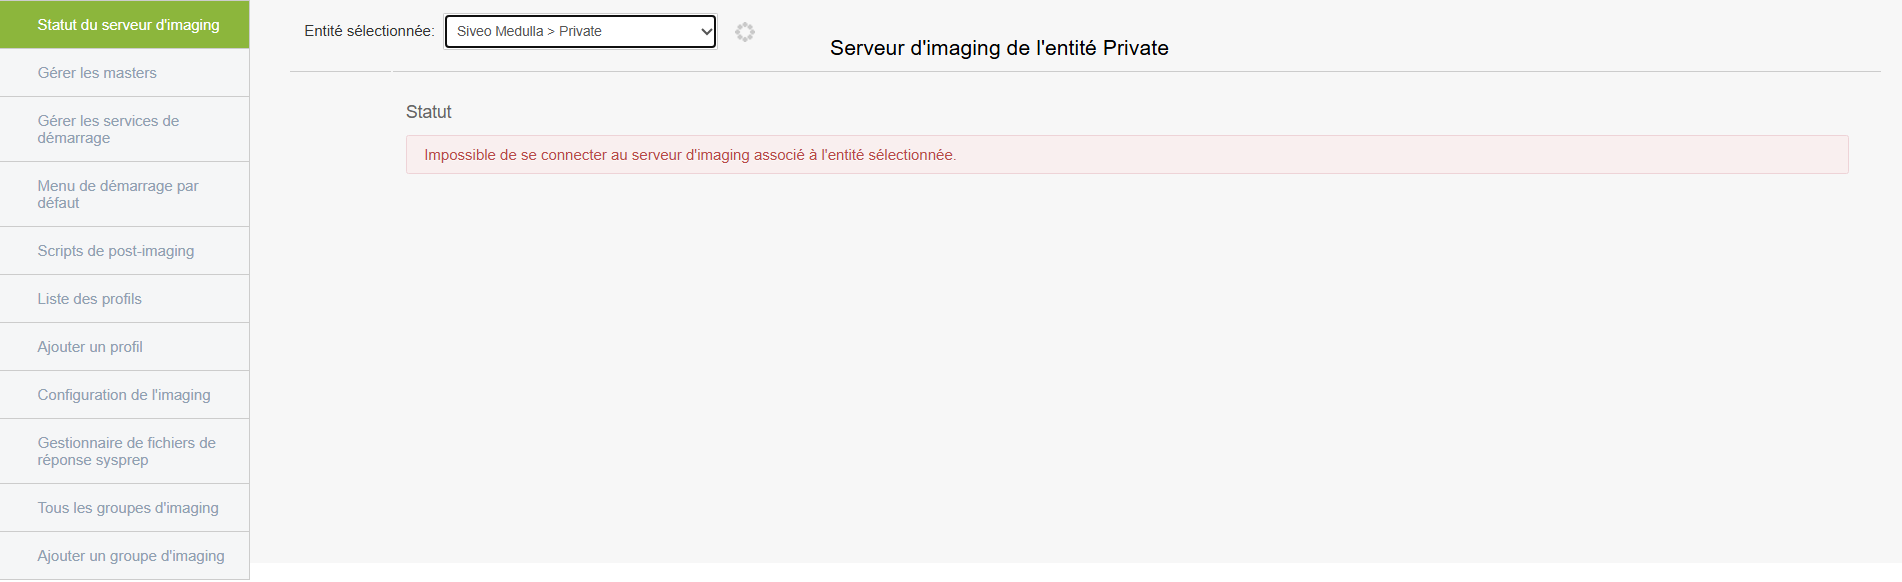
Access to the Imaging Server Status
When you clicked on the tab Imagination server statusg , we immediately access the page where the pre-selected entity is neither private nor public, so we will call it general.
"General" entity with offline server
This means that the "General" entity is inactive. You will not be able to deploy image on the machines of this entity
Understanding the Information Provided
Selected entity
At the top of the page, you have to chooseentity concerned.
Entities are logical groupings, often used to separate environments (e.g. services, departments, institutions).

Examples of entities:
- Public
- Private
- General
Why is it important:
Each entity can be connected to a separate d-imag server. It is therefore crucial that control the correct server status for the entity you want to use.
Server status
For the selected entity, a visual indicator informs about the current status of the server.
Three statutes may appear:
- Available
The server is running. You can create an image or deploy. - Offline
The waiter isn't responding.
No imaginative operation can be carried out.
Recommended action: contact the administrator or technical support. - Connection error
The server is reachable, but the connection fails (often related to a configuration or network communication problem).
Operations are blocked.
Recommended action: report the problem to the technical team.
"Private" entity with connection error
Even if the server seems accessible, communication does not work.
deployment will fail from launch, because the connection between Medulla and the server is broken.
"Public" entity with successful connection
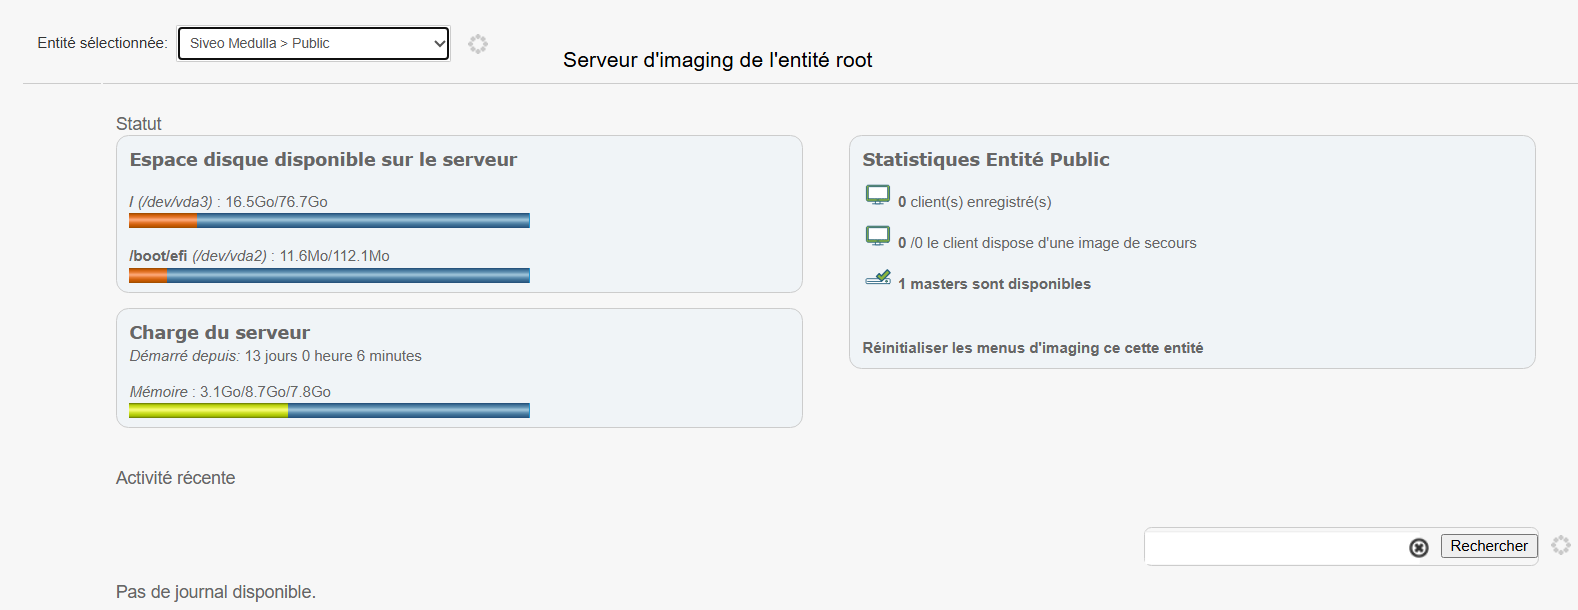
If there are no errors and the server is online, this means that the server is active and ready to be used, so it will display different statistics as shown with the "public" entity above.
In this case, it will display various information:
- Disk space available on the server: This section shows the server's storage capacity, i.e. the space available to host system images. This space is divided into 2 parts called "partitions", the first (dev/vda3) is the main partition and the remaining free space means that there is still room for storing images. The second is a small partition used to boot the server but has no impact on deployments.
- Server load: These are data that allow you to have a general idea of the state of the server, such as the time of ignition without restarting and the use of RAM.
- Statistics public entity: This is information about the use of imagination in the entity. Customers match the machines associated with the entity, the customer has x backup images telling us which machines needed restoration and the number of Masters available tells us the number of system images ready to be deployed.
Before any operation of imagining, check that you are well positioned on the right entity and that the status of the server is indicated as "Available".
In case of status Offline or « Connection error », do not pursue and inform the administrator or support.
Manage Masters
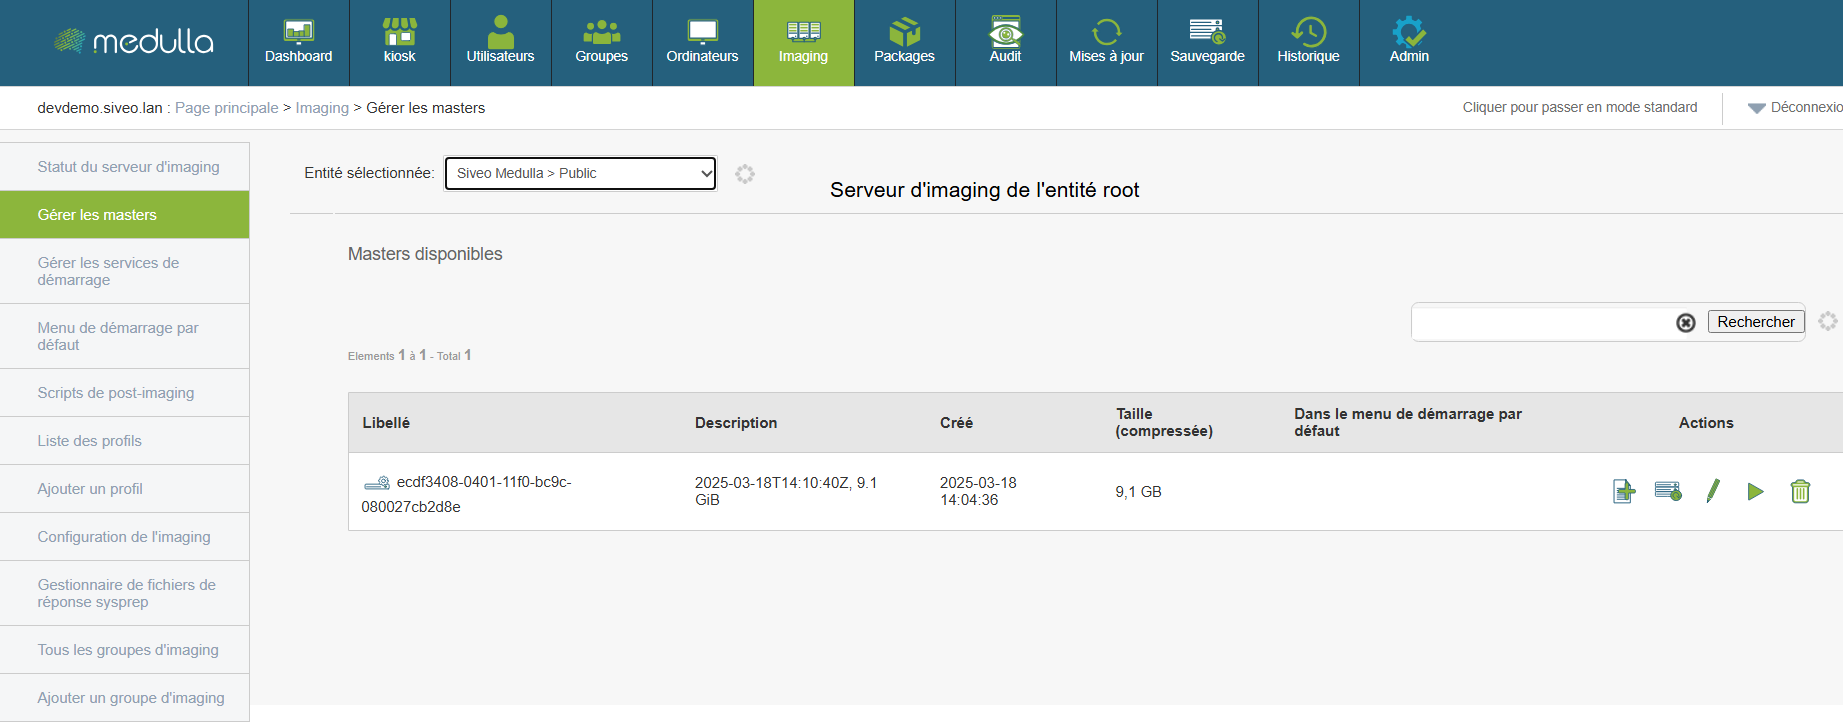
One Master is a complete system image, created from a configured position. It serves as a model for the rapid and homogeneous deployment of an environment on other machines.
Before deployment, it is essential to know the available Masters and how to use them.
Reading displayed information
Each master is presented as a line with several elements:
Wording : automatic image ID.
Description : optional text describing the content or purpose of the image.
Date of establishment : indicates when the image was generated.
Compressed size : image file size (expressed in Go).
Default Start Menu : specifies whether the image is used automatically during network startup.
Actions : set of options available on the image.
Use a master for deployment
Choose a Master in the list.
Check his date, its description and size to make sure it matches what you want to deploy.
Select image as the basis for the deployment of one or more stations via the dedicated interface.
The master system will automatically be installed on the target stations without manual intervention on each machine.
Actions available for each image
For each master, you can perform several operations:
Before using a master, check that it matches the desired configuration, including operating system, version and installed software. Do not delete a master unless you are certain that it is no longer used, as this action is irreversible. In case of doubt about the image to choose from or the action to take, it is recommended to contact your technical reference for advice.
Manage start-up services
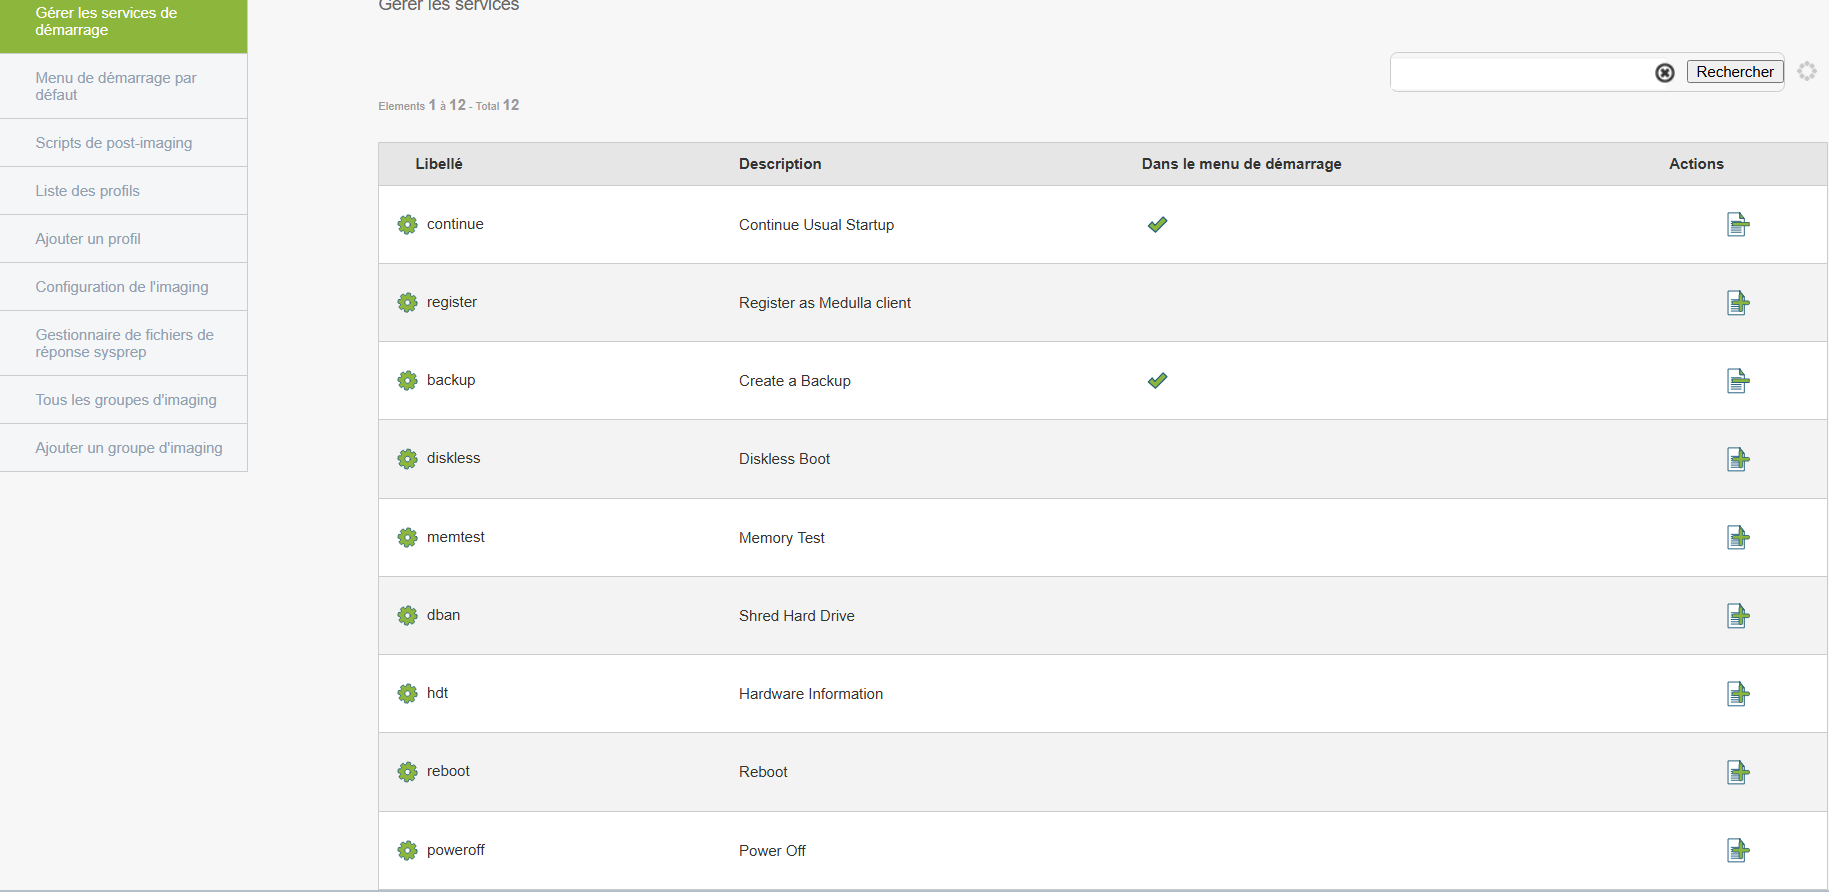
Start-up services allow machines to launch an image from the network (e.g. via PXE).
To configure
You can
Enable or disable certain services
Adapt startup to your environment
Default Start Menu
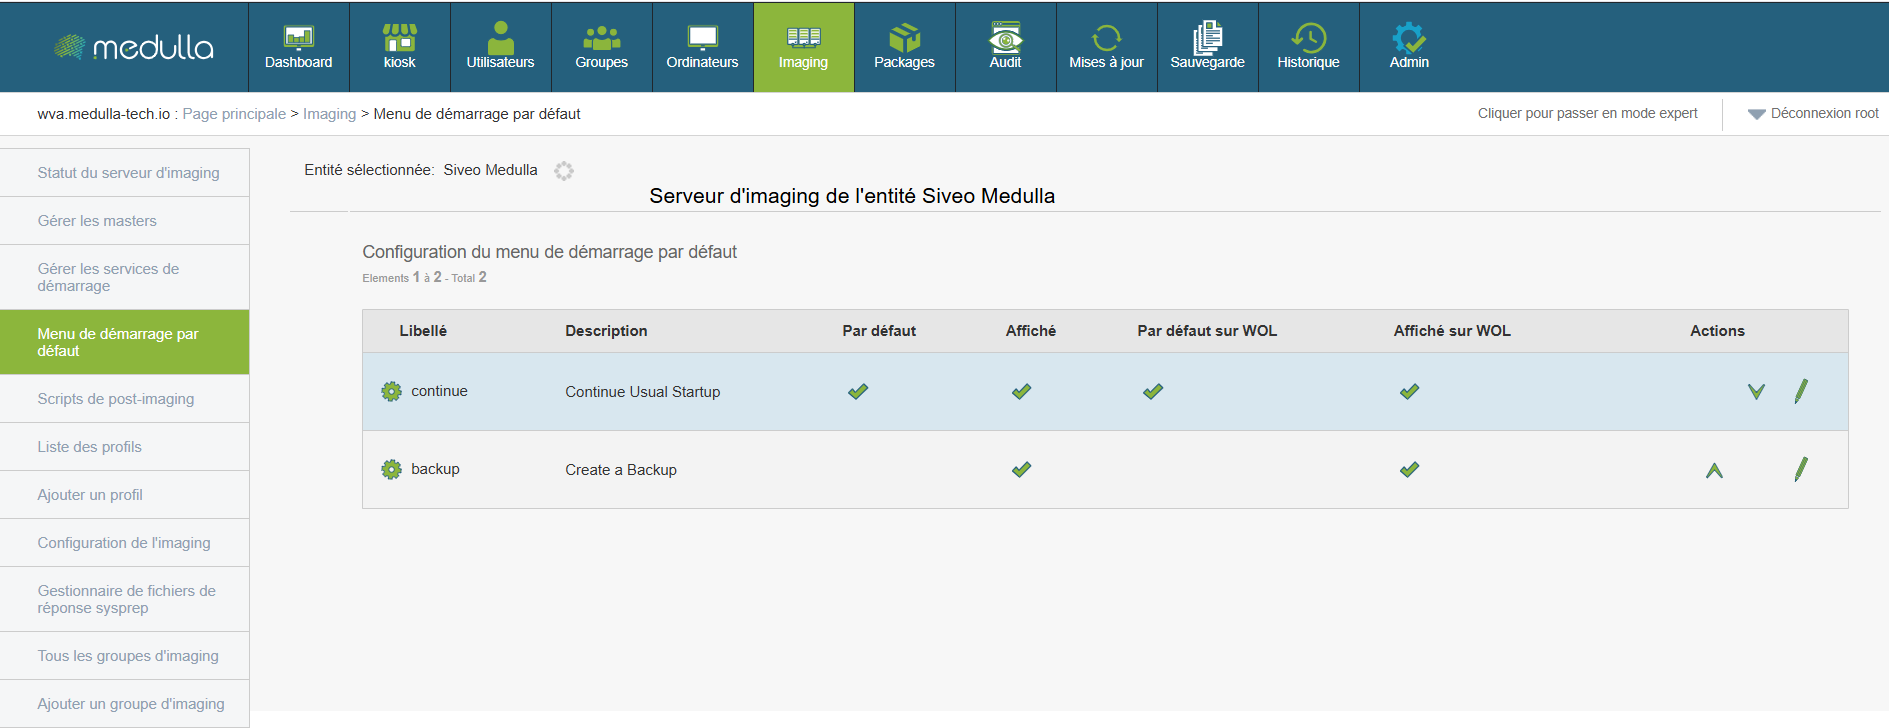
This section lets you choose the behavior automatic or manual When machines start.
Access
Available options
You can edit each option to adjust:
-
Default selection
-
Classic or WOL start display (Wake On LAN)
Post-imagination scripts

Enables automated actions after the deployment of an image (such as installing software or configuring the network).
To create/modify a script
Chapter 7: Imagining II
List of profiles
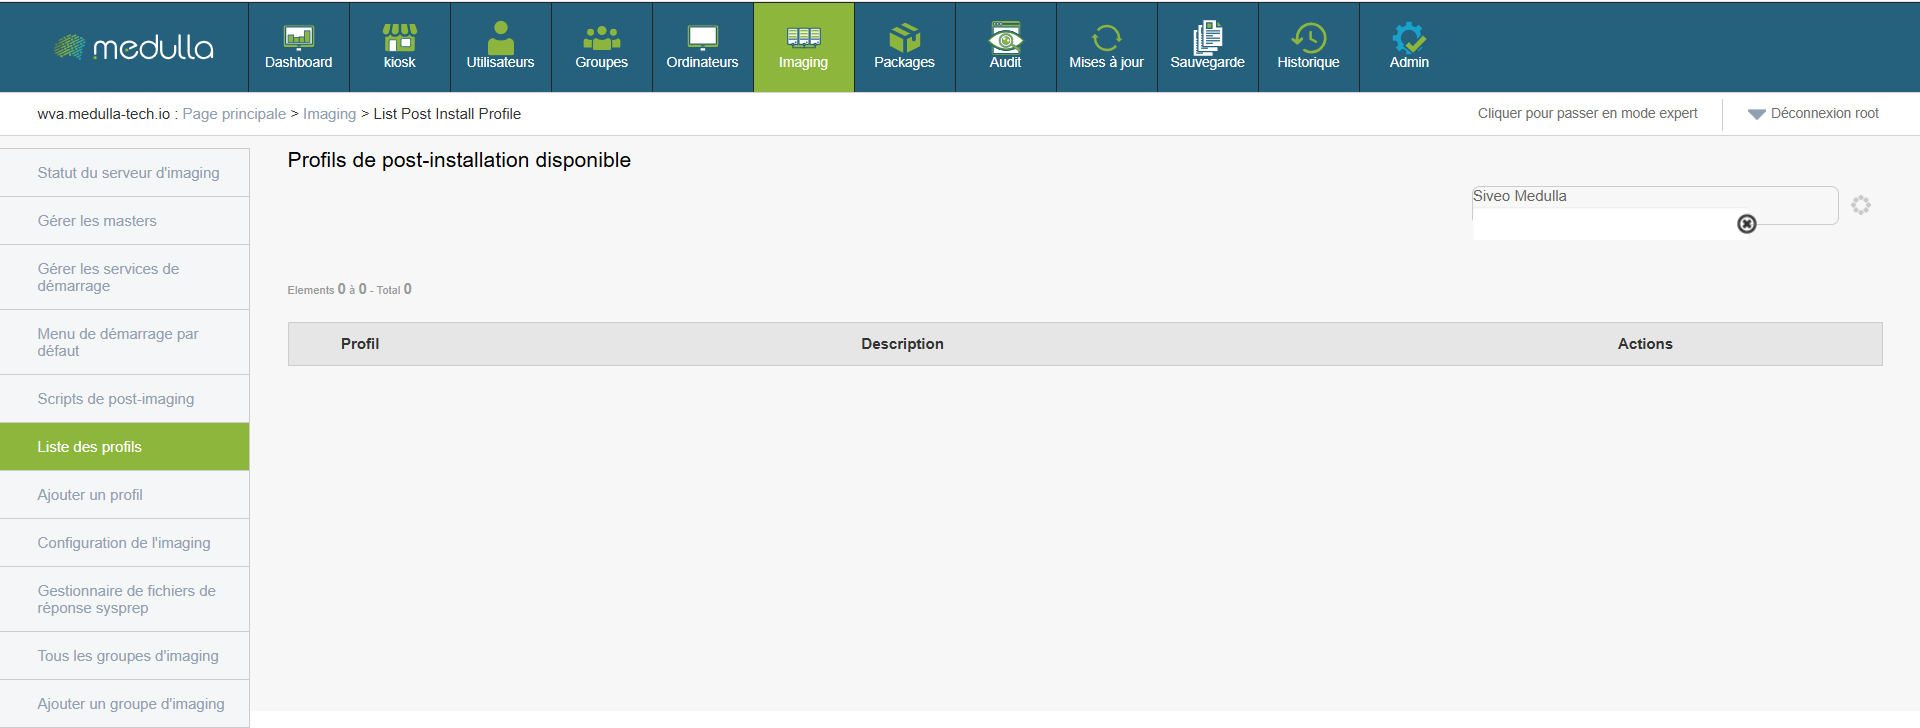
Displays all user profiles created for imagining.
Central area showing profiles
- Name
- Statement (Active/Inactive)
- Possible actions: Edit, Delete
Add Profile
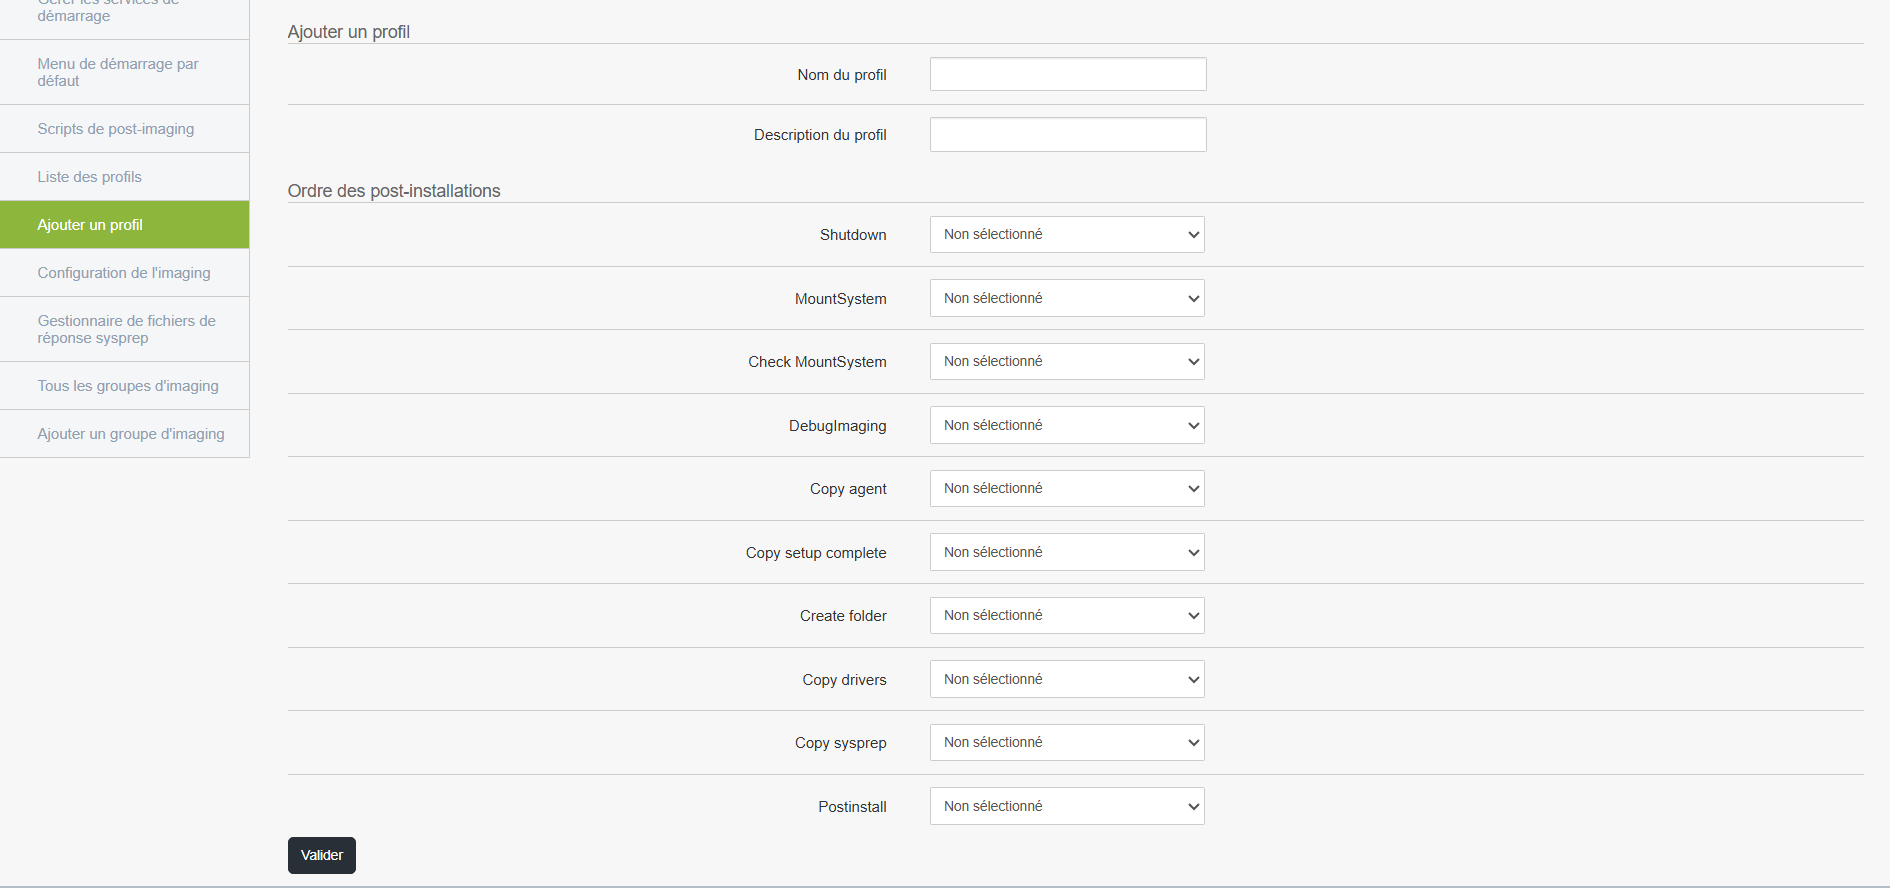
A profile includes a set of automatic actions that run after a system image is deployed to a post. These actions automate tasks such as copying files, system configuration, or installing specific elements.
Access and editing of a profile
From the management interface it is possible to:
- Add New Profile
- Edit an existing profile
- Delete profile if necessary
List of available post-installation actions
Here are the actions that can be defined in the desired order.
All are disabled by default, you must select them manually if you want to apply them:
Shutdown: turn off the post automatically after all steps have been completed.
MountSystem: mounts system partitions, useful to access certain files before the end of deployment.
Check MountSystem: Check that the system has been installed.
DebugImaging: activates a diagnostic mode to analyze the process of imagining (mainly used by technicians).
Copy agent: copy the Medulla agent on the post, necessary for remote management.
Copy setup complete: add a file or script to the end of installation.
Create folder: creates one or more custom folders on the post.
Copy drivers: copies the necessary drivers to the target machine.
Copy sysprep: installs files related to Windows system preparation (Sysprep).
Postinstall: entry point to execute a script or custom command once the installation is complete.
Use of the profile
Create or modify a profile according to the specific needs of your organization or the targeted position.
Select the desired actions in the appropriate execution order.
This profile will then be associated with a deployment task, so that the selected steps are automatically applied after installation.
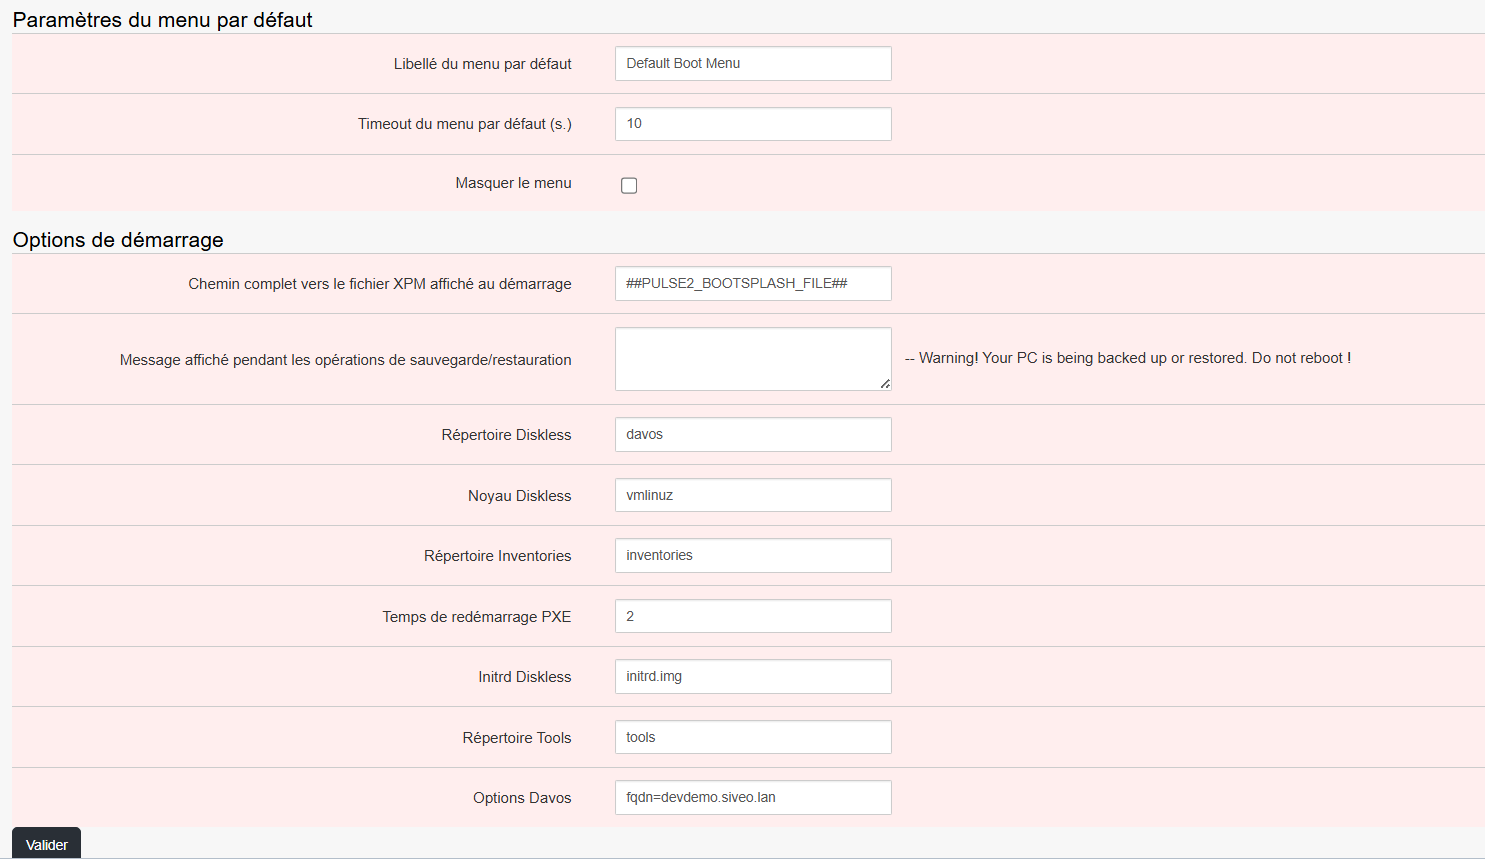
Configuring the imaginationg
Allows to adjust the overall parameters of the Imaging environment (e.g. servers used, strategies, etc.)
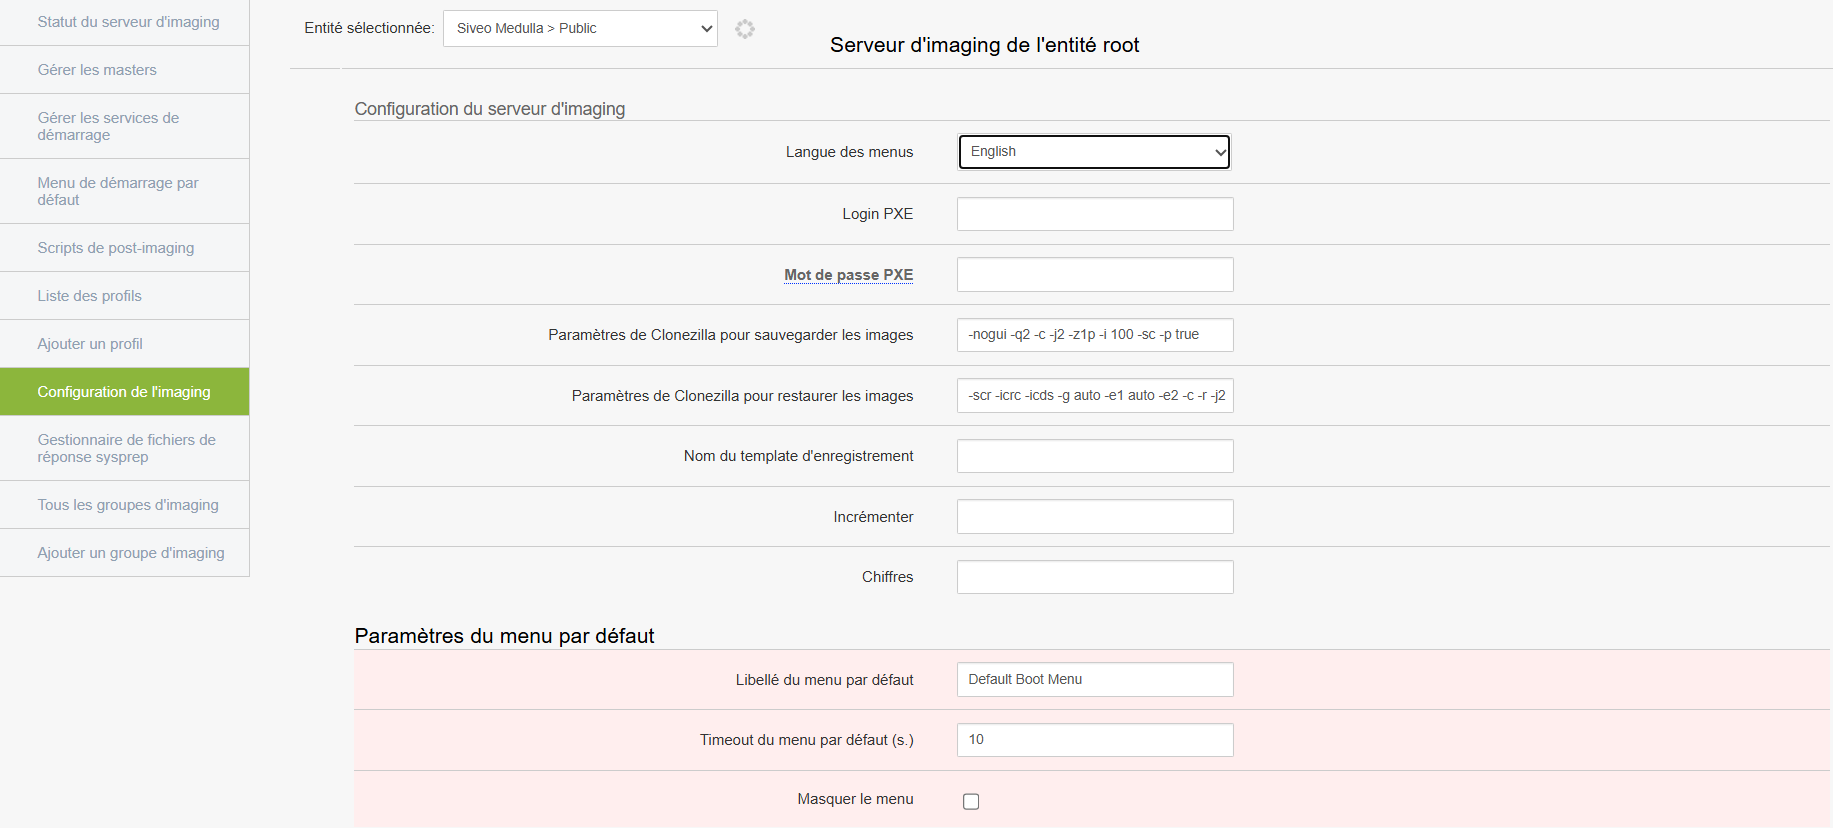
Change the necessary settings
Note: this section can impact the entire environment → to be reserved for experienced administrators.
Sysprep Response File Manager
Manages the response files used during Windows automated installation.
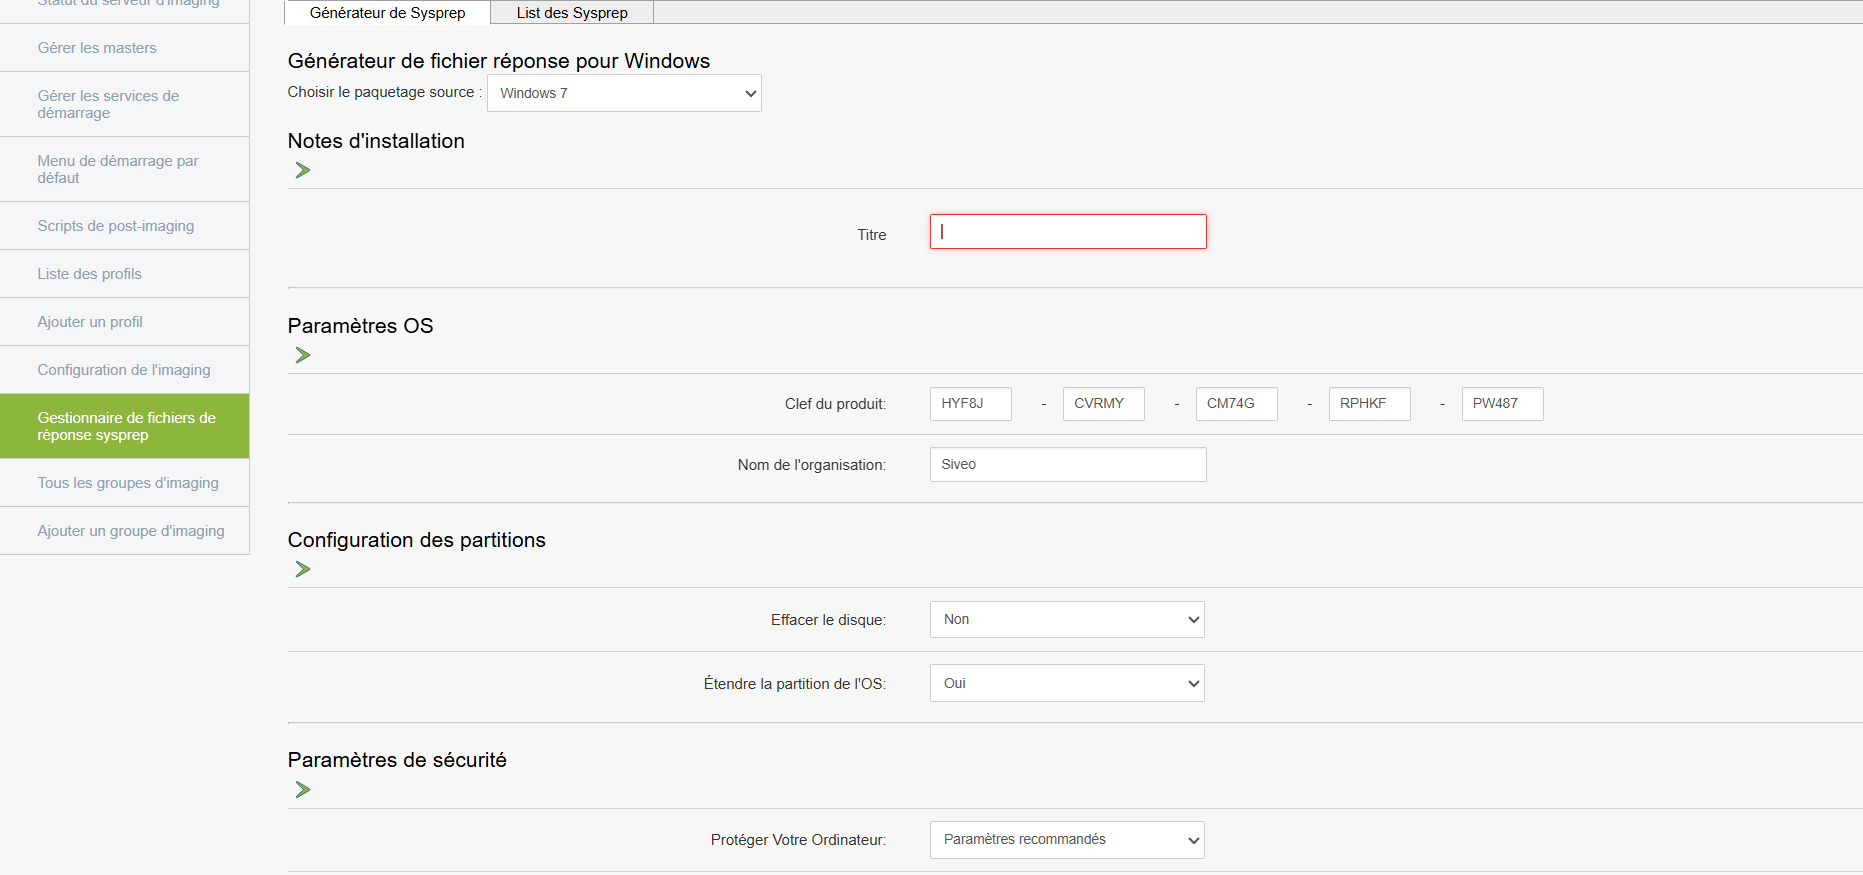
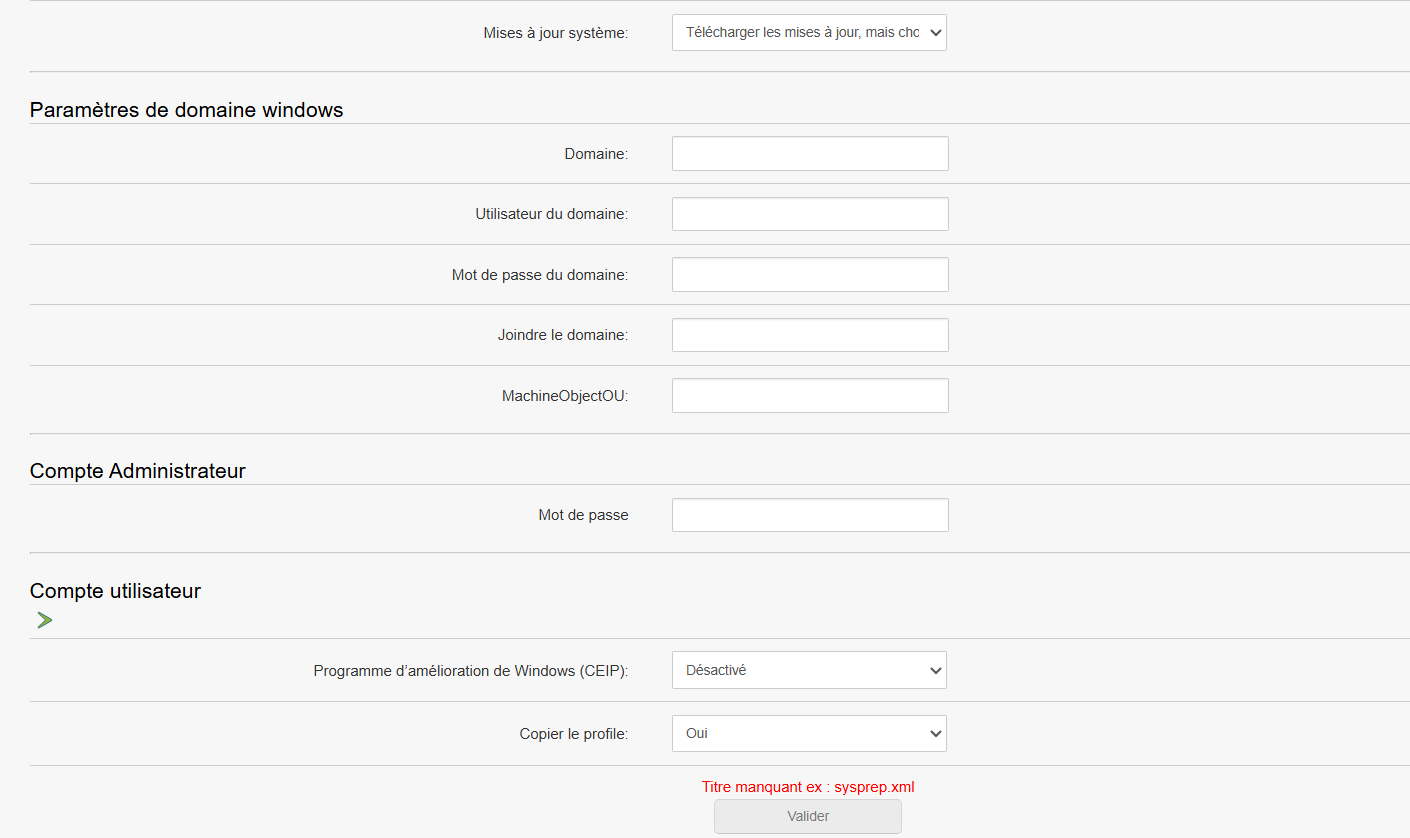
To use it
These files contain silent installation settings (machine name, language, product key, etc.)
Imagination groupsg
Displays all existing imagining groups.
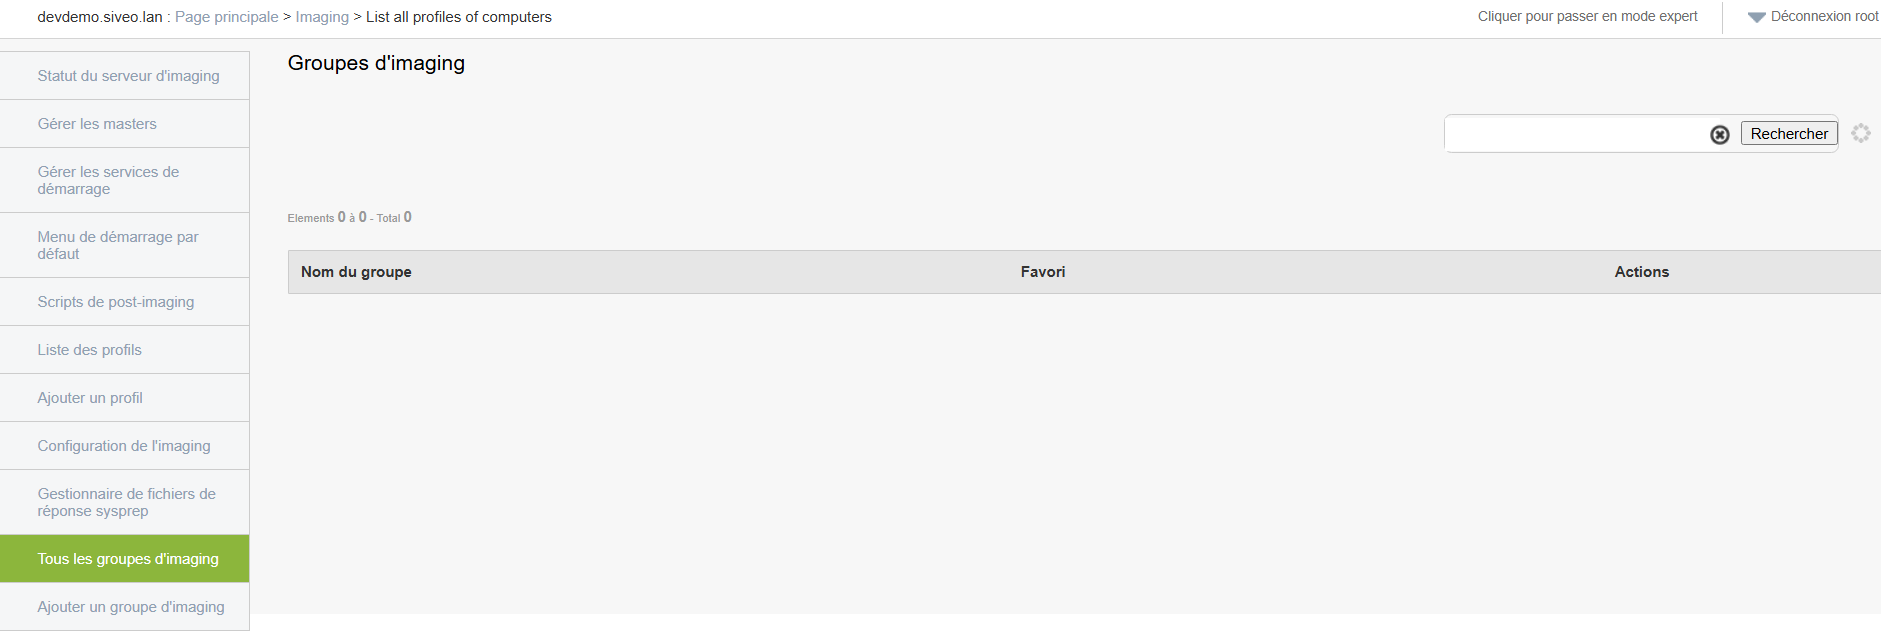
-
Each group contains a specific configuration linked to a type of deployment (e.g. classrooms, specific computer park...)
-
You can view, edit or delete them.
Add a group of imagining
Create an imagining group to organize your deployments.
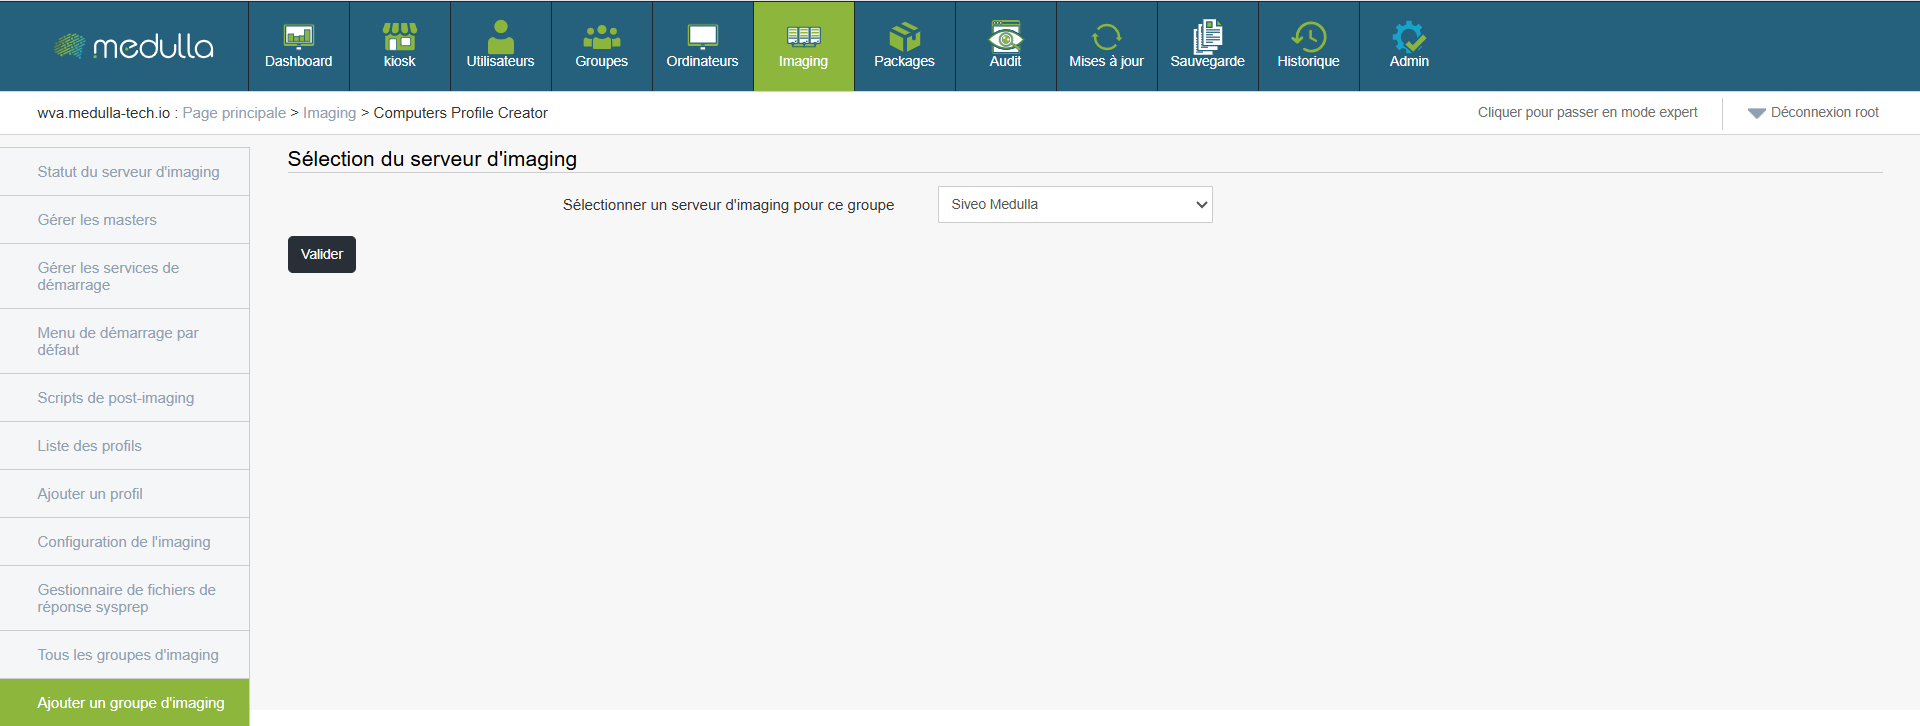
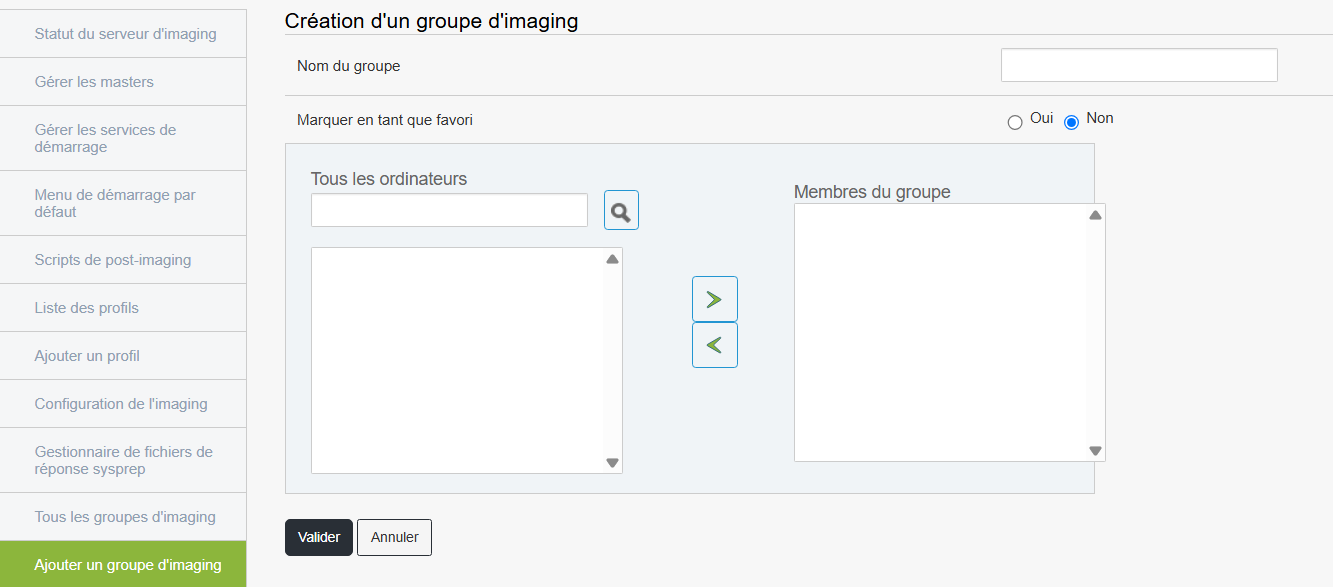
Steps
This group will then appear in the list of available groups.
Chapter 8: Packages
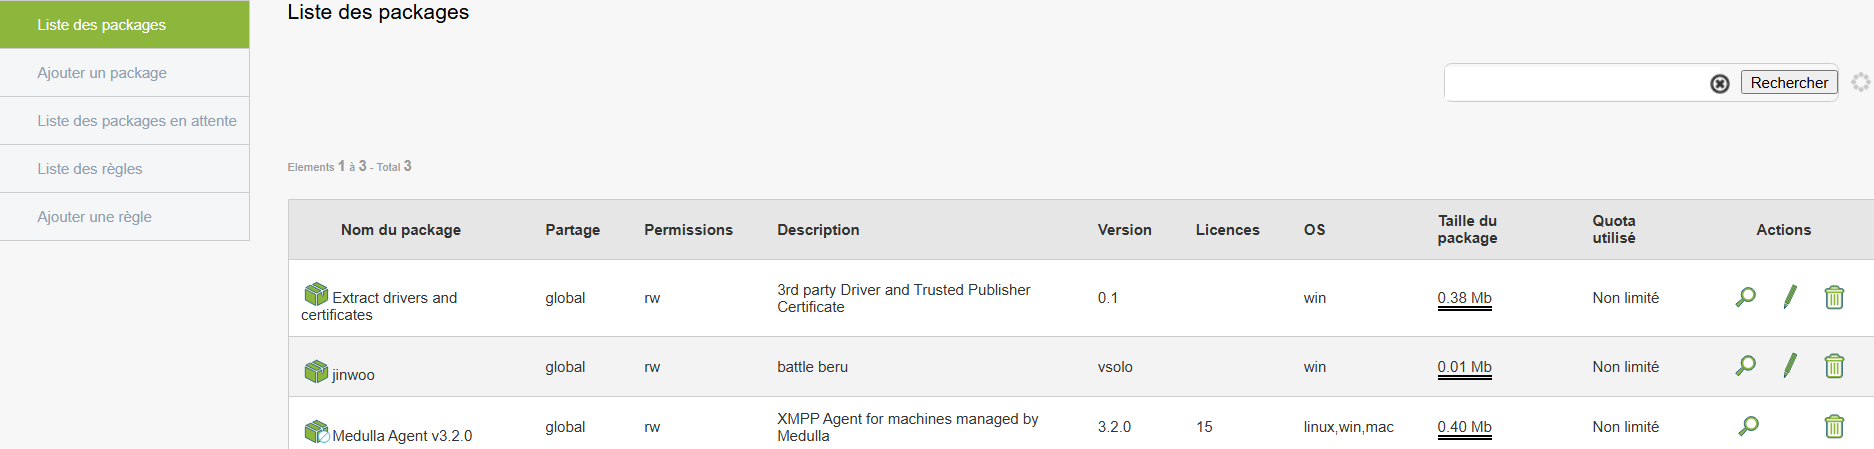
List of packages available
The deployment of packages makes it possible to install, uninstall or perform specific actions on several remote stations in a centralized and automated way. It is a key feature for the management of a computer fleet, offering accurate speed, homogeneity and monitoring.
This section displays all packages ready for deployment.
Access
Viewed Content
Each row of the list presents
- The name the package
- One Description
- The type of action (installation, uninstallation, script)
- The version
- The Associated rights
Available functions
- Search by keyword
- Sort list in alphabetical order, date, or version
This allows rapid and organized consultation of available deployment tools.
Add a new package
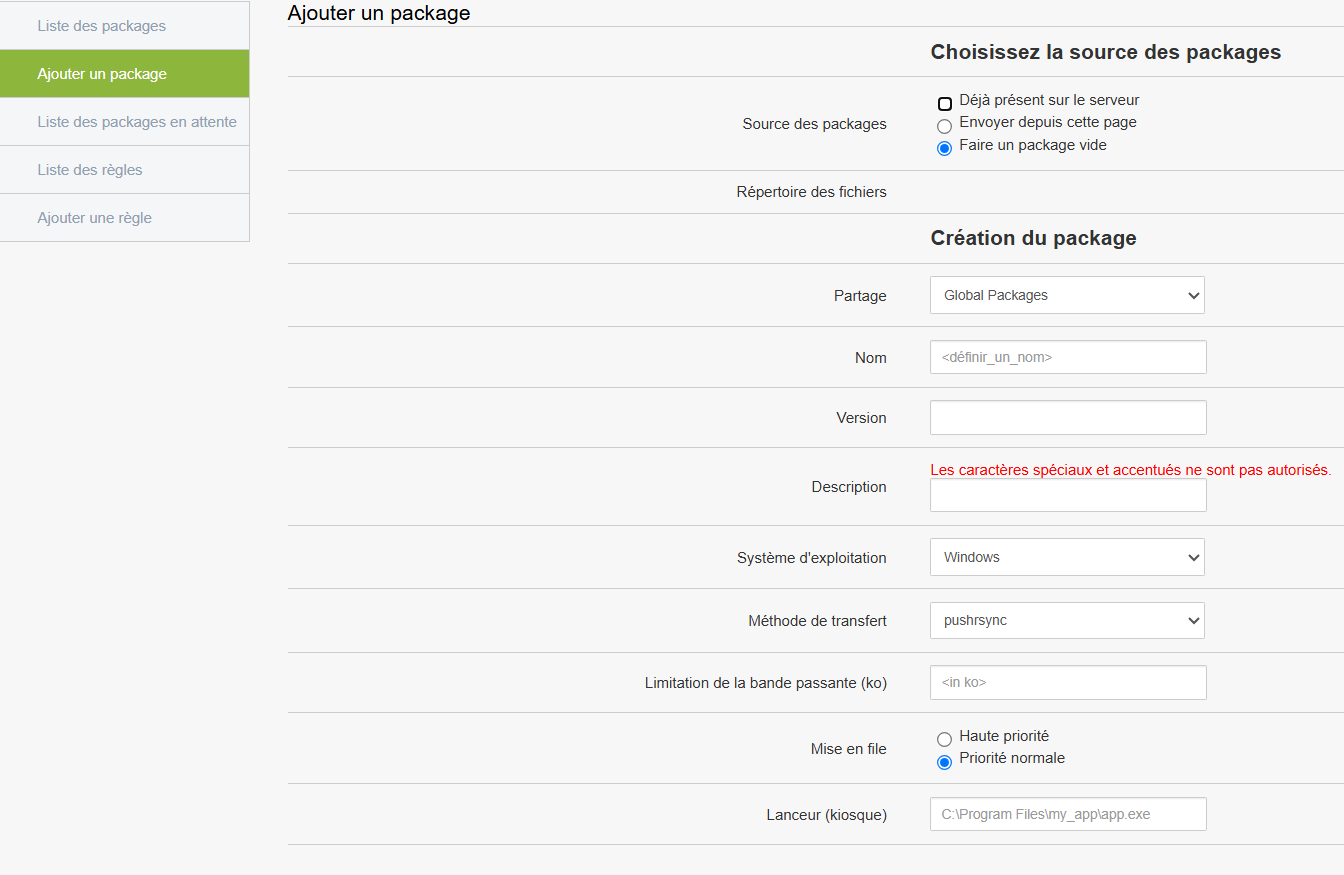
Creating a package consists of setting an action (installation, uninstallation, script...) that will be deployed on one or more posts. The creation form allows you to precisely configure the behavior of the package and its execution options.
Then select the original files to use in the package. Four options are available:
Already on the server
Use files previously transferred to the server.Send from this page
Import installation files directly from your desktop.Make an empty package
Creates a package without initial content, to be completed later.File directory
Use a shared directory containing the files to deploy.
General information to be provided
Sharing
ChooseGlobal Packages to make the package visible throughout the platform.
Name
Give an explicit name to the sample package: Install_Chrome
Special and accented characters are not allowed.
Version
Indicate an example version number:1.0.0.
Description
Briefly summarize the objective of the package.
Operating system
Select the target OS, for example:Windows.
Define the technical modalities of deployment
Method of transfer
Generally use pushrsync (recommended).
Bandwidth limitation
Optional value to limit the speed of the transfer ex 500
Choose betweenHigh priority or Normal priority, depending on the urgency of deployment.
Launcher
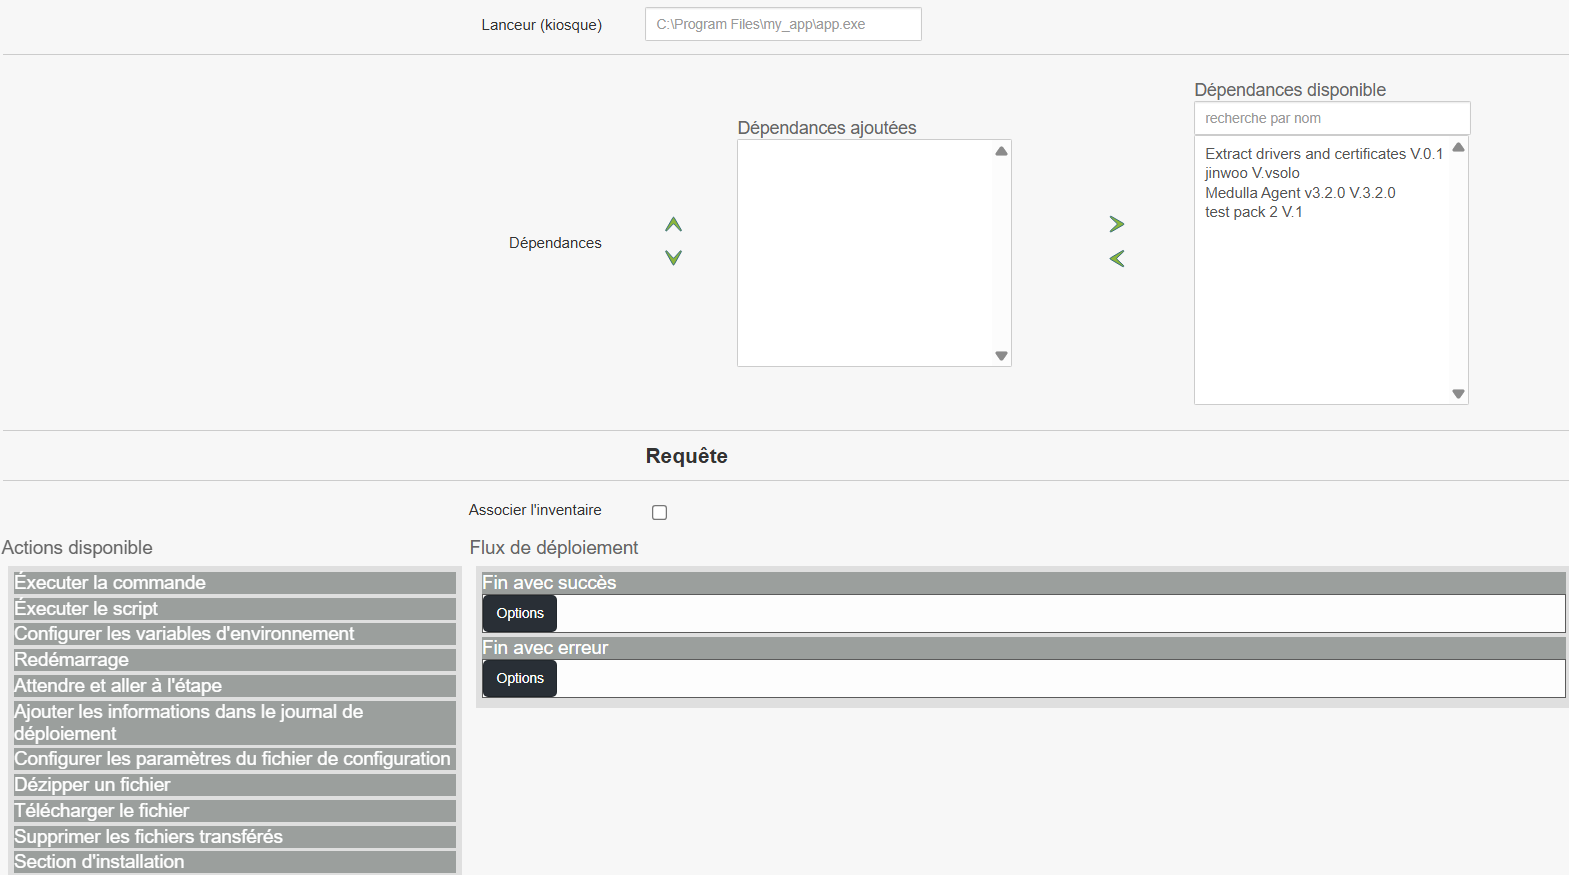
Specify the path to the executable file that must be started after installation (e.g.:C:\Program Files\my_app\app.exe).
If your application requires other components to work
Find and add the necessary dependencies via the available list (examples:Extract drivers, Medulla Agent).
Added dependencies will appear in the corresponding section.
Associate with inventory
Enable this option to allow the package to be tracked after installation.
You can add custom actions to the package, depending on your needs:
Run a command or script
Configure environment variables
Restart post after installation
Wait and move on to the next step
Add information to deployment log
Edit or configure a parameter file
Uncompress, download or delete files
The package may consist of several stages depending on its life cycle
Installation Section : for the first installation
Update Section : when switching to a new version
Disinstallation Section : to delete the program
To interact with the end user
Notification booth : Display information in user space
User notification : Message displayed on the screen
Question to the user : Conditional interaction (e.g. timing)
Deferral options : Allows to delay installation
Define package behavior at the end of the process
Successful end
The step can be namedEND_SUCCESS. Allows to trigger a final action.End with error
The step can be namedEND_ERROR. To manage errors or failures in deployment.
Inventory
Option available if a change in the position is detected following deployment.Remove Package
Enable this option if the package should be deleted after execution (rarely used in standard deployments).
Once all sections are configured and verified
Click Add to save the package.
It will then be accessible from the library to be used in a deployment rule or triggered manually.
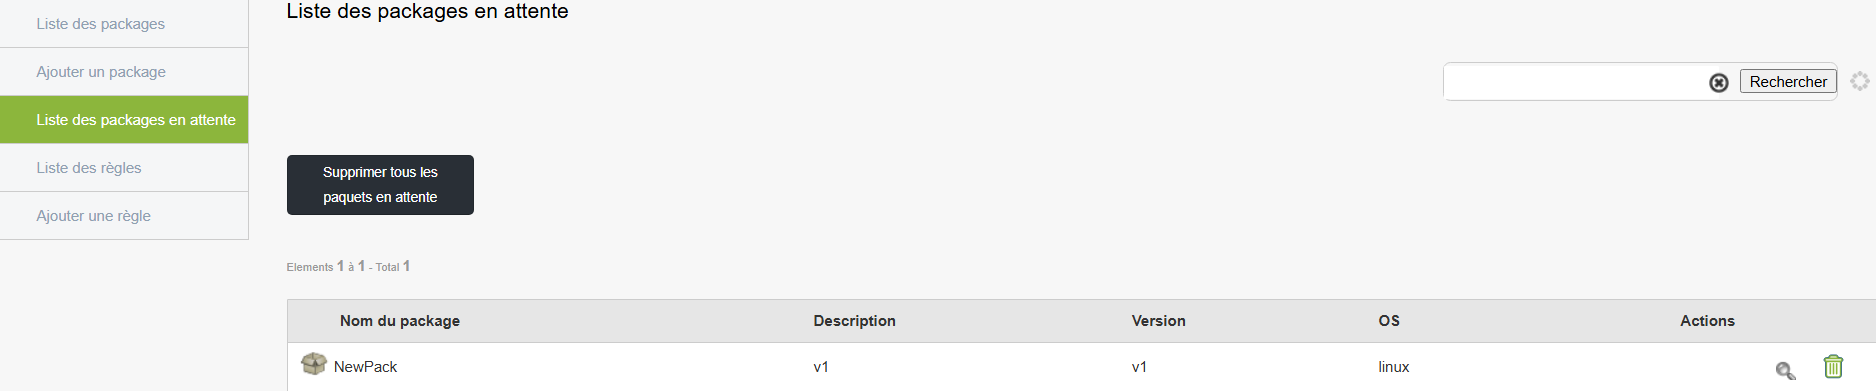
Packages pending deployment
This section allows you to view packages that have been created or added but have not yet been sent to the target posts. It is mainly used to organize, verify or delete pending actions before they are executed.
Access:
Section content:
Once in this page, a list of all queued packages is displayed with the following information for each entry:
Name of package
Description
Version
Target operating system
Available actions (to the right of each line)
Possible actions:
Show state of mirrors : allows checking the available mirror servers for distribution of the package.
Remove pending packages : button to remove a specific package from the list.
Delete all pending packages : General button at the top of the page to empty the entire queue if necessary.
Find a package : search field to filter the list by name or version.
Note: This page does not allow directly to launch a deployment, but it helps you control the items still in queue. Deployment is usually done from another dedicated section or via an action triggered through a scenario or rule.
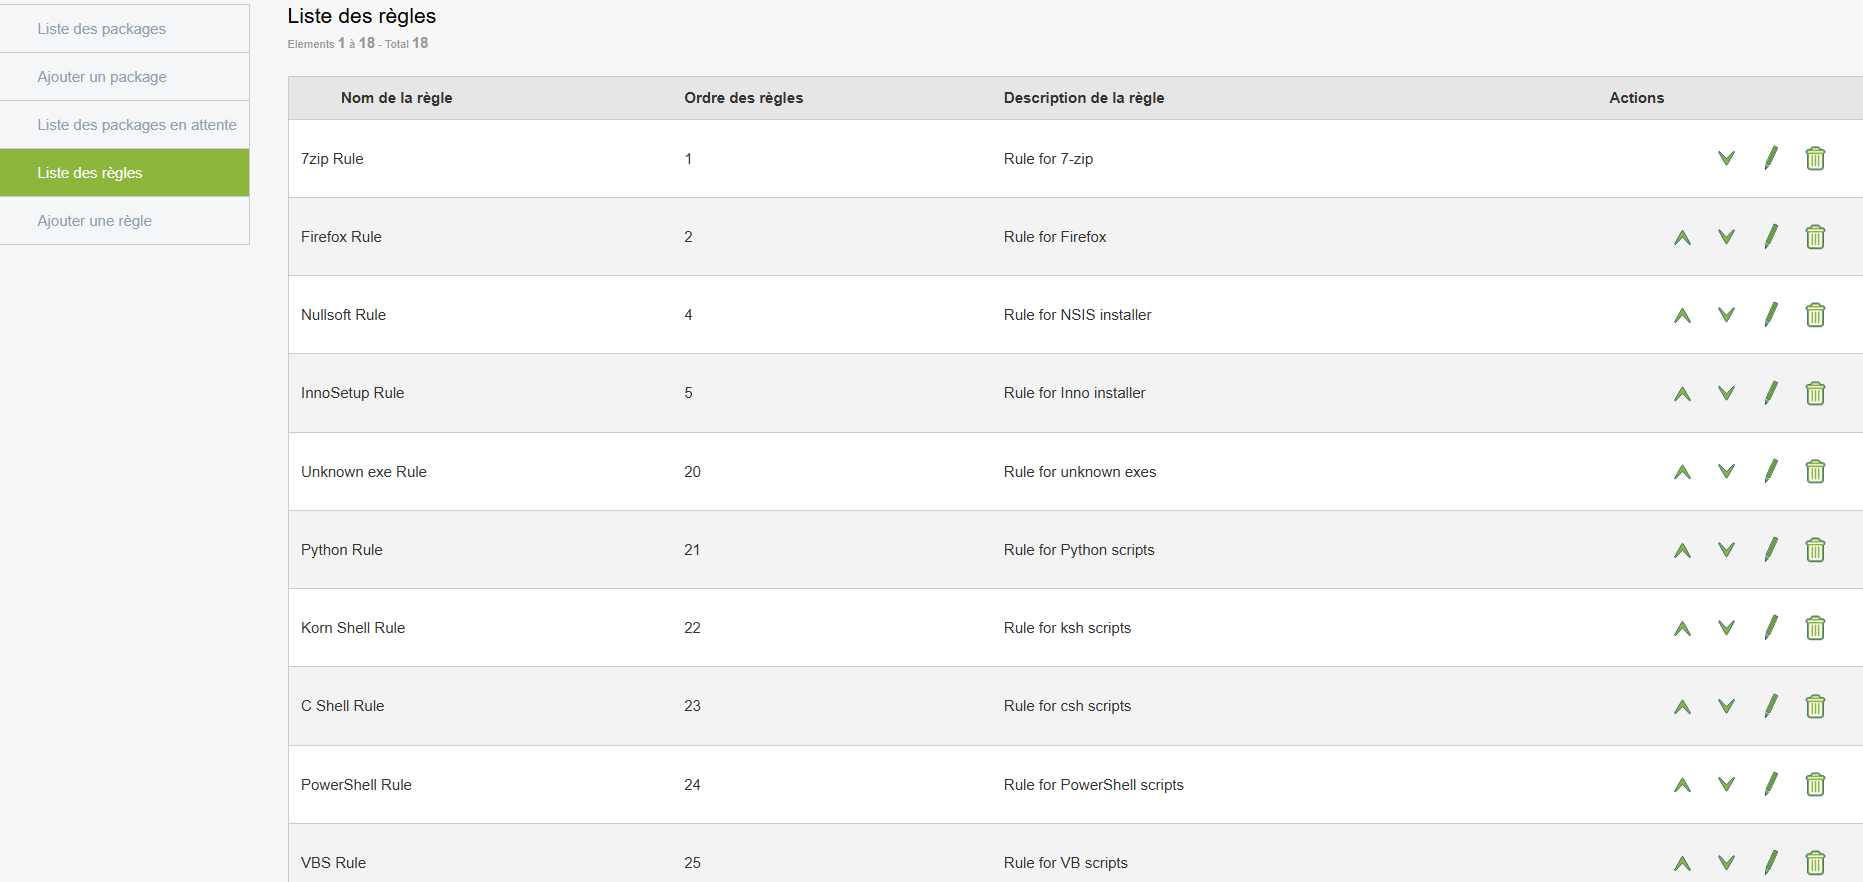
List of deployment rules
Deployment rules allow for planning or limiting deployment according to specific criteria (time range, type of machine, group of users...).
Access:
Available information:
- List of existing rules with their conditions
- Examples of criteria:
- Name
- Order
- Descriptions
- Actions:
- Increase or decrease the priority of the rule
- Edit Rule
- Delete Rule
Add Custom Rule
Creating a rule allows you to define precisely when and on which machines a package will be deployed.
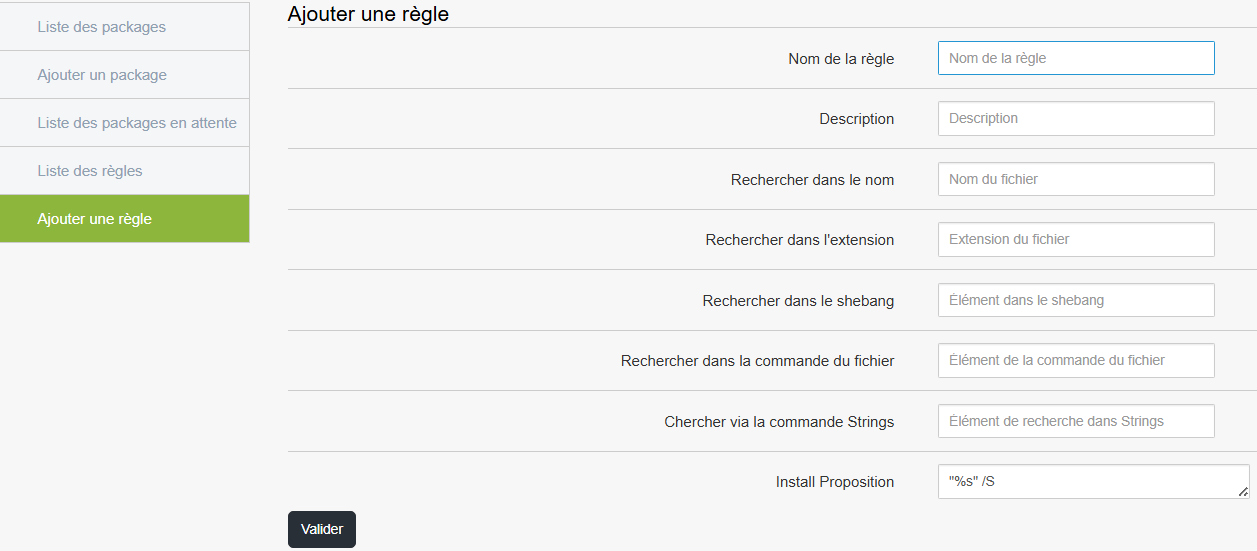
Steps:
The rule is now activated and automatically applied when its conditions are met.
Launch and track deployment
When your packages and rules are ready, you can launch deployment on the targeted machines.
Steps:
Real-time tracking:
- Progress is visible from the interface
- The machines go back to their condition: Ongoing, Successful, Failed
In case of failure:
- Go to the section Monitoring of actions
- See the detailed error report (examples: machine turned off, rights error)
- Correct if necessary, then restart the action without having to start over
Conclusion
With this feature, you can centralize and automate all your software installations and system actions across your fleet. You save time, ensure consistency of positions, and have accurate control over each deployment.
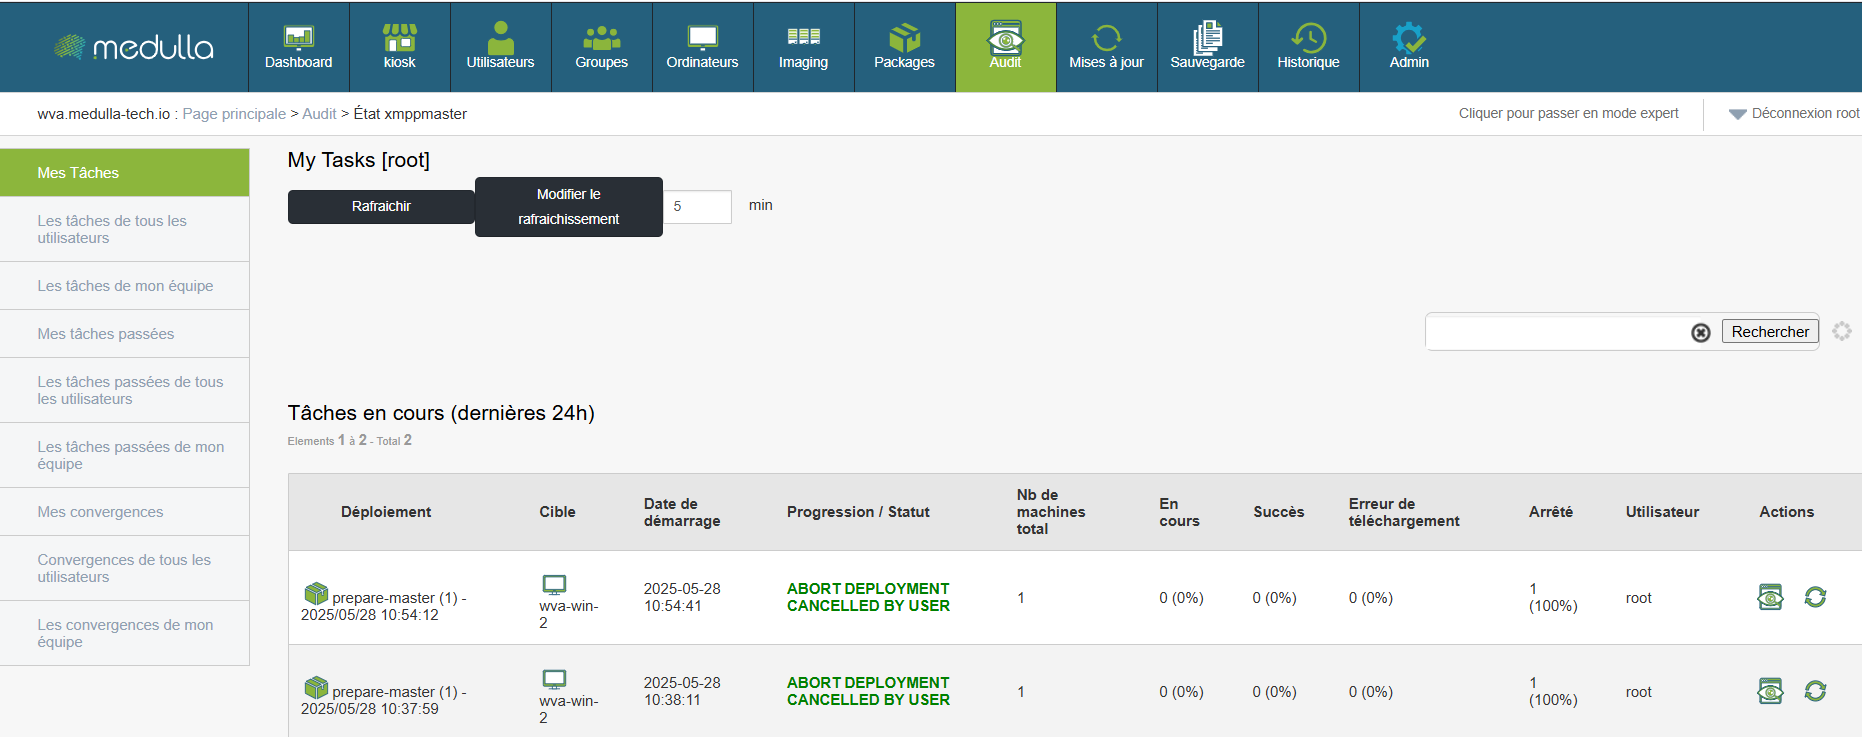
Section 9: Audit
Own and collective tasks
The ability to monitor and understand each action is crucial. The management system offers several views to explore in detail past operations, monitor ongoing tasks, identify errors, and collaborate effectively among teams.
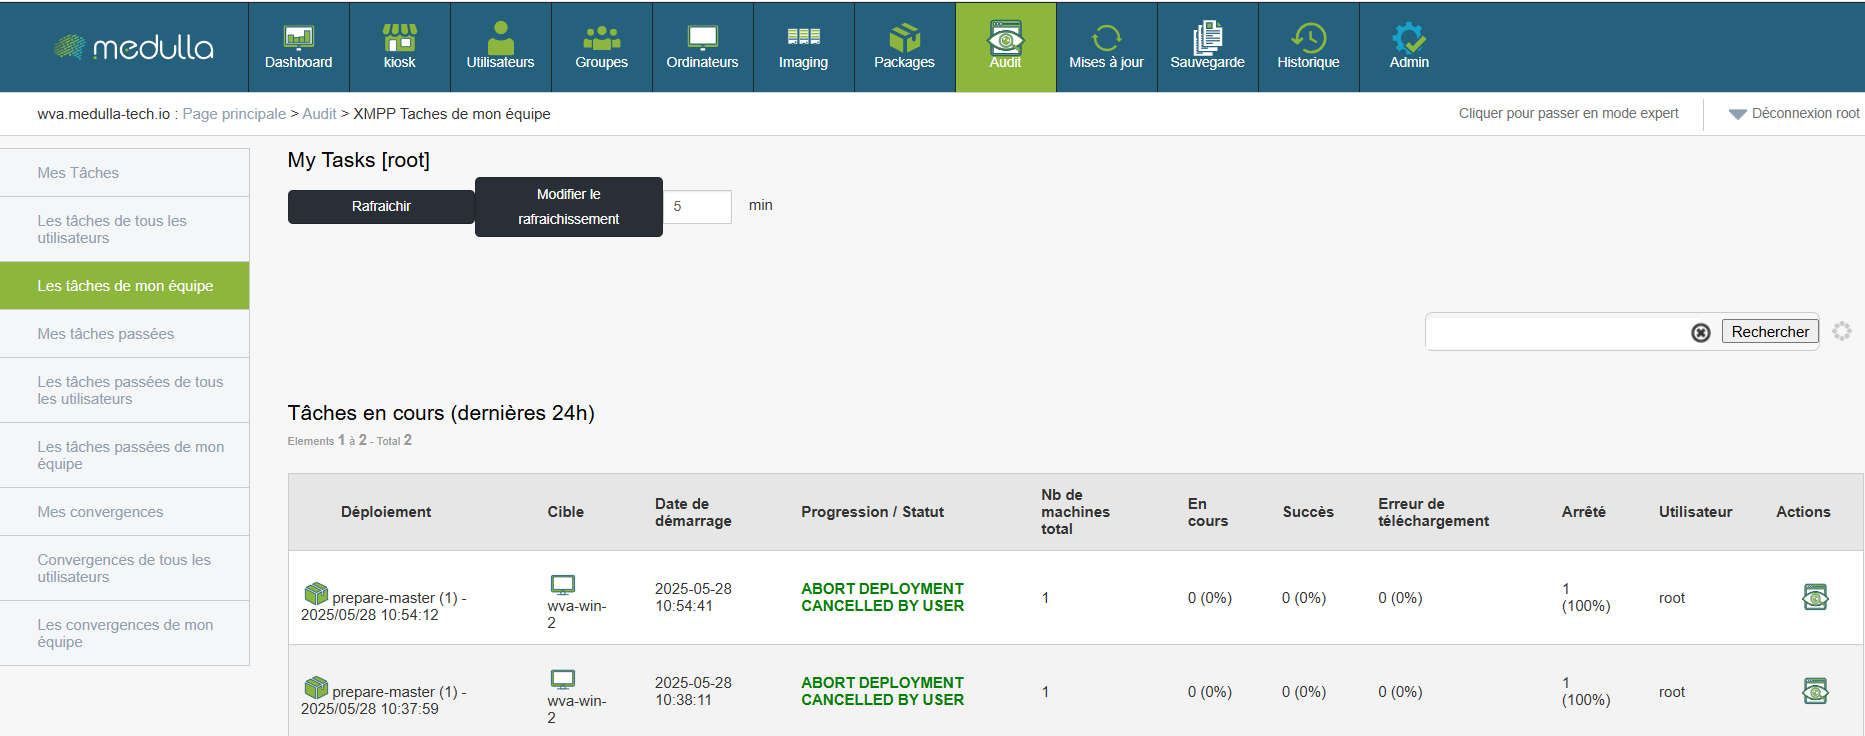
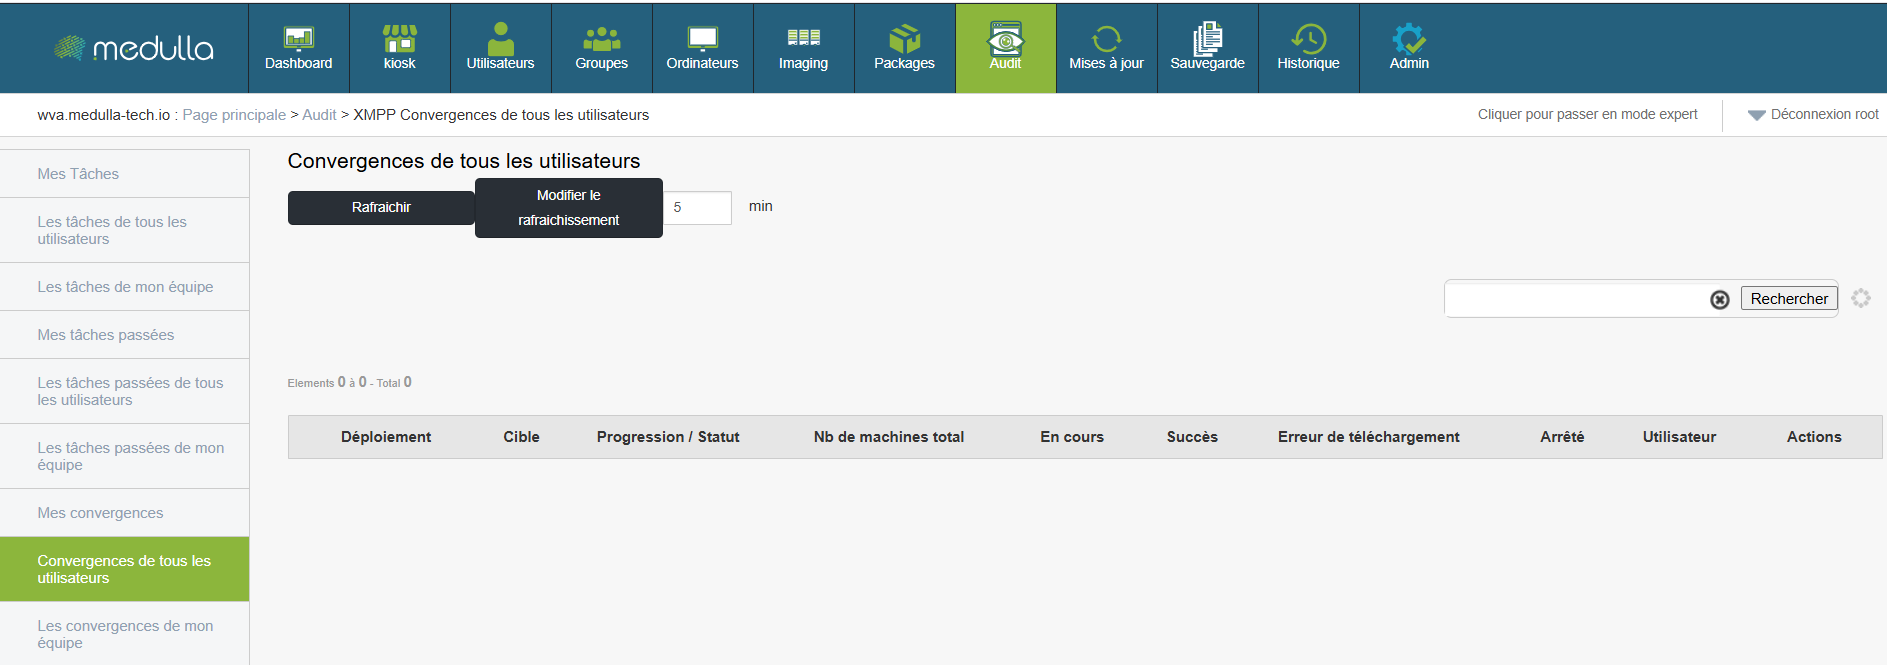
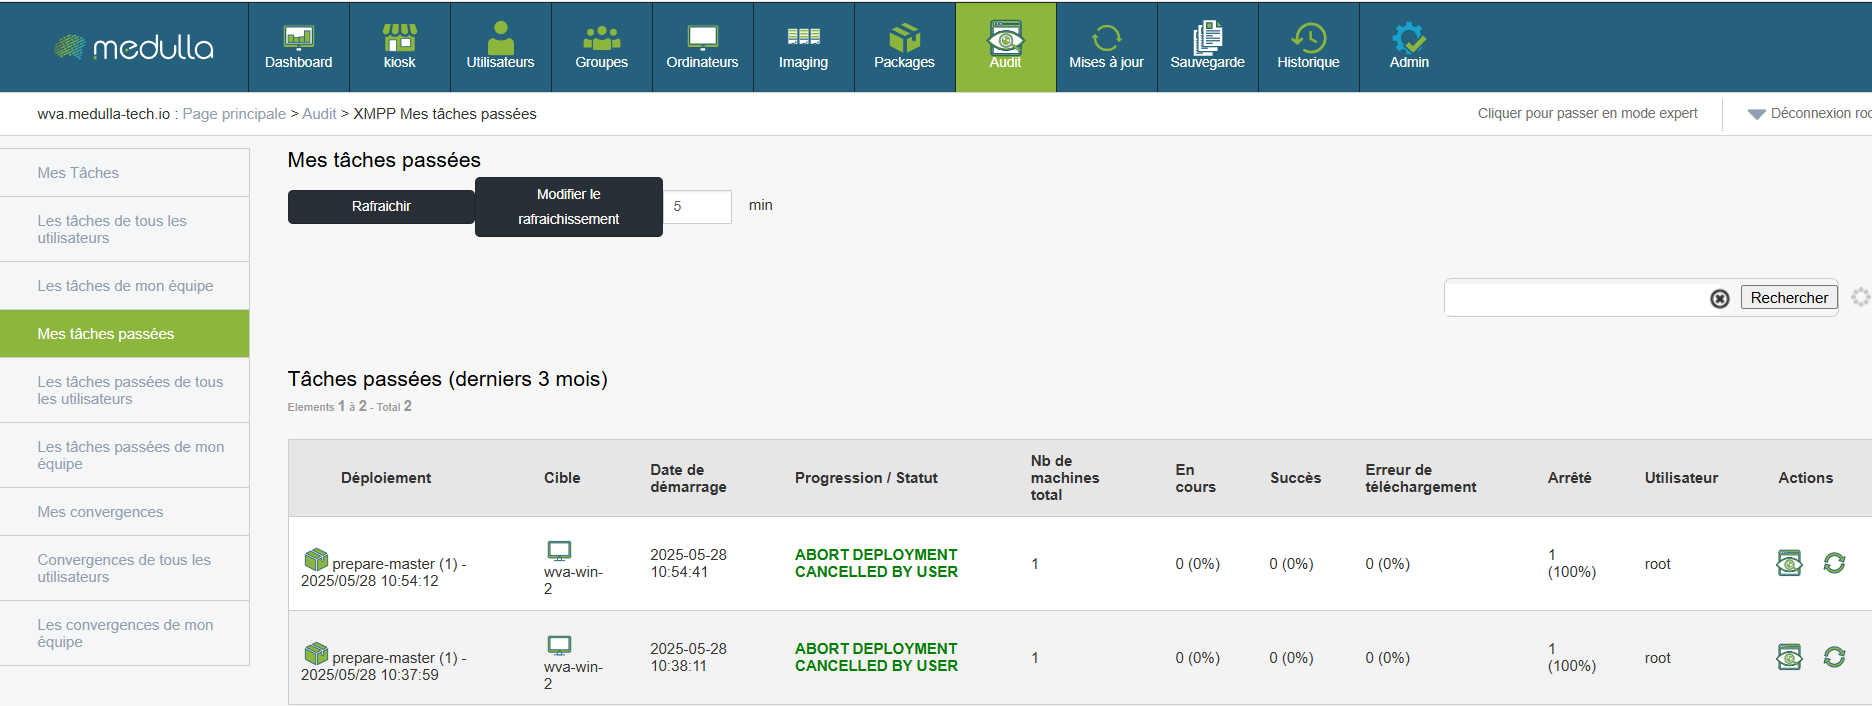
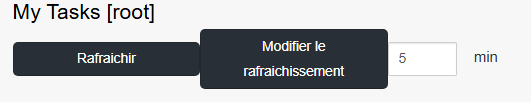
Section My Tasks allows you to visualize all the actions you have initiated, whether they are ongoing or completed.
Access:
Proposed View:
-
Ongoing tasks : displays current deployments over the last 24 hours.
-
Planned tasks : list the actions planned at a later date.
-
My Past Tasks : traces all your previous actions, with their results.
Available information:
For each task:
-
Type of deployment
-
Target (machine or group)
-
Start date
-
Progress status (success, failure, download error, shutdown)
-
User who initiated the action
Filters allow you to search for a task by name or user.
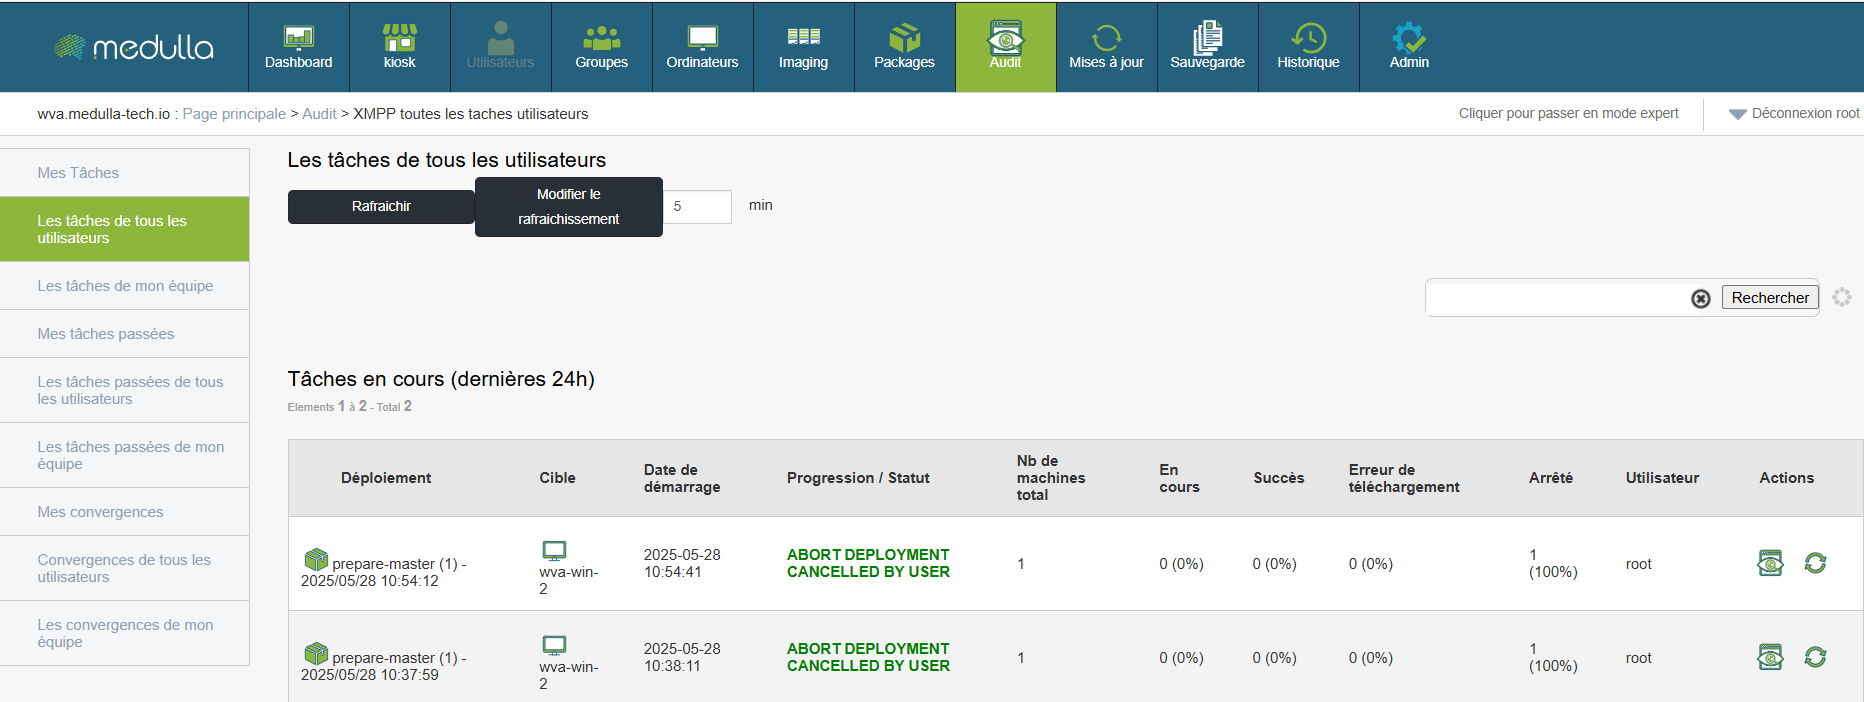
Task monitoring is not limited to your personal activity. Thanks to collective views, you can monitor your colleagues' operations, understand convergences, and avoid duplication.
Access:
Available sections:
-
Past tasks of my team : global history of the actions launched by your team.
-
Past tasks of all users : comprehensive view of all recorded transactions.
-
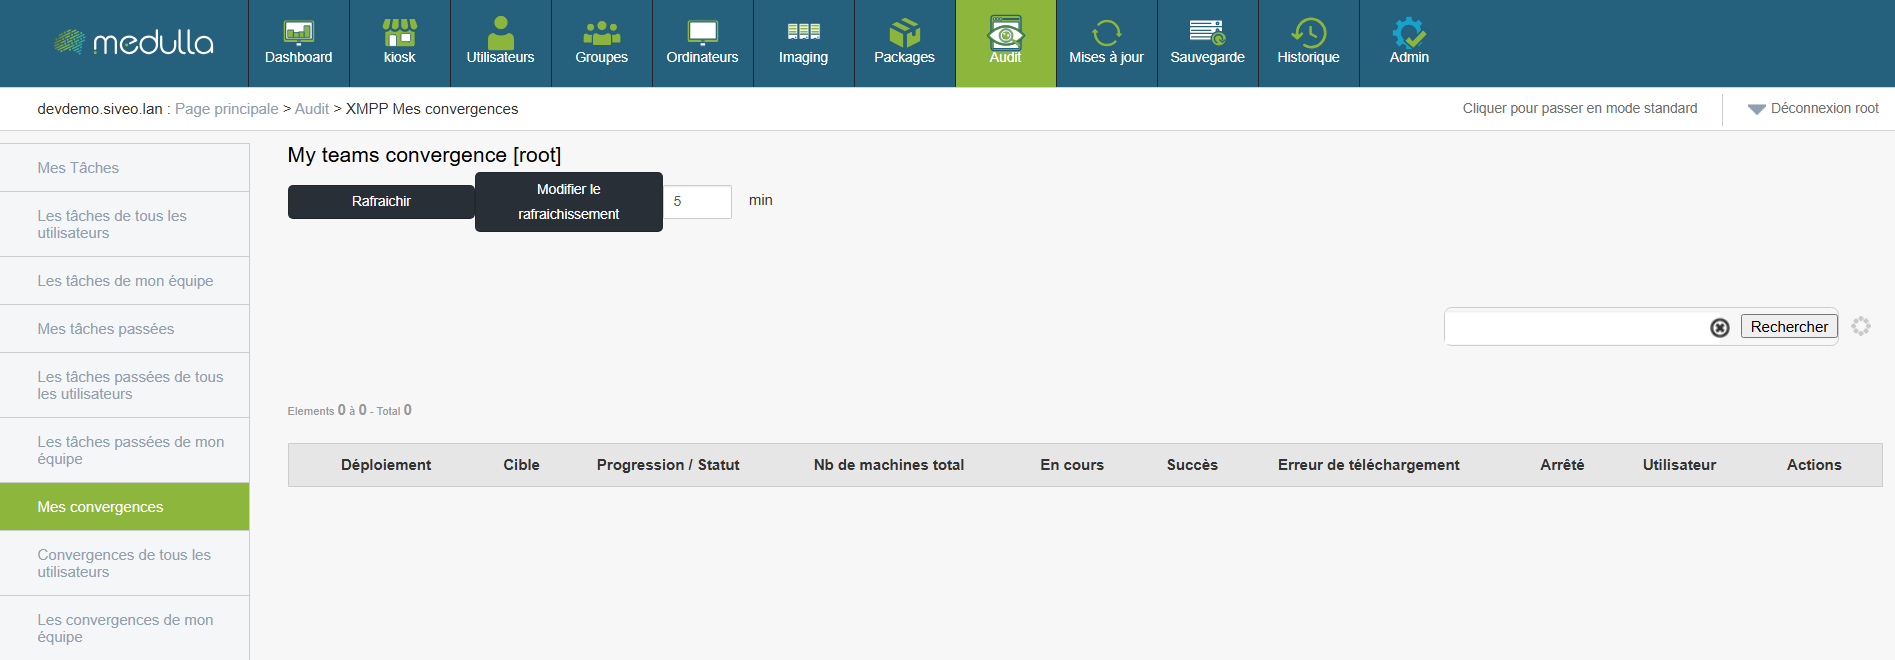
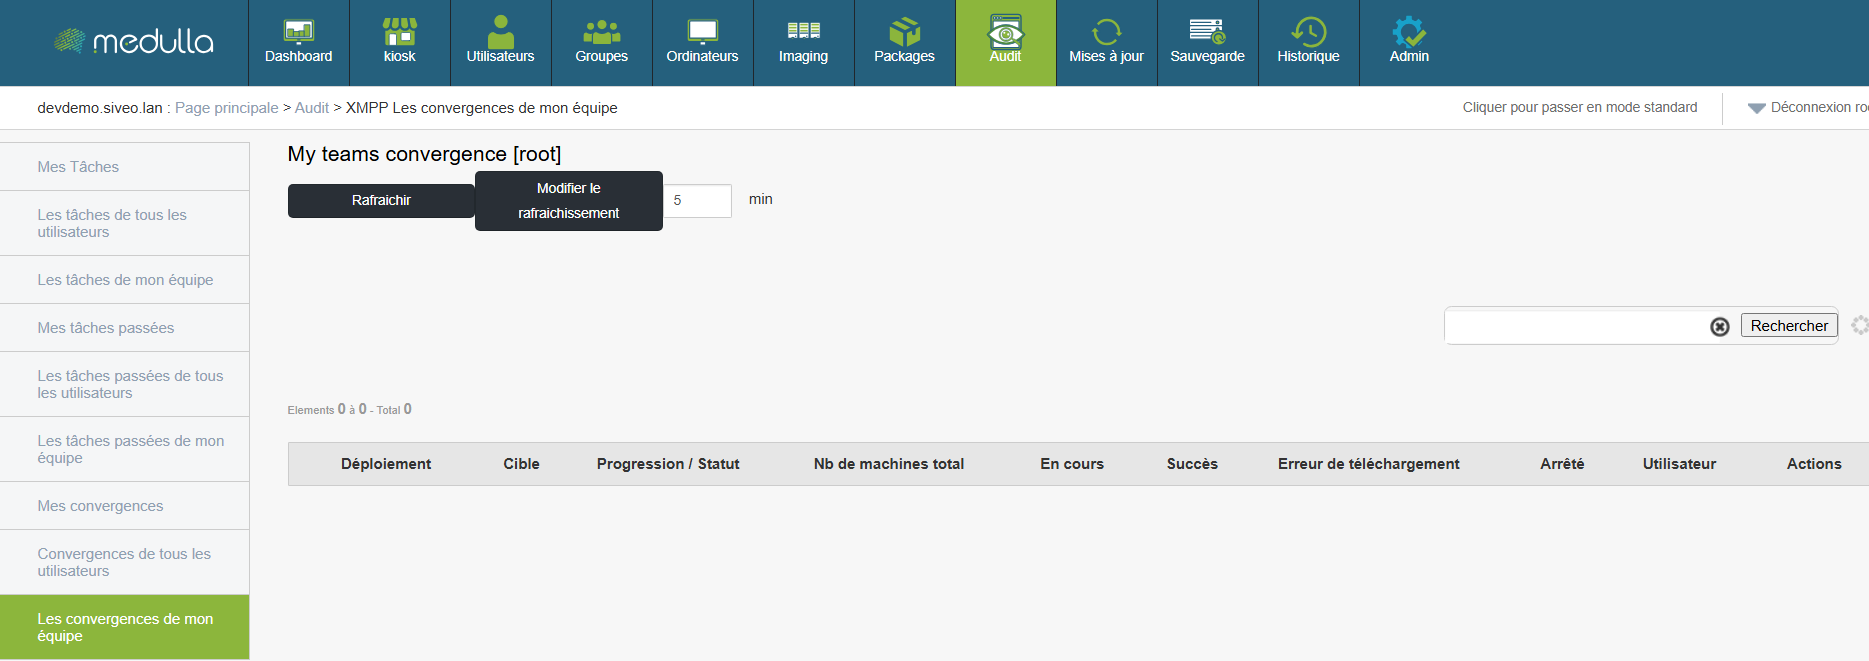
Convergences :
-
My convergences : tasks affecting several machines or groups at the time you initiated.
-
Convergences of my team or of All Users : collective visualisation of major operations.
-
This information allows you to cross-check intervention data, identify recurring or critical operations, and act coherently within your department.
Analysis of tasks
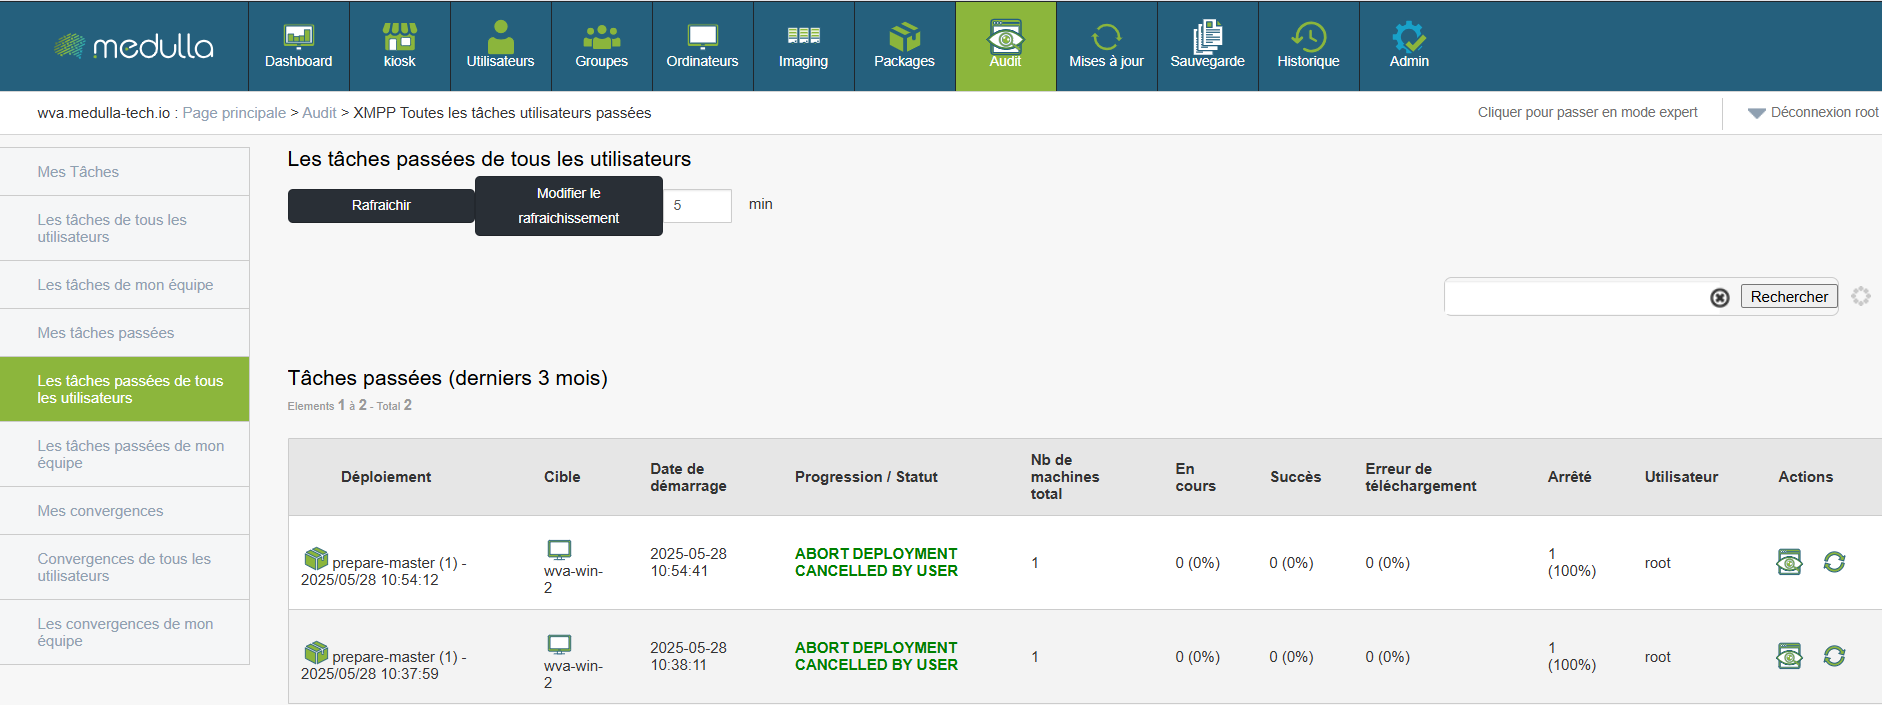
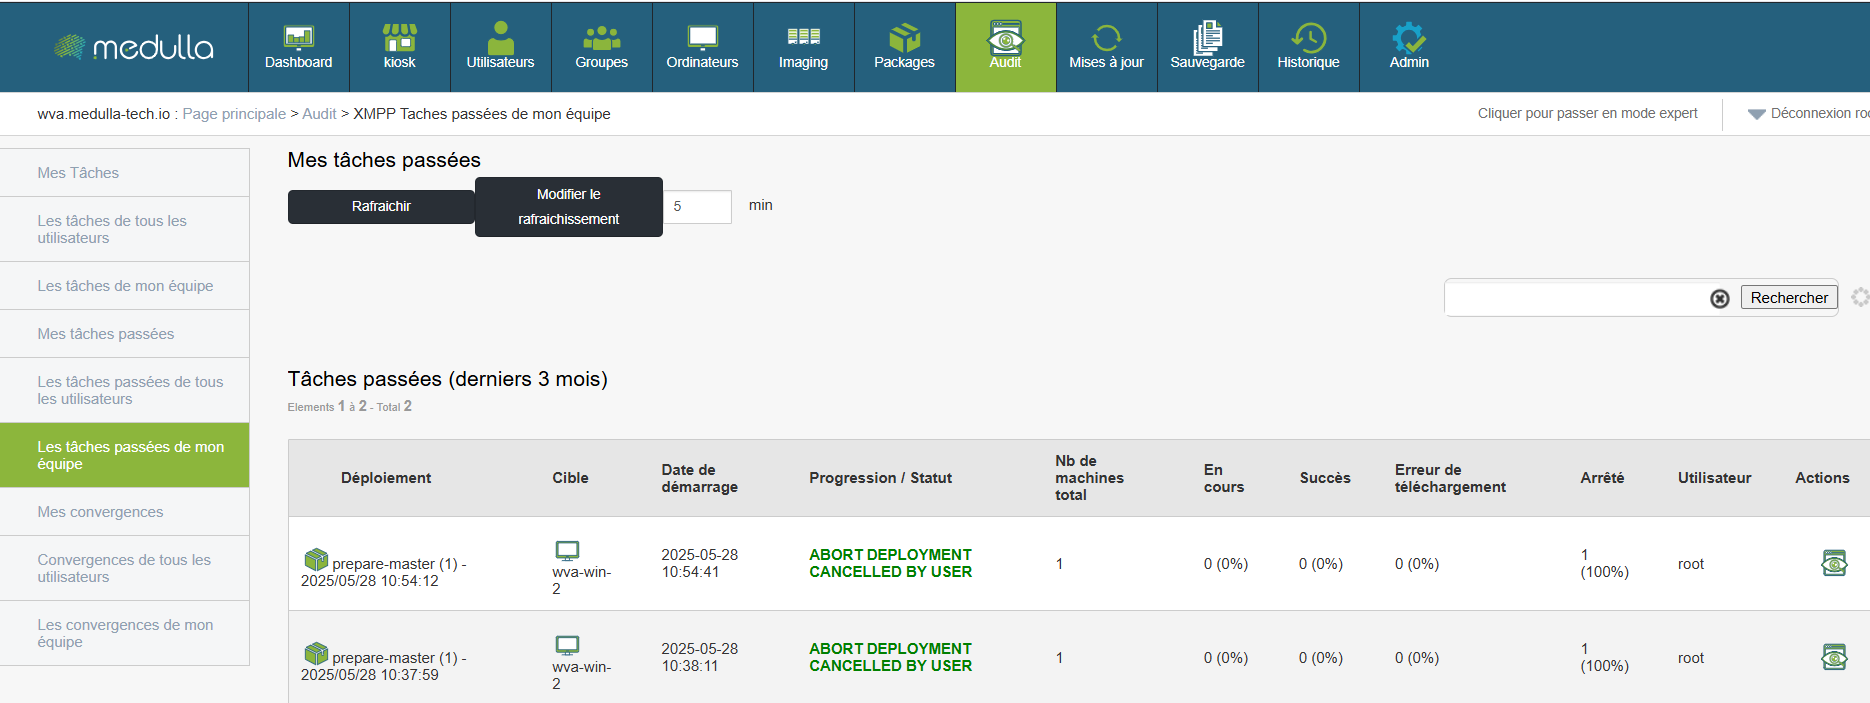
For each task listed, it is possible to access a full detail including:
-
The total number of machines concerned
-
The rate of progression (success, errors, stopped transfers)
-
Errors in downloading or permissions
-
The associated execution log
These data are essential for:
-
Diagnosis of incidents
-
Justify intervention
-
Verify deployment compliance
-
Documenting processes in an audit framework
One button Refresh (with configurable interval, default 5 minutes) allows you to maintain a constantly updated view.
This facilitates Active piloting, by allowing you to:
-
Respond quickly in case of failure or blocking
-
Identify abnormally long tasks
-
Follow accurate planning in real time
The audit and task management interface is a real retrospective and collaborative dashboard. It allows you to understand what was done, by whom, on which machine, and with what results. This traceability is essential to enhance security, improve internal procedures, and ensure reliable and controlled administration of your IT environment.
Chapter 10: Updates
Compliance of entities
The management of updates is an essential lever to ensure the security, stability and homogeneity of your IT environment. With the tools offered by the platform, you can precisely identify the entities to be updated, monitor overall compliance, and intervene in a targeted, progressive and optimized way.
Section Compliance of entities offers a clear synthesis of the update status of each set of machines. It allows you to immediately identify entities at risk or requiring action.


Access:
Table presented:
-
Name of entity : Ex. Siveo Medulla, Siveo Medulla > Private
-
Compliance rate : percentage of machines up to date
-
Missing updates : total number of patches not installed
-
Machinery not conforming Number of non-standard posts
-
Total computers : number of machines in the entity
Example:
Available actions:
-
See details : access the complete list of missing updates, with the posts concerned and the history of attempts to deploy
-
Search / Filter : by entity name, compliance or volume of missing updates
This view is ideal for planning updates campaigns, preparing audits or measuring the effectiveness of your security policy.
Manage Update Lists
The interface allows you to precisely manage the updated lists applicable to each entity or machine.
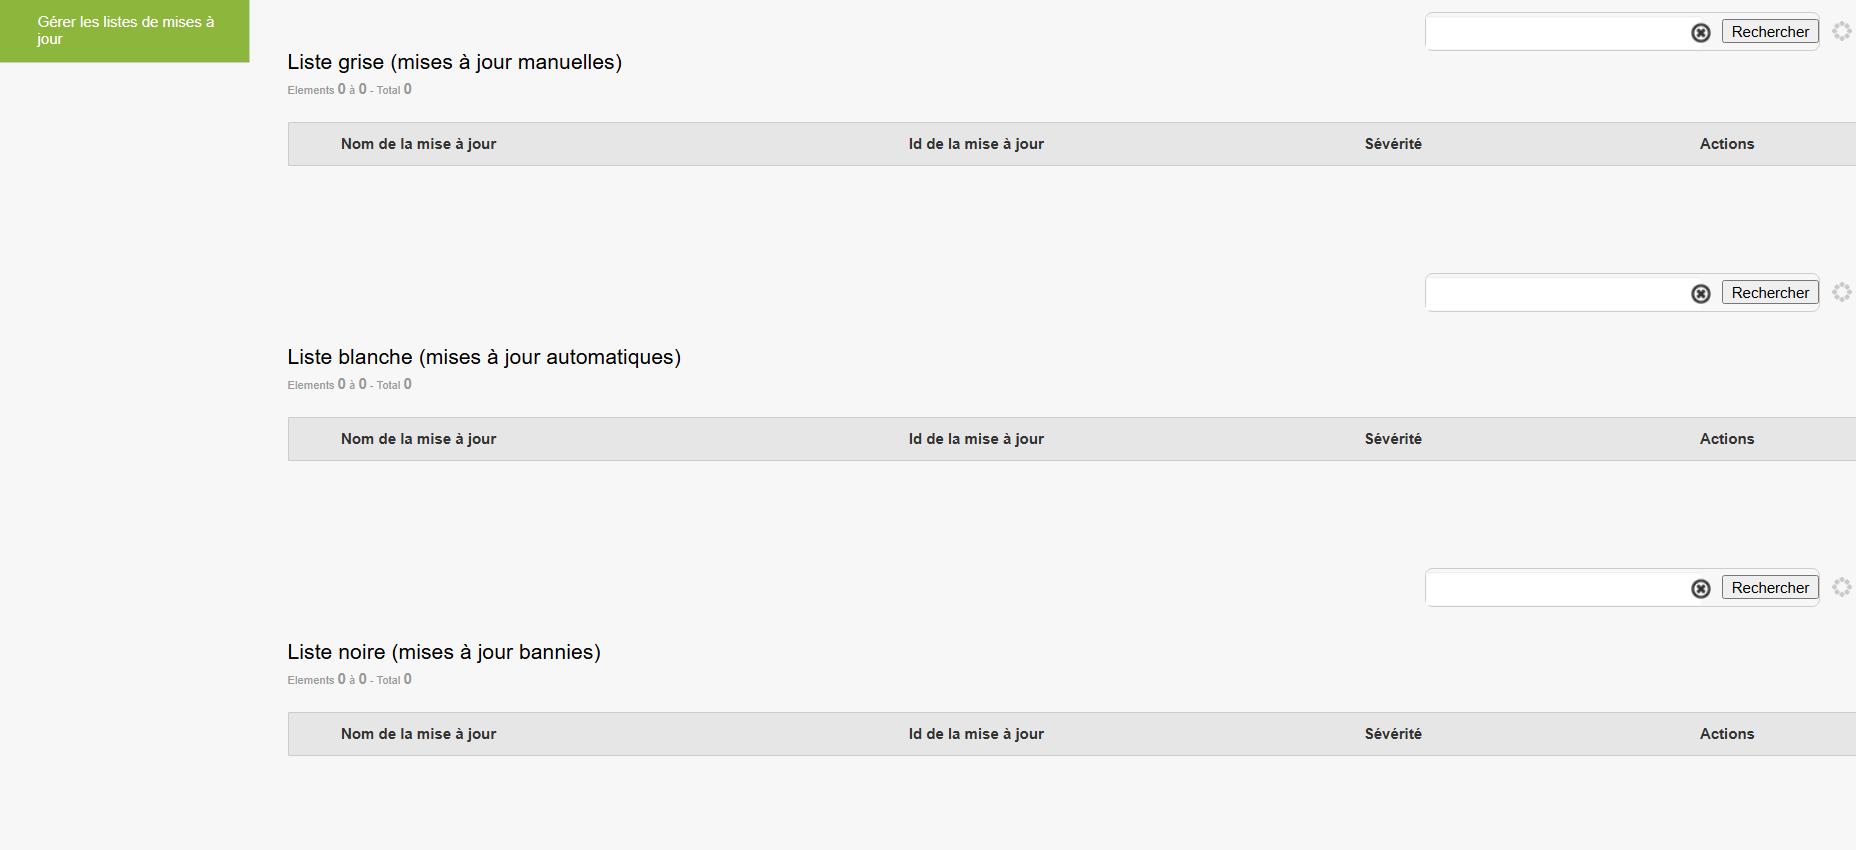
Features available:
View missing updates
Apply filters (by type of patch, severity, date of publication)
Deploy or exclude certain updates
Plan installations at a specified time
With this level of customization, you keep your hands on the exact content of deployments, avoid inappropriate interruptions, and prioritize critical updates.
Compliance monitoring
Compliance with updates is a health indicator of your park. The higher it is, the more protected and aligned your systems are.
Good practices:
Regularly check entities with a compliance rate below 100%
Analyze the causes of non-compliant machines (deployment error, missing restart, software conflicts...)
Launch a new targeted deployment from the entity concerned
Managing updates is not simply about correcting. It is a proactive, continuous and strategic approach. With the compliance tools offered by the platform, you can:
Quickly view entities at risk
Smartly deploy the necessary patches
Reducing the impact on the network and users
Maintain a high level of security across your infrastructure
Chapter 11: Safeguarding
Enable backup
A good safeguard policy is the key to a resilient infrastructure. Hardware failure, human error or attack: With a well configured backup solution, you make sure you can quickly restore data and maintain activity without interruption.
The activation of a backup can be done by post or through shared profiles. This allows you to define precisely what needs to be protected.

Access:
Steps:
-
Select Profile or post concerned.
-
Click Configure backup.
-
Set the scope of the backup:
-
Specific files/folders
-
Full job backup
-
-
Choose the frequency (daily, weekly or personalized).
-
Click Enable backup.
Once the backup is active, it automatically runs according to the set schedule, without interrupting the user.
Track backups
Tracking real-time backups allows you to check that all tasks have been properly executed.
Access:
In case of error:
-
See detailed logs.
-
Identify the cause (network connection, insufficient disk space...).
-
Set up alerts to anticipate problems.
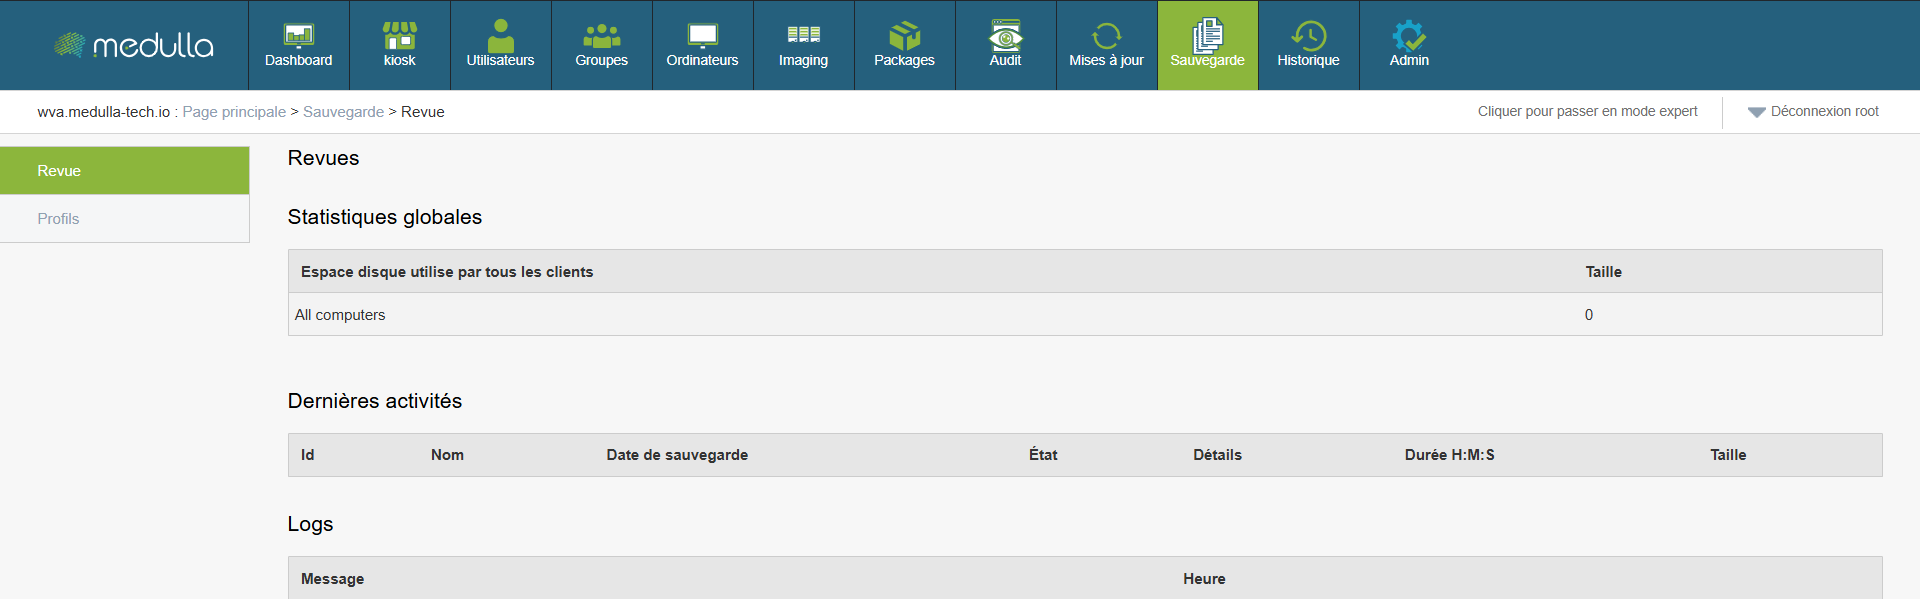
Overall statistics
You have key indicators to evaluate the general status of your backups.
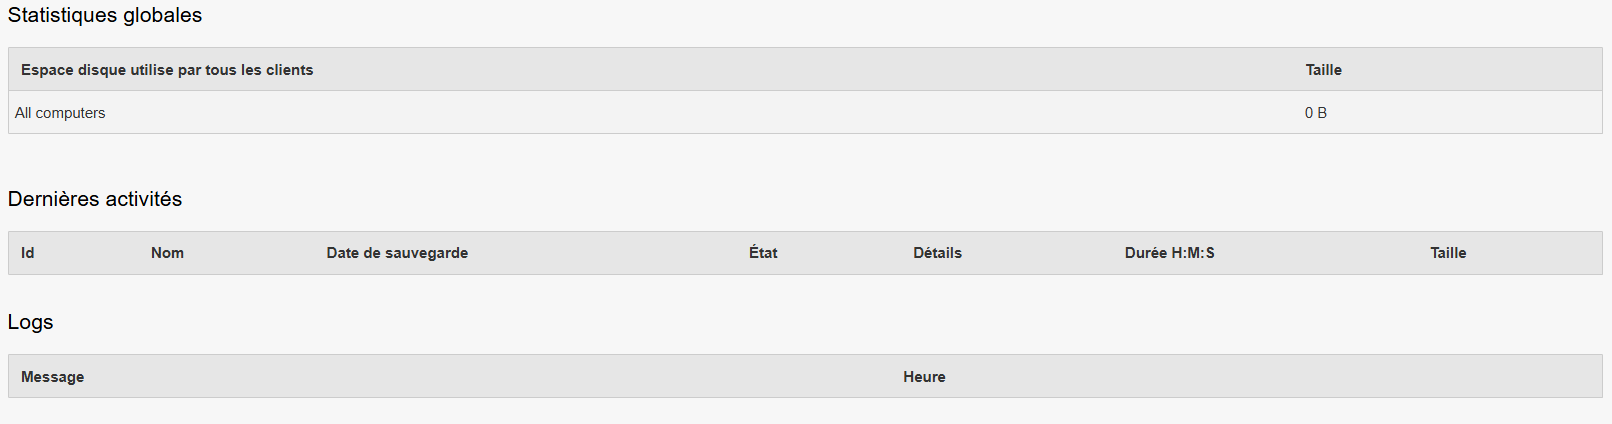
Access:
Review > Global statistics
Disk space used : total size of backups on all clients
Active / Saved Machines
Successful / failed backups
Setting up a backup strategy is not just about avoiding data loss: it's about ensuring the continuity of your operations. With the platform, you can:
Follow all activities in real time
Visualize your overall efficiency via statistics
Chapter 12: Background
Access to newspapers
This chapter presents the various features related to historical system via logs (logs). Each section is described step by step to facilitate consultation, analysis and operation of recorded events.
Objective : View events recorded by each component of the system.
Steps :
-
Open the administration interface.
-
Click on the tab Logs in the main menu.
-
A list of modules is displayed, including:
-
logs inventory -
logs backuppc -
logs deployment -
logs quickaction -
logs download -
logs kiosk -
logs packaging -
logs remote desktop -
logs imaging
-
-
Select the module you want to view from the logs.
-
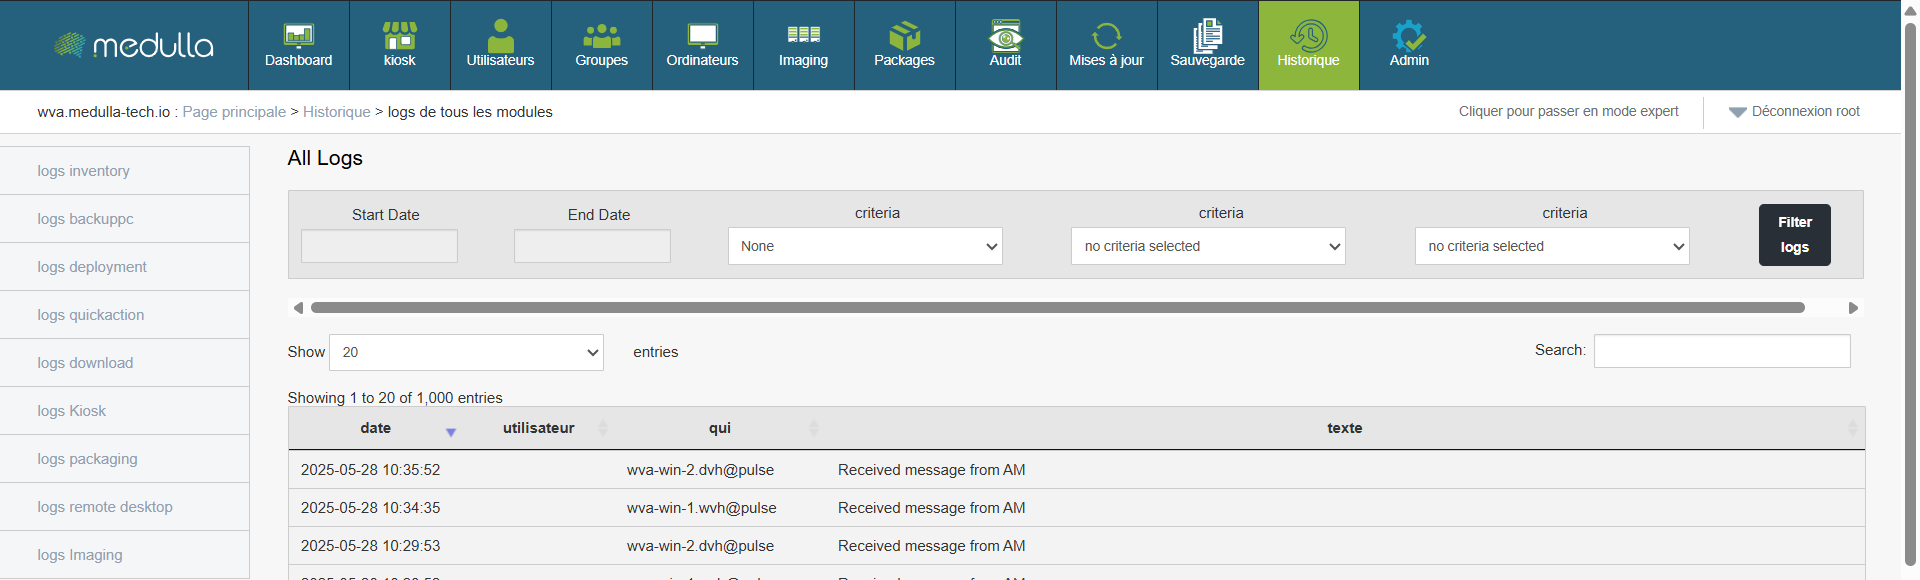
The events appear immediately in the table below the title Journal of + the log chosen.
Search and filter logs
To quickly extract specific events from defined criteria to increase efficiency during analysis.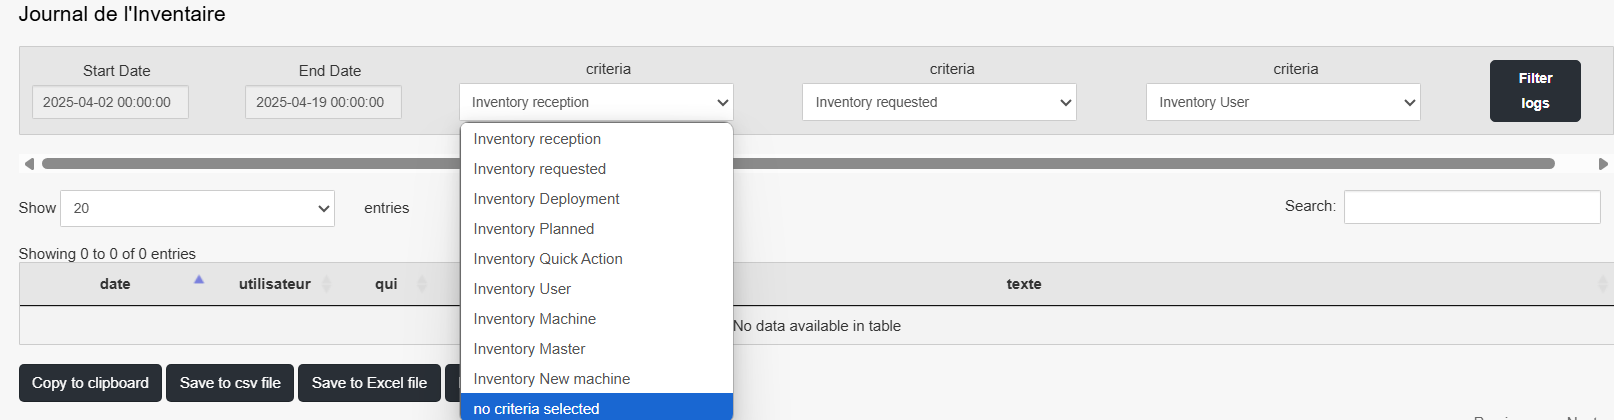
Steps:
Define a search period
In the fields Start Date and End Date, indicate the desired time range.
Example:
Start Date:
2025-04-14 00:00:00End Date:
2025-04-14 23:59:59
Select specific criteria (optional)
Open the drop-down menu Criteria to refine your search.
The options available are:
inventory reception: events related to the reception of machinesinventory requestedInventory requestedinventory deployment: recording during deploymentsinventory plannedPlanned operationsinventory quick action: Instant actions on equipmentinventory user: user activitiesinventory machine: actions associated with a specific machineinventory master: interventions carried out by a master accountinventory new machine: addition of new machinesno criteria selected: allows to display all events without filtering
Apply filters
Click on the button Filter logs.
The table updates to display only events corresponding to your filters.
Search for a free keyword
- In the Show field, you can choose the number of entries that will be displayed.
In the fieldSearch (at the top right of the table), enter a free text string.
Example:
guacamole,error,registered
Adjust Display
In the section Show X entries, select how many lines should be visible per page.
Example:
20for smooth reading.
Example of a combined filter:
To display all new machines recorded between April 13 and 14, 2025:
Start Date:
2025-04-13 00:00:00End Date:
2025-04-14 23:59:59Criteria:
inventory new machineClick Filter logs
Understanding logs
In order to interpret the information contained in each line of the newspaper.
Each table entry contains the following columns: :
Date : Date and time of event
User : Equity-generated account
Who : Machine or service concerned
Text Description of the action
Example of reading :
Council Consolidate similar logs to identify trends or sequence of operations (e.g. successive recordings, multiple deployments, etc.).
Export logs
To save logs for external analysis, archiving or sharing.

Steps :
Apply your filters (by date, user, etc.) to isolate the desired logs.
Click on the button Export (or Export logs depending on the interface).
Choose the output format:
CSV : for processing in Excel or Google Sheets
PDF : for quick archiving or transmission
The file is generated and downloaded automatically.
Save it or transfer it according to your needs (report, audit, support...).
The historical system is a key tool for:
Ensuring traceability of actions
Quickly identify anomalies
Understanding the behaviour of machines or users
Facilitate diagnosis and intervention
Ensuring system compliance and transparency
Regular and rigorous use of logs will ensure the long-term security and reliability of your infrastructure.
Chapter 13: Admin
List of XMPP relays
TheXMPP relay are communication points between the different machines in your network.
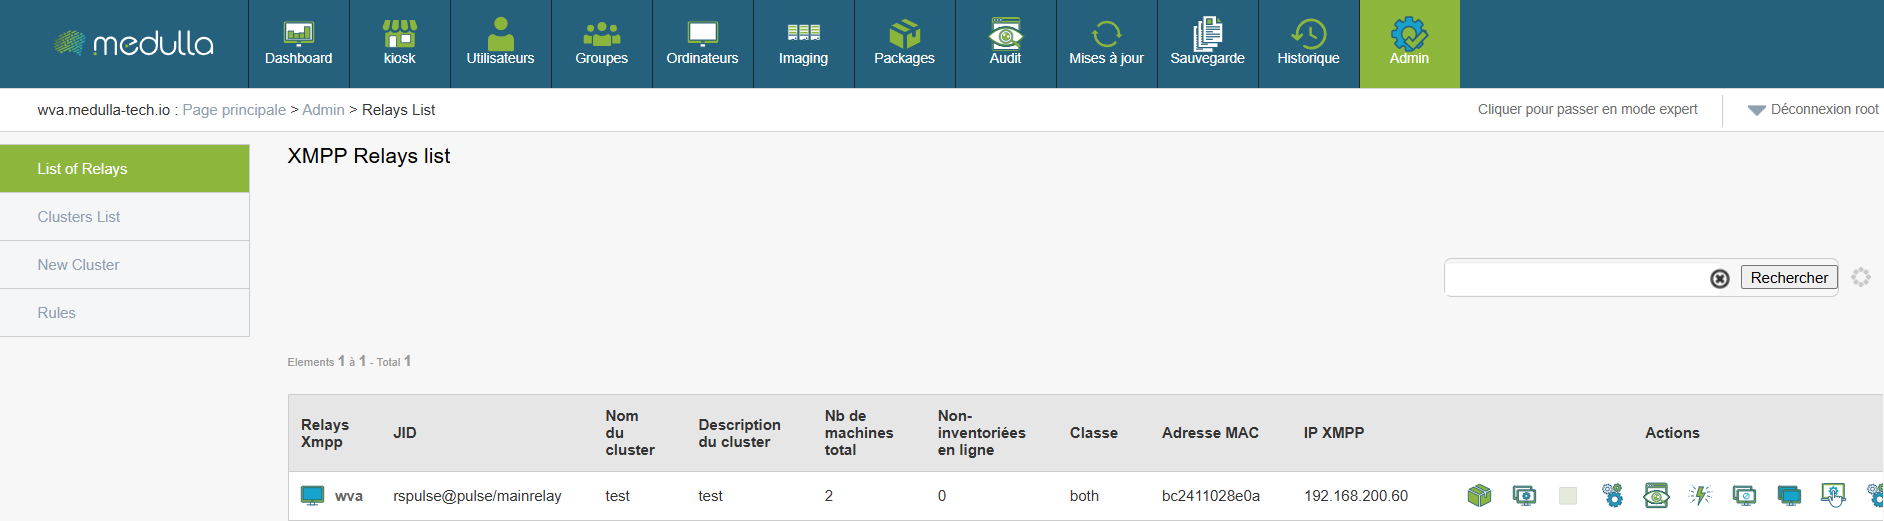
Why is it useful:
This allows you to see all active connections and understand how machines communicate with each other.
Steps:
Tip:
You can search a relay by typing a keyword in the search bar at the top of the list.
Cluster List
Onecluster, it is a group of relays that are grouped together to organize the network more logically.
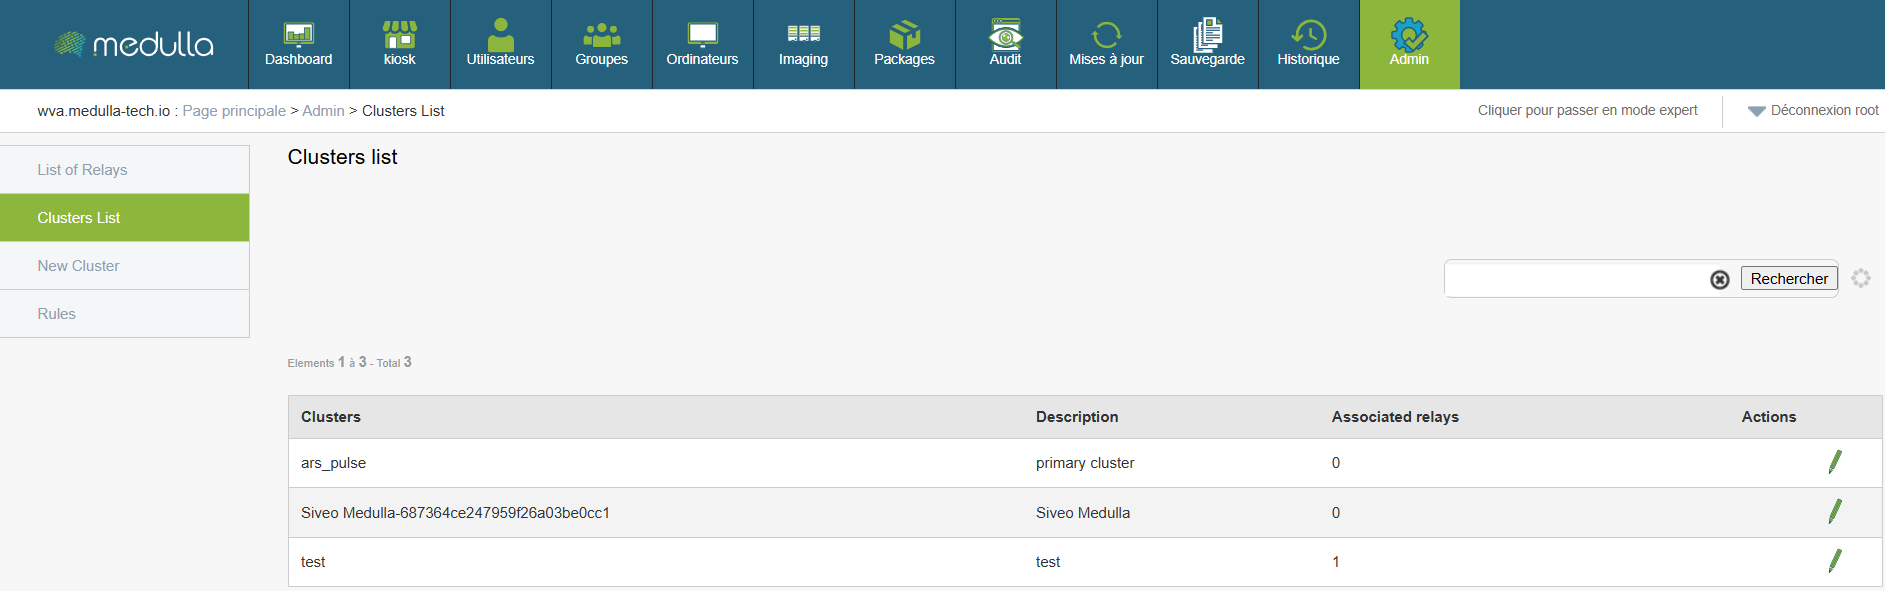
Why is it useful:
This helps you better manage your network, especially if you have different environments (e.g. testing, production, etc.).
Steps:
-
Go to the section .
-
You will see a list with:
-
The name of cluster
-
Its Description
-
The type (private or public)
-
The relay Associated
-
Example:
A cluster named Public can contain all shared public relays.
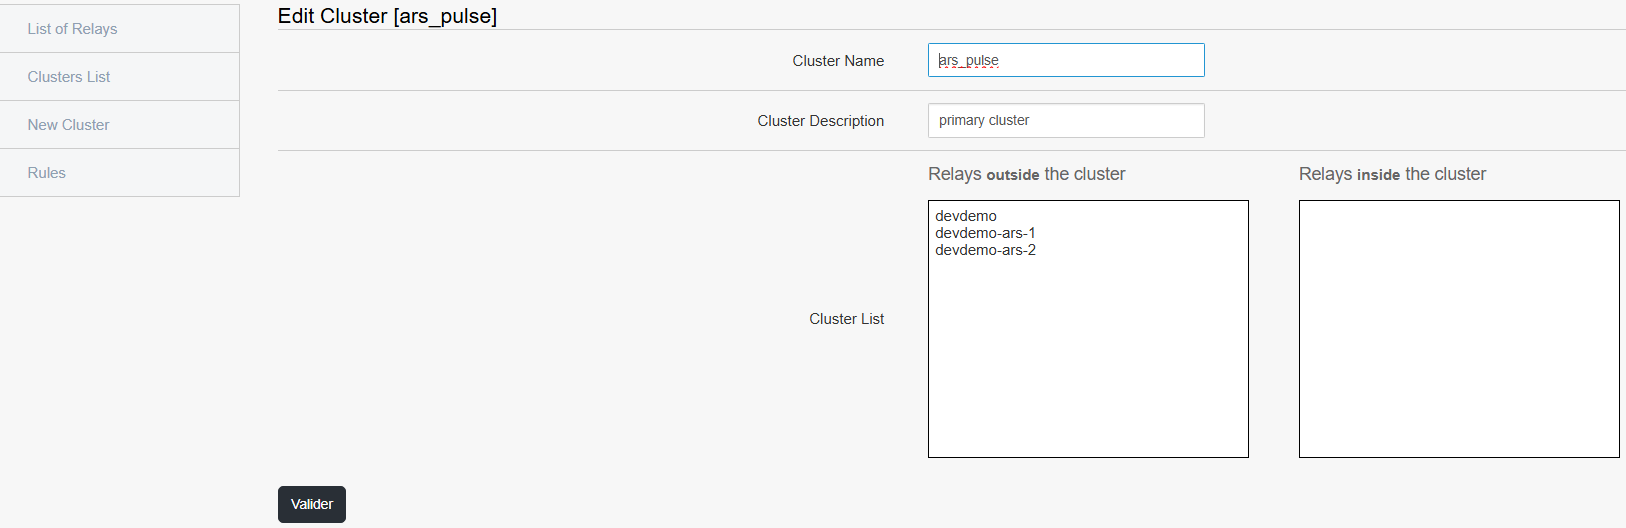
By clicking on the pencil in Actions, you can edit the Cluster by following the following steps:
- Choose a cluster name
- Select text for description
- Select external relays to the cluster to put in the cluster and vice versa
- Validate
Create a cluster
Create acluster allows you to better organize your relays according to your needs (e.g. separate tests from production). This is exactly the same form as the editing form.
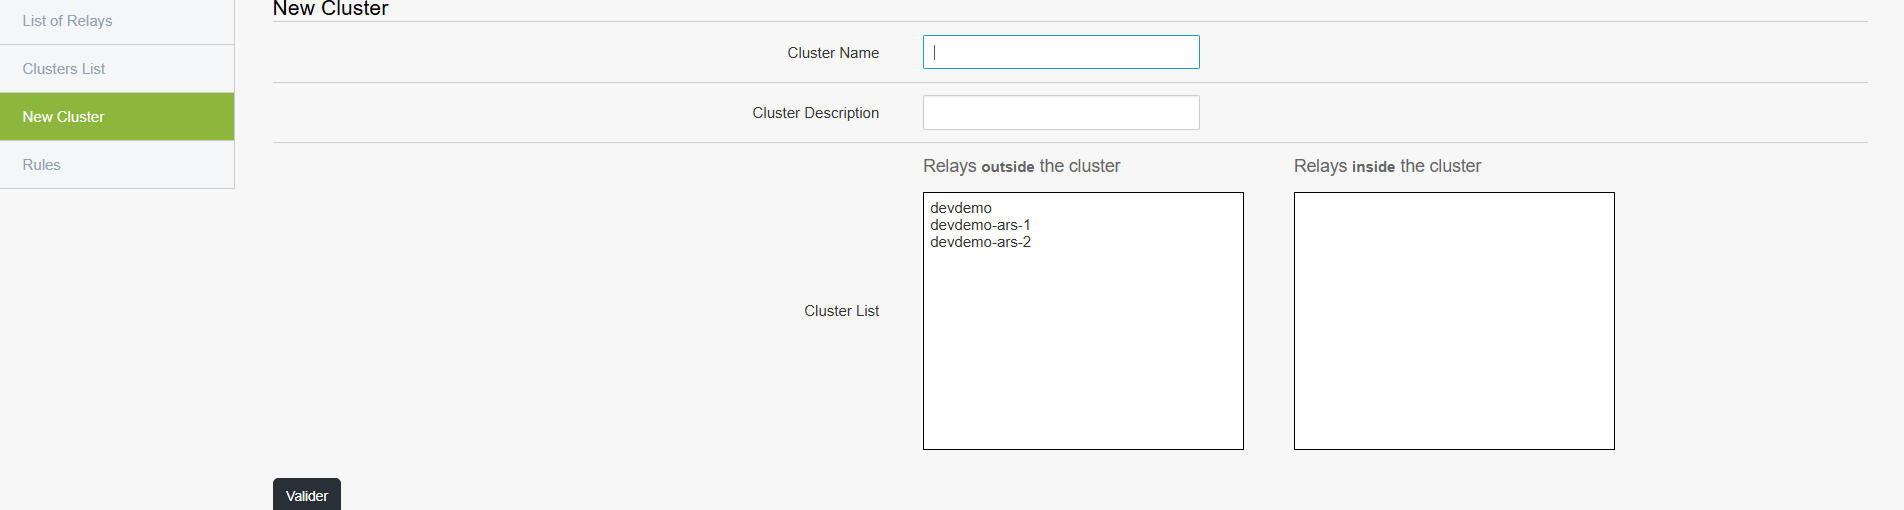
Steps:
Click New Cluster in the menu.
Press the button Add a new cluster.
Fill in the fields:
Name of the cluster (e.g. "TestCluster")
Description (e.g. "Cluster for test relays")
Choose the relays you want to associate with (a list displays).
Click to record.
Managing Rules (Rules)
Therules allow you to automate certain actions or behaviors of the network.

Why is it useful:
This can, for example, initiate automatic verification or apply specific parameters under defined conditions.
Steps:
Click "Rules" in the menu.
On the page you can:
Change order of priority existing rules by pressing the arrow that points down to decrease it or the one that points up to increase it.


Add new rule according to your needs

- See detail a rule


When clicking on the logo plus to add a new rule, you can access the following form:
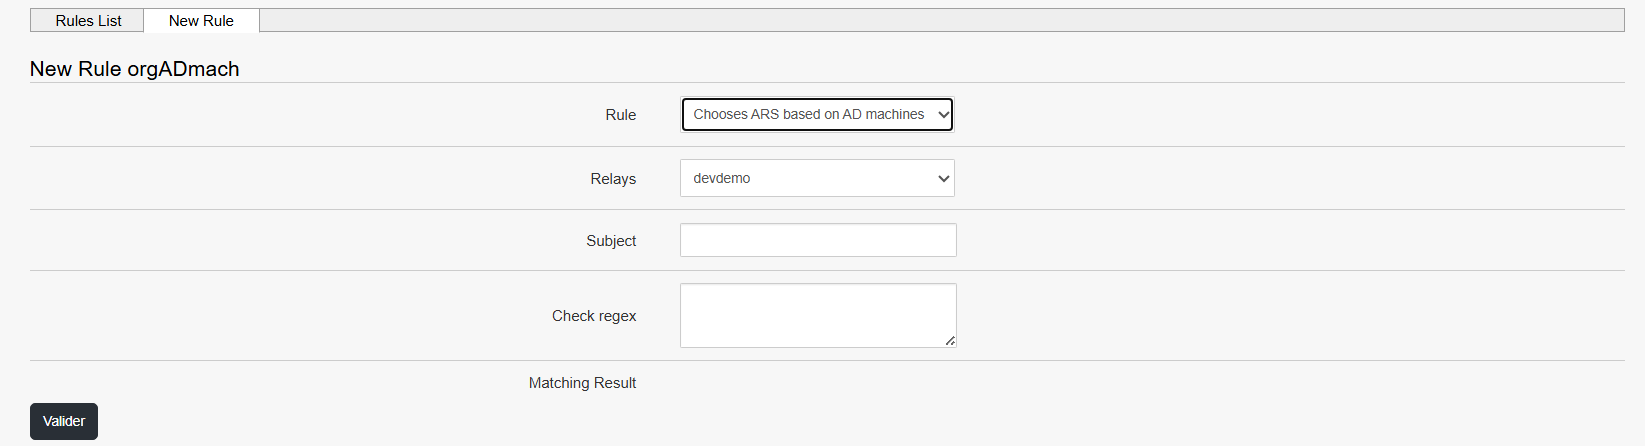
Fill the fields one by one:
- Choose the rule
- Choose your relay (Relays)
- Describe the subject
- Write the regex to check
- Validate
Even without being technical, you can ask an administrator what rules are recommended for your environment.
Quick action
Each XMPP relay has a set ofrapid action which allow direct interaction with the machines it manages. These actions are accessible from the list of relays and are designed to simplify the day-to-day operations of administration, diagnosis or configuration, without requiring advanced technical knowledge.
Here is a detailed overview of each action, its usefulness and the procedure for using it.
1. See the list of installed packages
Objective
View software installed on machines attached to a relay.
Procedure

Click on the button "List of packages" to the right of the relay concerned.
A window opens displaying installed software, with its name and version.
When to use
To verify the presence of a program.
To control deployed software versions.
2. Reconfigure relay related machines
Objective
Automatically reapply the active configuration to the machines attached to the relay.
Procedure

Click "Reconfigure".
Confirm the action if validation is requested.
The machines are again given the current configuration.
When to use
After changing the settings, rules or configuration files.
If a machine appears to be unsynchronised or non-compliant.
3. Change the relay of one or more machines (Switch function)
Objective
Move one or more machines from one relay to another.
Procedure

Click Switch to the right of the original relay.
Select the moving machines.
Choose the destination relay.
Validate to apply the change.
When to use
In case of maintenance or removal of a relay.
During a reorganization of the network architecture.
4. Edit Configuration Files
Objective
Manually modify the configuration files of a relay or its machines.
Procedure

Click "Edit configuration files" (first working image)
An editing interface opens.
Make the necessary changes.
Save the changes.
When to use
To adjust a specific configuration to a specific need.
During a test or manual procedure.
Note This operation acts directly on the system. Use with caution.
5. Show current or past audits (QA)
Objective
Consult compliance, safety or quality tests performed on machines.
Procedure

Click "QA launched".
A window displays the list of tests performed and their status (successful or failed).
When to use
To check that the rules are being applied.
To identify possible malfunctions.
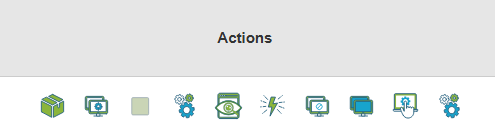
6. Access system actions (advanced diagnostic)
Objective
Use remote diagnostic or intervention tools on a machine.
Procedure

Click Action Next to the relay.
Select one of the available options:
Reboot : restarting the machine.
Process : visualization of processes in progress.
Disk use : consultation of the disk space used.
Agent version : version of software agent installed.
Netstat : display of active network connections.
Console : opening of a command line interface.
When to use
When a machine is broken, slowed or unstable.
For quick diagnosis or manual verification.
7. Banning a machine
Objective
Temporaryly block a machine's access to the system.
Procedure

Click "Bannir" Next to the relay.
Confirm the banner.
The machine is isolated from the rest of the network.
When to use
In case of abnormal behaviour, suspicion of compromise or critical error.
8. Debanniating a machine
Objective
Lift the block applied to a previously banned machine.
Procedure

Click "Debannier".
The machine regains its normal communication rights.
When to use
After correcting the initial problem.
If the machine was incorrectly blocked.
9. Remote control
Objective
Control a machine remotely as if you were physically in front of it.
Procedure

Click "Hand-to-hand".
A remote session opens, allowing you to interact with the machine's graphical interface.
When to use
To intervene manually.
To diagnose a specific problem.
When no other automated action is enough.
10. Manage relay rules
Objective
Consult, modify or add specific operating rules to a relay.
Procedure
Click "Relay rules" (last working image)
From the interface:
View existing rules.
Change or delete outdated rules.
Add new rules as needed.
When to use
To automate repetitive actions.
To dynamically adapt the relay behavior to a specific use.