Chapter 12: History
Access the logs
This chapter presents the various features related to system history via logs. Each section is described step by step to facilitate the viewing, analysis, and use of recorded events.
Objective: View the events recorded by each system component.
Steps:
-
Open the administration interface.
-
Click the Logs tab in the main menu.
-
A list of modules appears, including:
-
inventory logs -
backup logs -
deployment logs -
quick-action logs -
download logs -
kiosk logs -
packaging logs -
remote access logs -
imaging logs
-
-
Select the module whose logs you want to view.
-
The events appear immediately in the table located below the "Log" heading for the selected log.
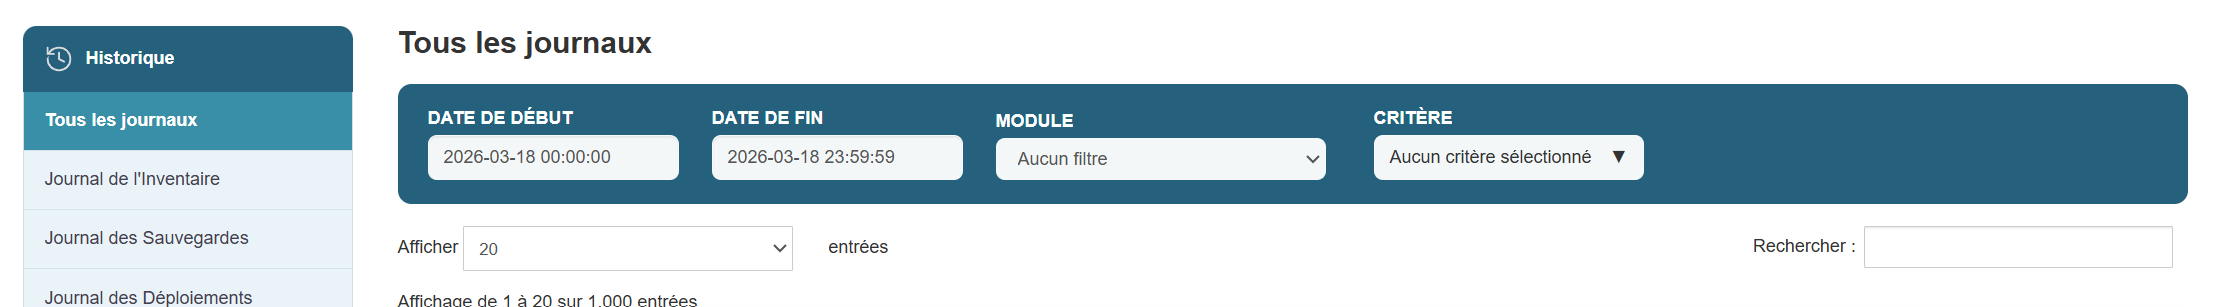
Search and filter logs
To quickly extract specific events based on defined criteria to improve efficiency during analysis.
Steps:
-
Define a search period
-
In the Start Date and End Date fields, specify the desired time range.
-
Example:
-
Start Date:
2025-04-14 00:00:00 -
End Date:
2025-04-14 23:59:59
-
-
-
-
Select specific criteria (optional)
-
Open the Criteria dropdown menu to refine your search.
-
The available options are as follows:
-
inventory reception: events related to the receipt of machines -
inventory requested: requested inventory -
inventory deployment: recording during deployments -
inventory planned: planned operations -
inventory quick action: instant actions on equipment -
inventory user: user activities -
inventory machine: actions associated with a specific machine -
inventory master: actions performed by a master account -
inventory new machine: adding new machines -
No criteria selected: displays all events without filtering
-
-
-
Apply filters
-
Click the Filter logs button.
-
The table updates to display only the events that match your filters.
-
-
Search for a keyword
- In the Show field, you can choose the number of entries to display.
-
In theSearch field (top right of the table), enter a free-text string.
-
Example:
guacamole,error,registered
-
-
Adjust the display
-
In the Show X entries section, select how many rows should be visible per page.
-
Example:
20for smooth reading.
-
-
Example of a combined filter:
To display all new machines registered between April 13 and April 14, 2025:
-
Start Date:
2025-04-13 00:00:00 -
End Date:
2025-04-14 23:59:59 -
Criteria:
inventory new machine -
Click Filter logs
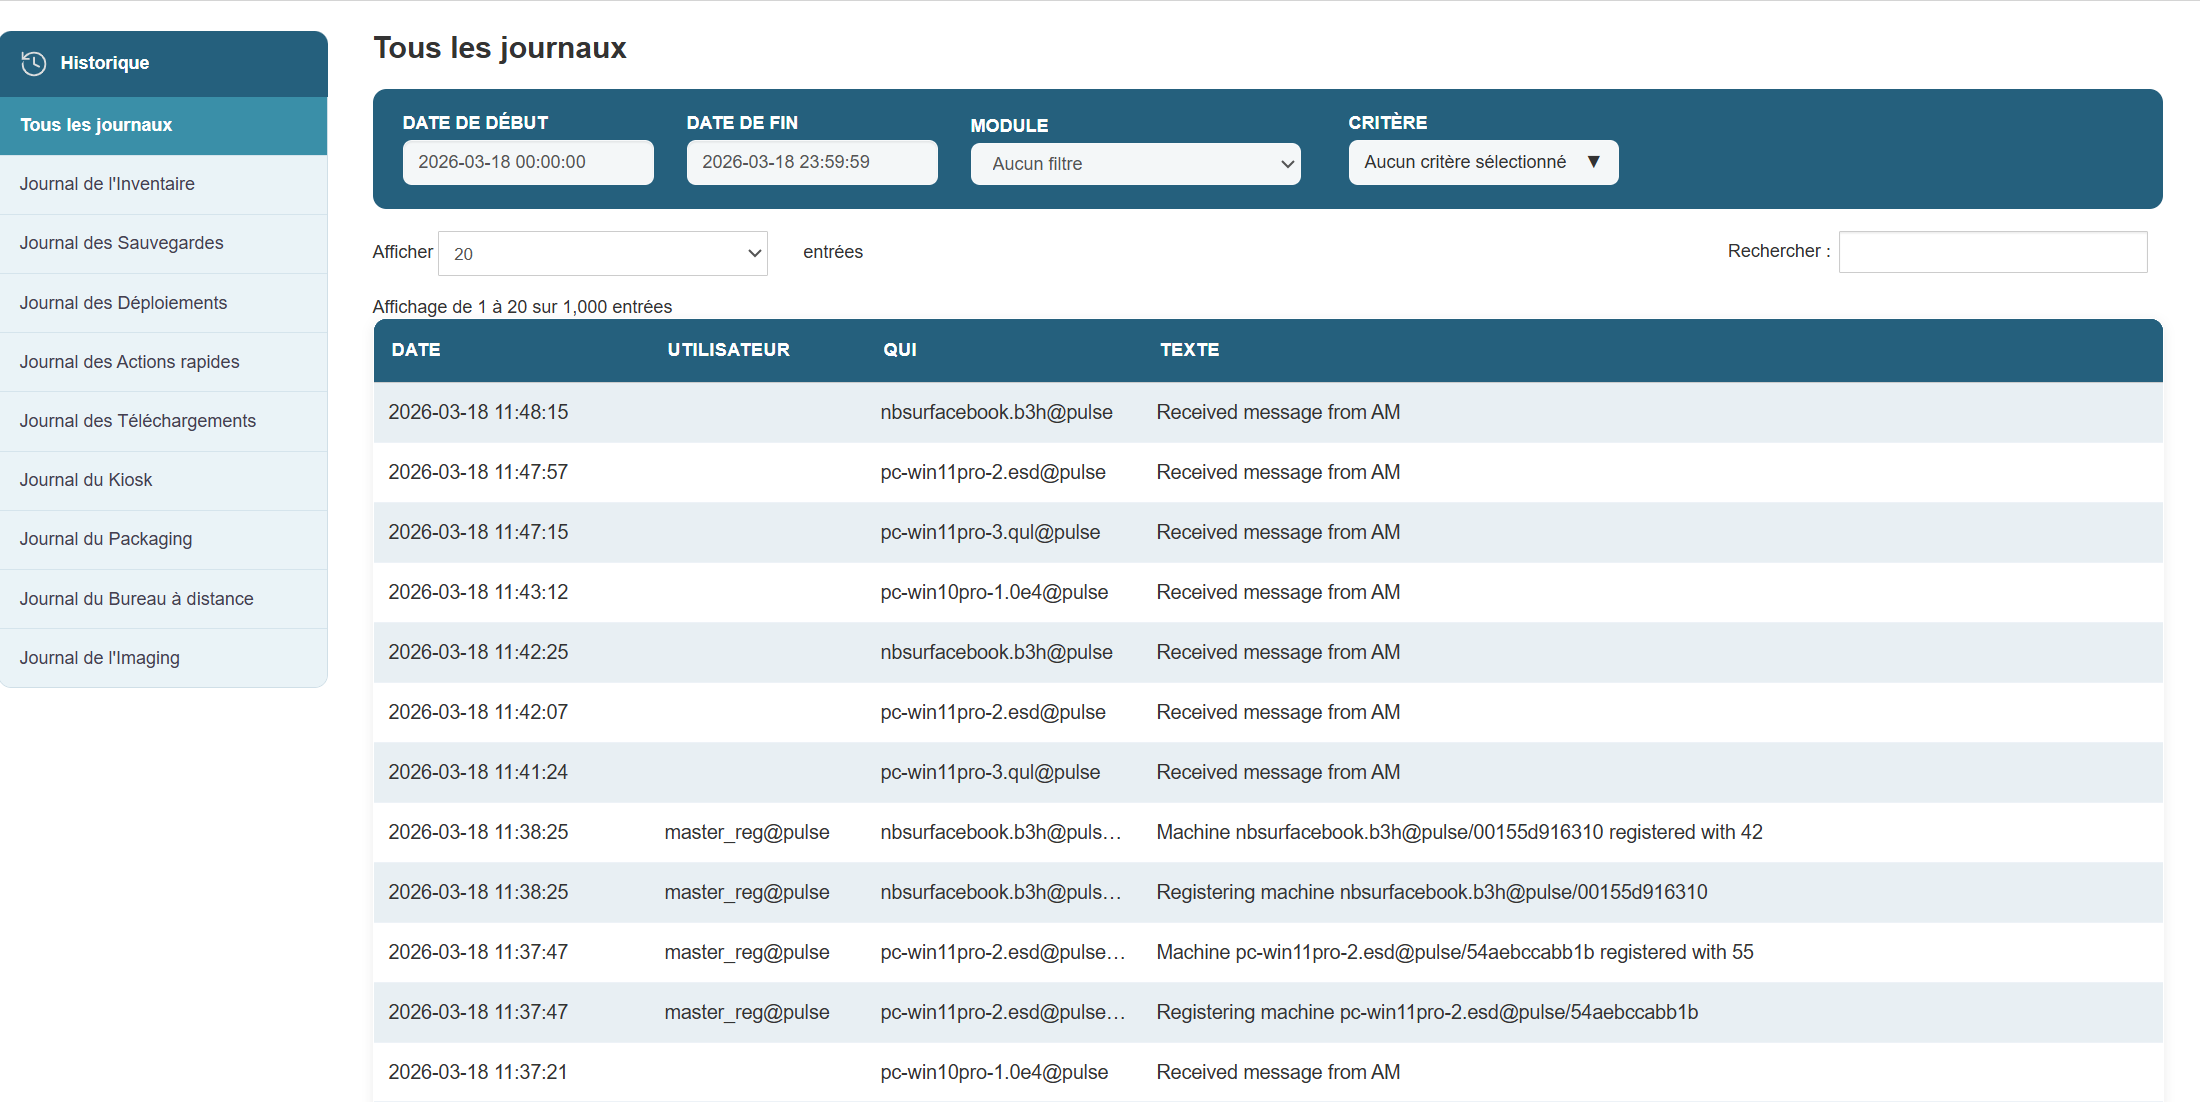
Understanding the logs
To interpret the information contained in each line of the log.
Each entry in the table contains the following columns:
-
Date: Date and time of the event
-
User: Account that generated the action
-
Who: Machine or service involved
-
Text: Description of the action performed
Example:
Tip: Group similar logs together to identify trends or sequences of operations (e.g., successive registrations, multiple deployments, etc.).
Export logs
To save logs for external analysis, archiving, or sharing.

Steps:
-
Apply your filters (by date, user, etc.) to isolate the desired logs.
-
Click the Export button (or Export logs, depending on the interface).
-
Choose the output format:
-
CSV: for processing in Excel or Google Sheets
-
PDF: for archiving or quick sharing
-
-
The file is generated and downloaded automatically.
-
Save it or transfer it as needed (report, audit, support, etc.).
The system history is a key tool for:
-
Ensuring the traceability of actions
-
Quickly identifying anomalies
-
Understand the behavior of machines or users
-
Facilitate diagnostics and interventions
-
Ensuring system compliance and transparency
Regular and thorough use of logs helps to sustainably enhance the security and reliability of your infrastructure.