Chapter 2: Getting Started with Medulla
How to log in to Medulla
To access Medulla’s features, you must log in with your credentials. This step ensures the security of your data and personalized access.
Login Steps
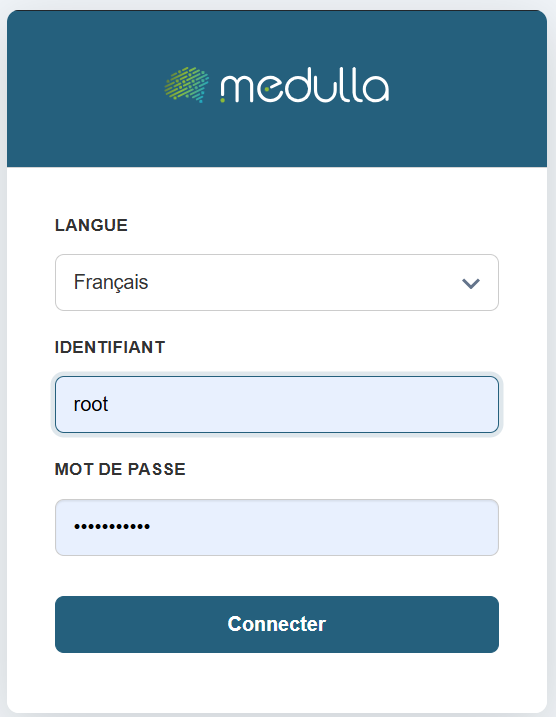
Choose your language
On the login page, select your preferred language from the dropdown menu. The default language is French, but you can change it if necessary.
Enter your username
Enter the username or email address you provided when creating your account.
Enter your password
In the Password field, enter your personal password. Make sure it is spelled correctly: uppercase and lowercase letters are distinguished.
Confirm the login
Click the "Log In" button to access your user account.
For security reasons, avoid saving your password on shared devices.
If you have trouble logging in, contact your organization’s technical support
Dashboard
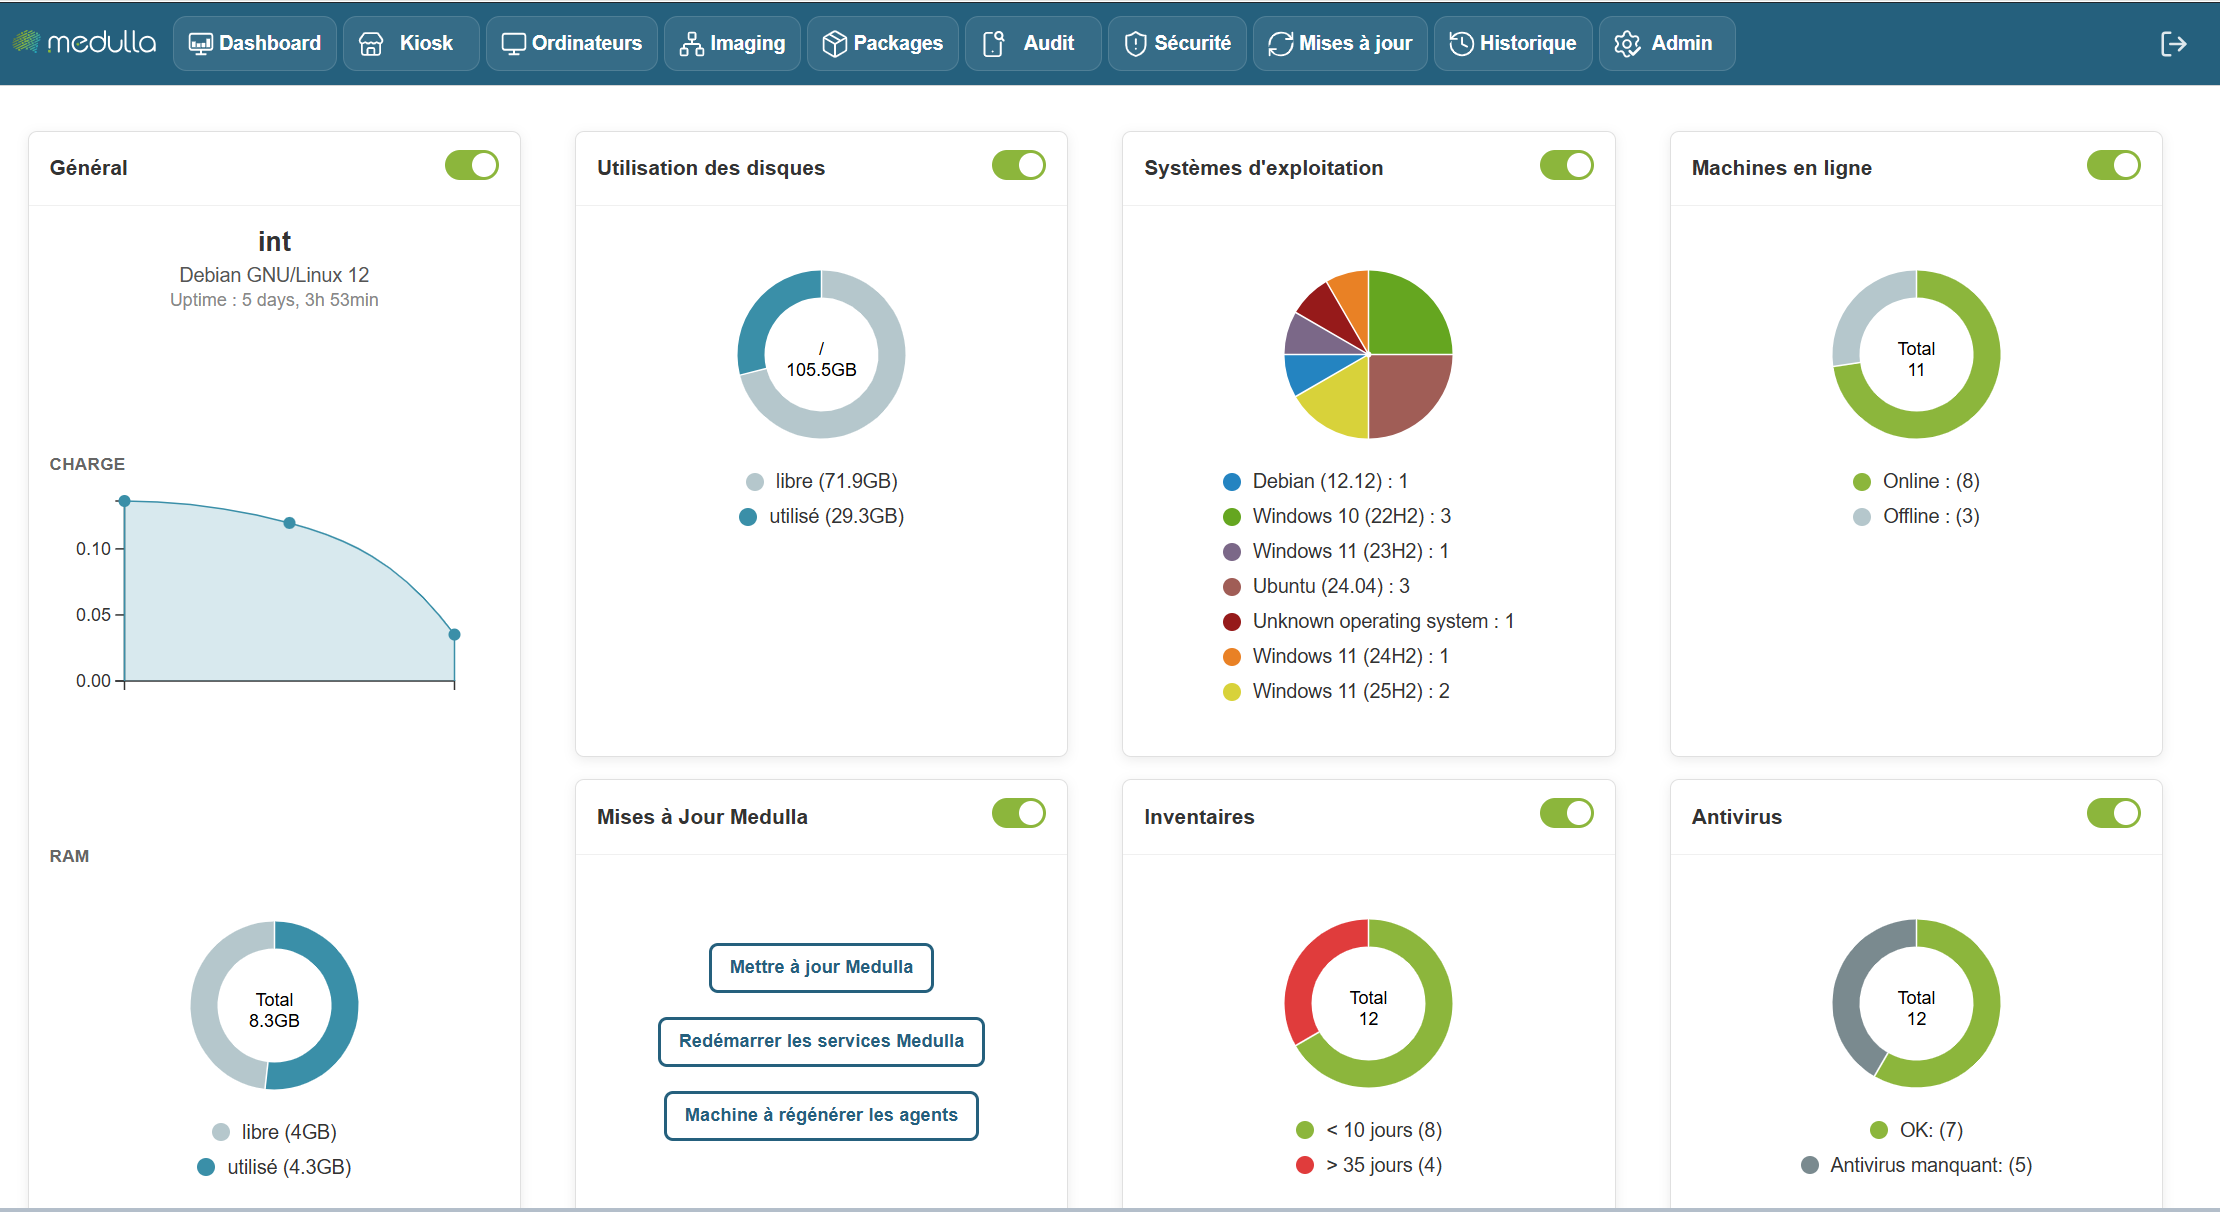
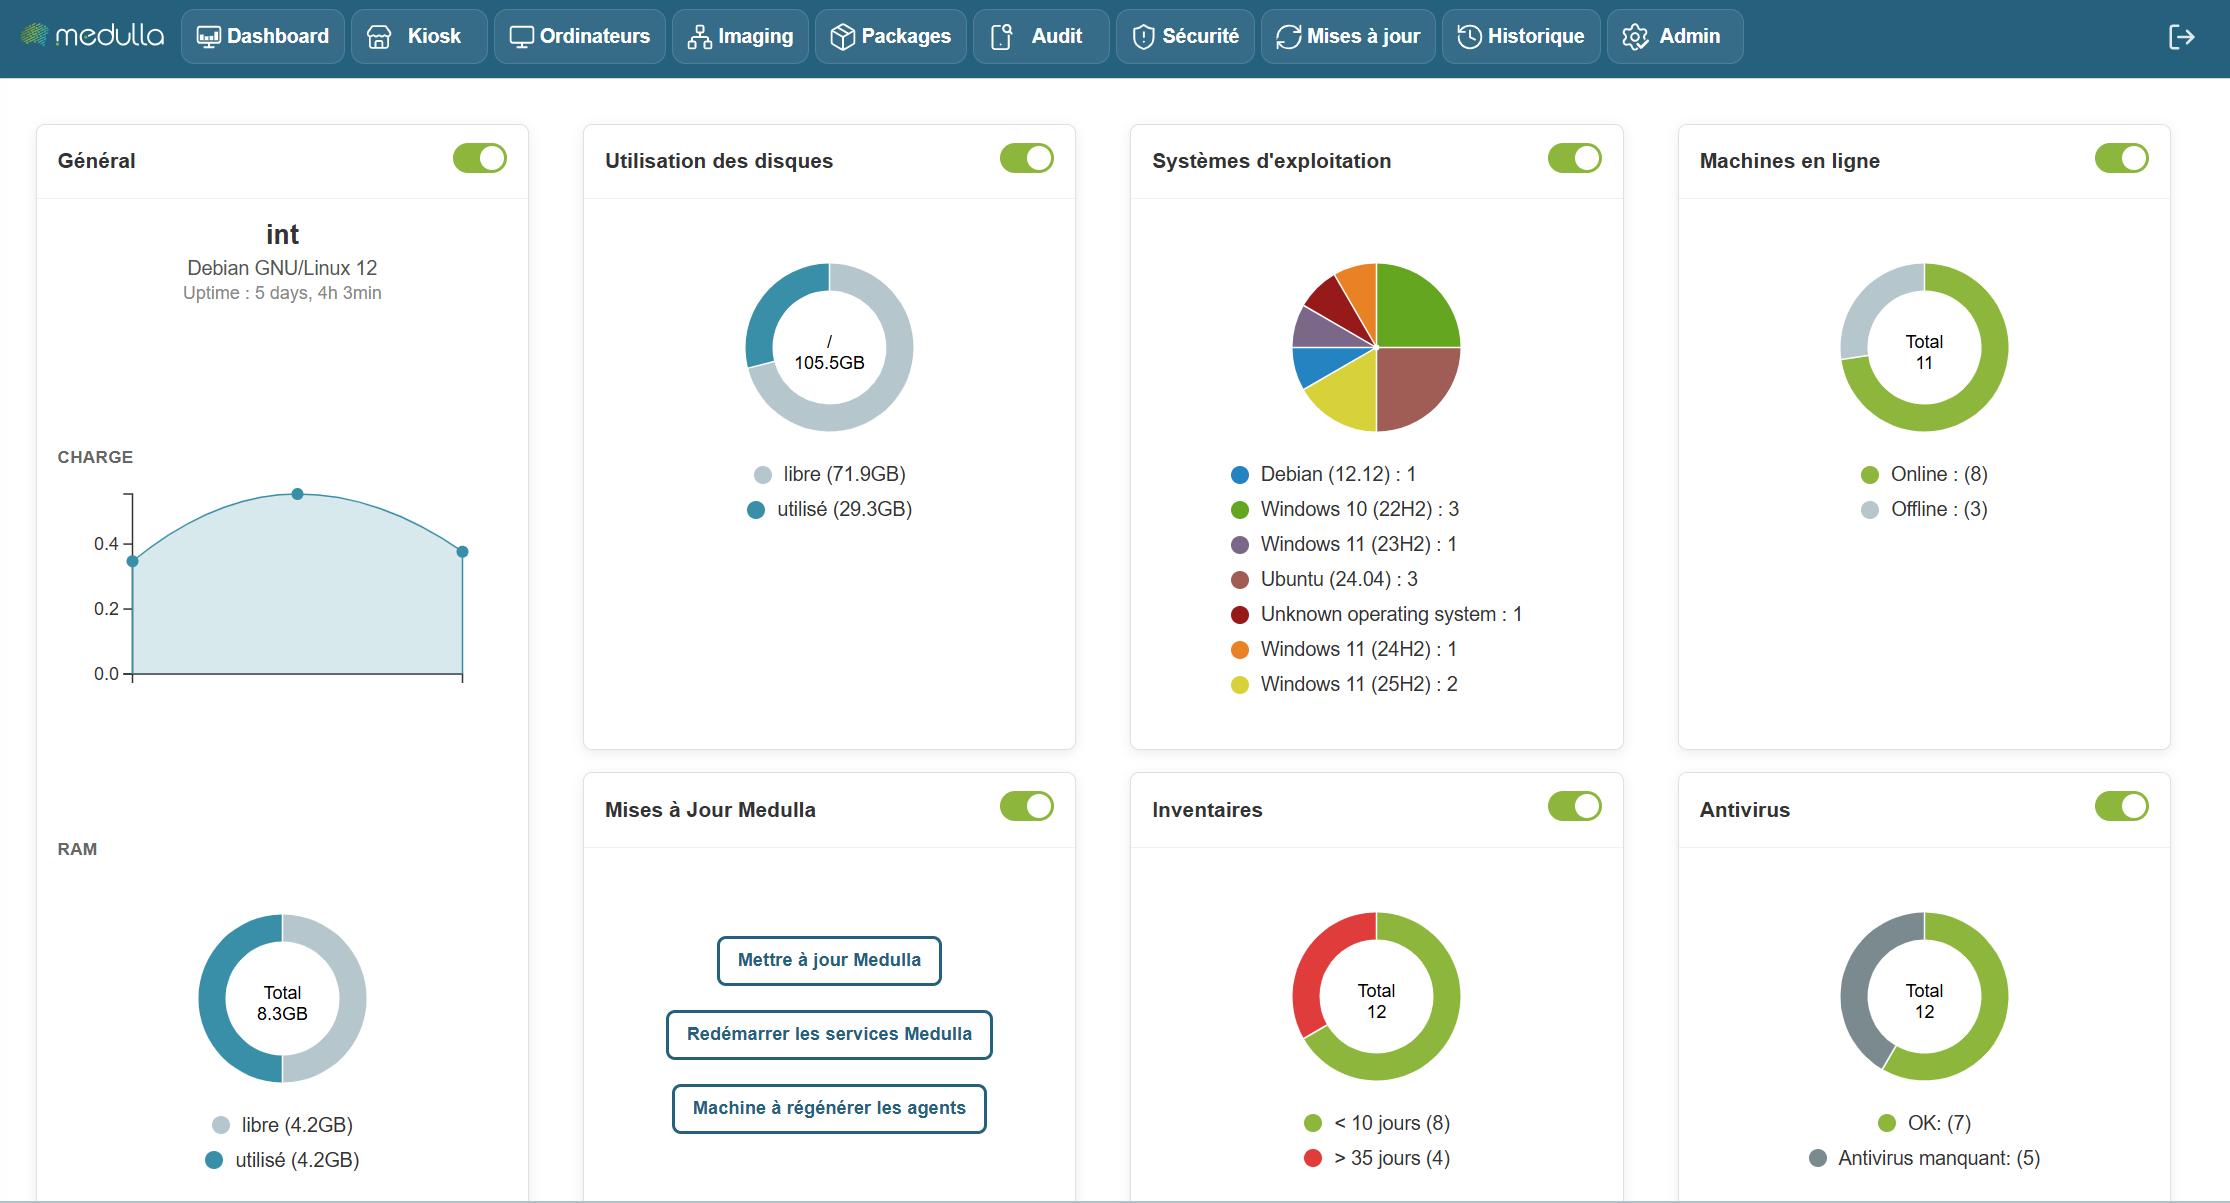
The Medulla dashboard allows you to monitor the real-time status of your infrastructure using customizable widgets. You can move, resize, and arrange the widgets as you wish. Each widget also has a button to show or hide it, depending on your needs.
Some widgets include dynamic charts for a better understanding of the data, updating in real time.
The following widgets allow you to create static groups directly so you can perform actions on them by clicking:
Inventory Widget, Operating System, Online Machines, Antivirus
Available Widgets
Widgets are organized by category and allow you to view various information about your infrastructure. Here are the main categories:
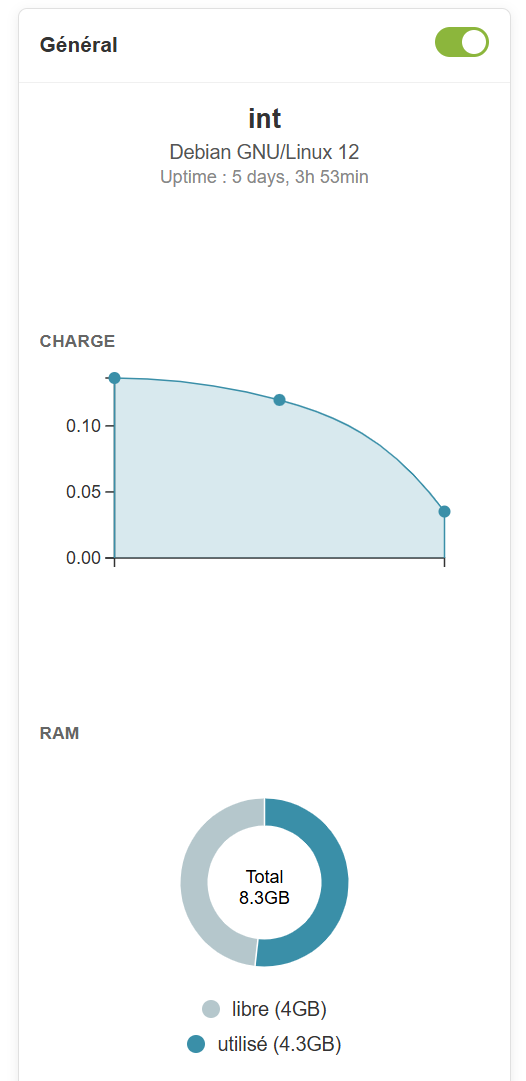
General
Information provided
-
Server name (example: devdemo.siveo.net on Debian GNU/Linux 12)
-
Uptime (time elapsed since the last system reboot)
-
TotalRAM, available RAM, and used RAM
Customization
This widget can be moved wherever you like, and it is resizable to display more or less information depending on your needs. You can also hide it using the toggle if you don’t need to see this information all the time.
Graphical representation
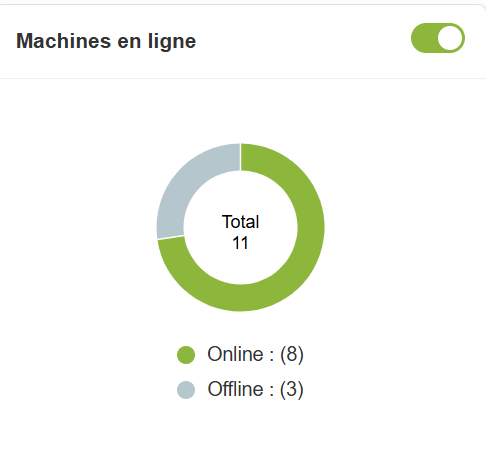
Online machines
Information provided
- Total number of online and offline machines.
Customization
This widget can be moved and resized as you like. The toggle allows you to show or hide it according to your preference.
Graphical representation
Pie chart to visualize the distribution of online and offline machines.
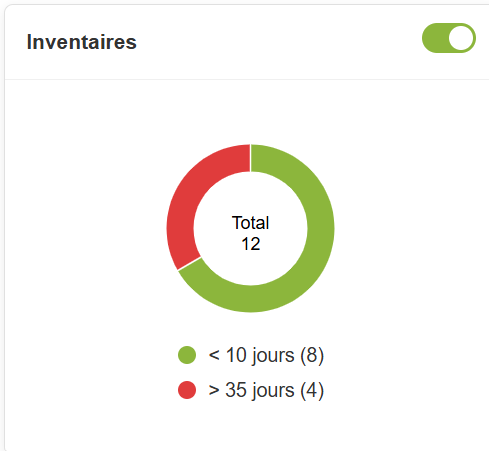
Inventory
Information provided
- Total number of items in the inventory and those that haven't been updated in over 10 days.
Customization
The widget is customizable and can be moved and resized. You can also hide it if you don’t need it.
Graphical representation
A pie chartdisplays the items in the inventory and highlights those requiring an update, providing an overview of the inventory’s status
In summary, the Dashboard is your centralized hub for managing and monitoring the status of your IT infrastructure. It is designed to be flexible and responsive, providing an overview of the performance of your machines and resources, while allowing you to react quickly to any alerts or necessary updates.
With this set of tools and graphical visualizations, the Dashboard gives you optimal control to manage your systems efficiently, while providing a clear and detailed view of your entire IT environment.
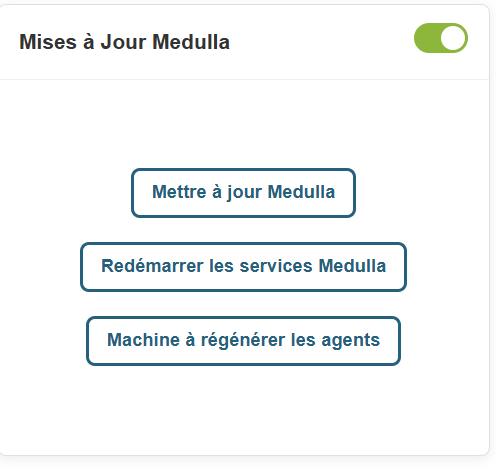
Updating Medulla via the interface
In the Medulla dashboard, an "Update Medulla" widget is available:
This widget allows you to:
- Check for Medulla version updates
- View Medulla version updates;
- Install Medulla version updates
- Restart Medulla services after updates
- Restart Medulla agents after updates
On the widget, click the Check for Updates button.
A popup will appear asking you to confirm the update, with backup requirements.
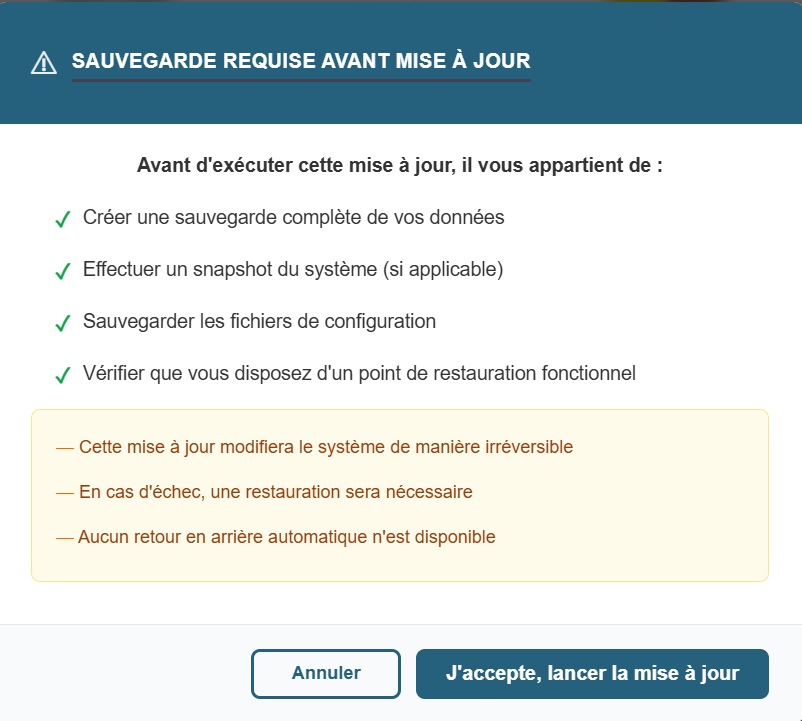
There are 2 buttons on the popup
- Cancel
- I Accept, Start Update.
When you click Start Update, the pop-up displays:
Once the update is complete, Medulla will force a logout from the interface.
Once you reconnect to Medulla, still within the Updates widget, please click the "Restart Medulla Services" button.
The session will be terminated; you will then need to reconnect to the interface.
Click the "Regenerate Agents" button.

The page will then display the following screen: