Monitoring alerts
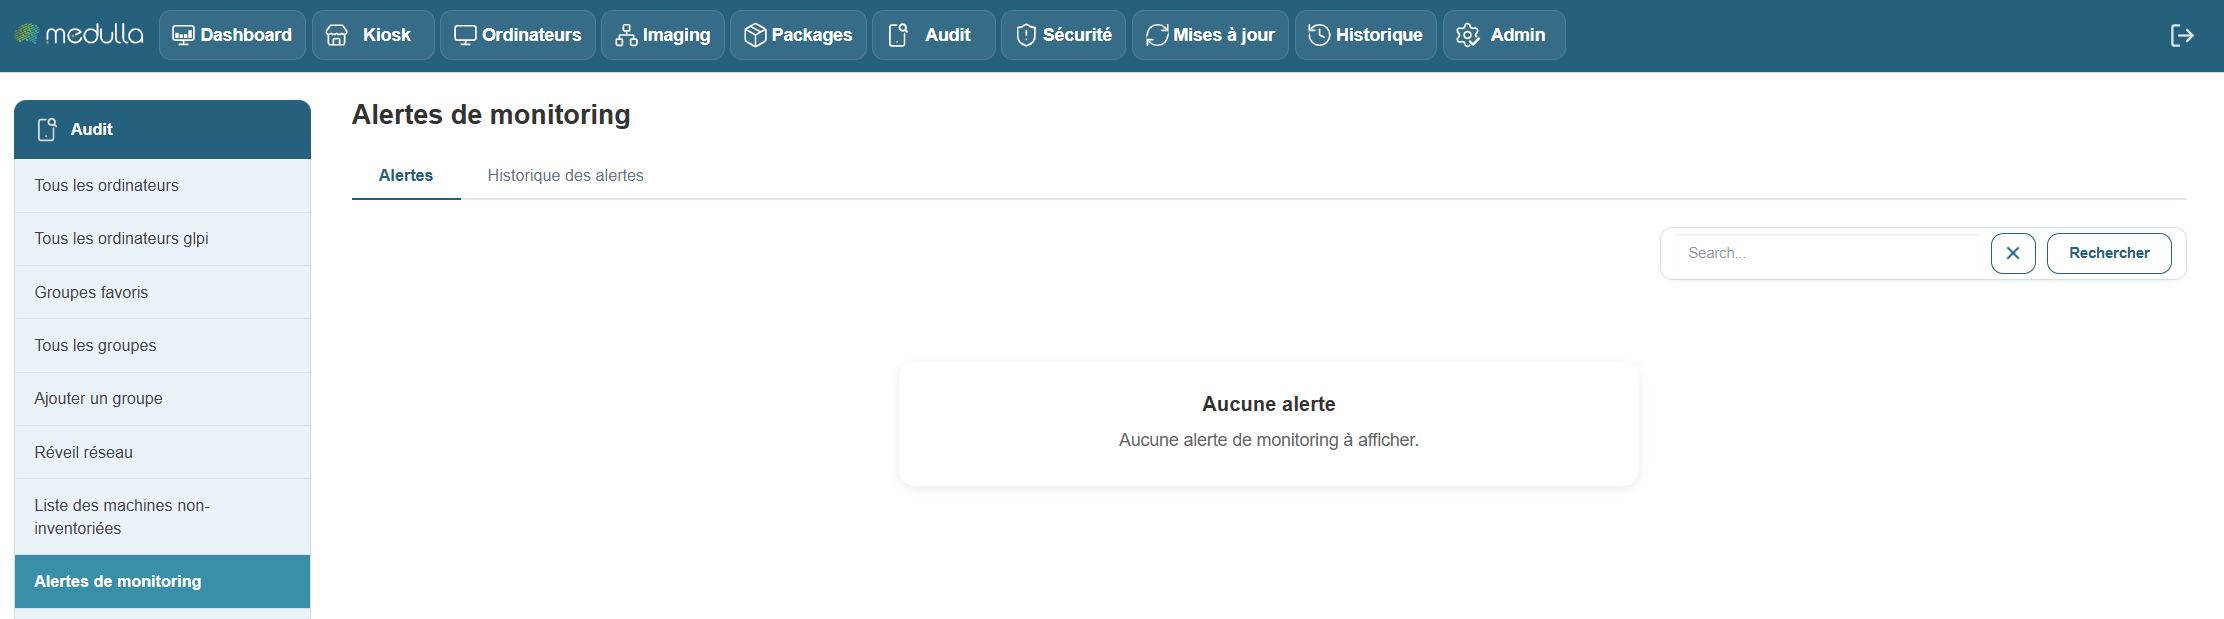
This section centralizes all alerts generated by the monitored machines in your Medulla environment. It allows you to track, in real time or later, hardware or software incidents detected by the monitoring agents deployed on your machines.
Objective
-
Identify critical or recurring incidents: such as disk failures, device errors, network anomalies, or any other issue affecting monitored machines.
-
Ensure clear event traceability: by maintaining a precise timestamp for each alert to guarantee comprehensive tracking.
-
Enable a rapid response: by alerting administrators to detected issues so they can intervene quickly.
Alert History
When no alerts are currently active, you can view the history of past events. This includes resolved alerts, ensuring complete traceability of incidents and actions taken on your machines.
Information available in the history:
If alerts are logged, the table will display the following:
-
Machine name: Name of the machine affected by the alert.
-
Event date: Exact date and time of the incident.
-
Event type: Category of the incident (e.g., device error, hardware failure).
-
Machine message: Details of the error or problem reported by the machine.
-
Affected device: The device associated with the incident (e.g., hard drive, network card).
-
Status: Current status of the alert (open, in progress, resolved).
-
Message: Alert message generated by the monitoring agent.
-
Serial number: Serial number of the device or machine.
-
Firmware: Firmware version related to the incident.
-
Comment: Space for comments or details about the incident.
-
Available Actions: Actions to take regarding the incident (e.g., resolve, ignore, export).
Note: If the table is empty, it means that no alerts have yet been detected or recorded in your environment.
Recommendations
Before making any changes, it is recommended that you back up the existing file.
Apply changes carefully and test them on a small number of machines.
Contact your system administrator if you have any questions about a setting.