On-Premises
- How to log in to Medulla
- Dashboard
- Adding a computer in Medulla
- Creating your first package
- Package deployment
- Track the audit of a deployment
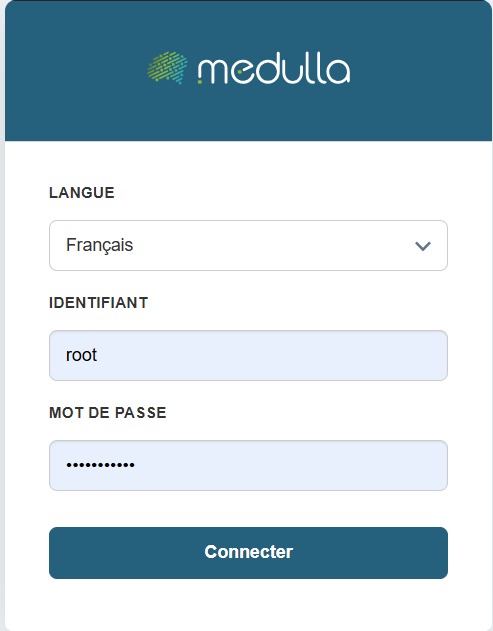
How to log in to Medulla
To access Medulla’s features, you must log in with your credentials. This step ensures the security of your data and personalized access.
Login Steps
Choose your language
On the login page, select your preferred language from the dropdown menu. The default language is French, but you can change it if necessary.
Enter your username
Enter the username and password for a GLPI or LDAP account, depending on the provisioning method defined during the configuration of your Medulla server.
OR
Log in directly via your OIDC if it is configured.
Enter your password
In the Password field, enter your personal password. Make sure it is spelled correctly: uppercase and lowercase letters are distinguished.
Confirm the login
Click the "Log In" button to access your user account.
For security reasons, avoid saving your password on shared devices.
If you have trouble logging in, contact your organization’s technical support
Dashboard
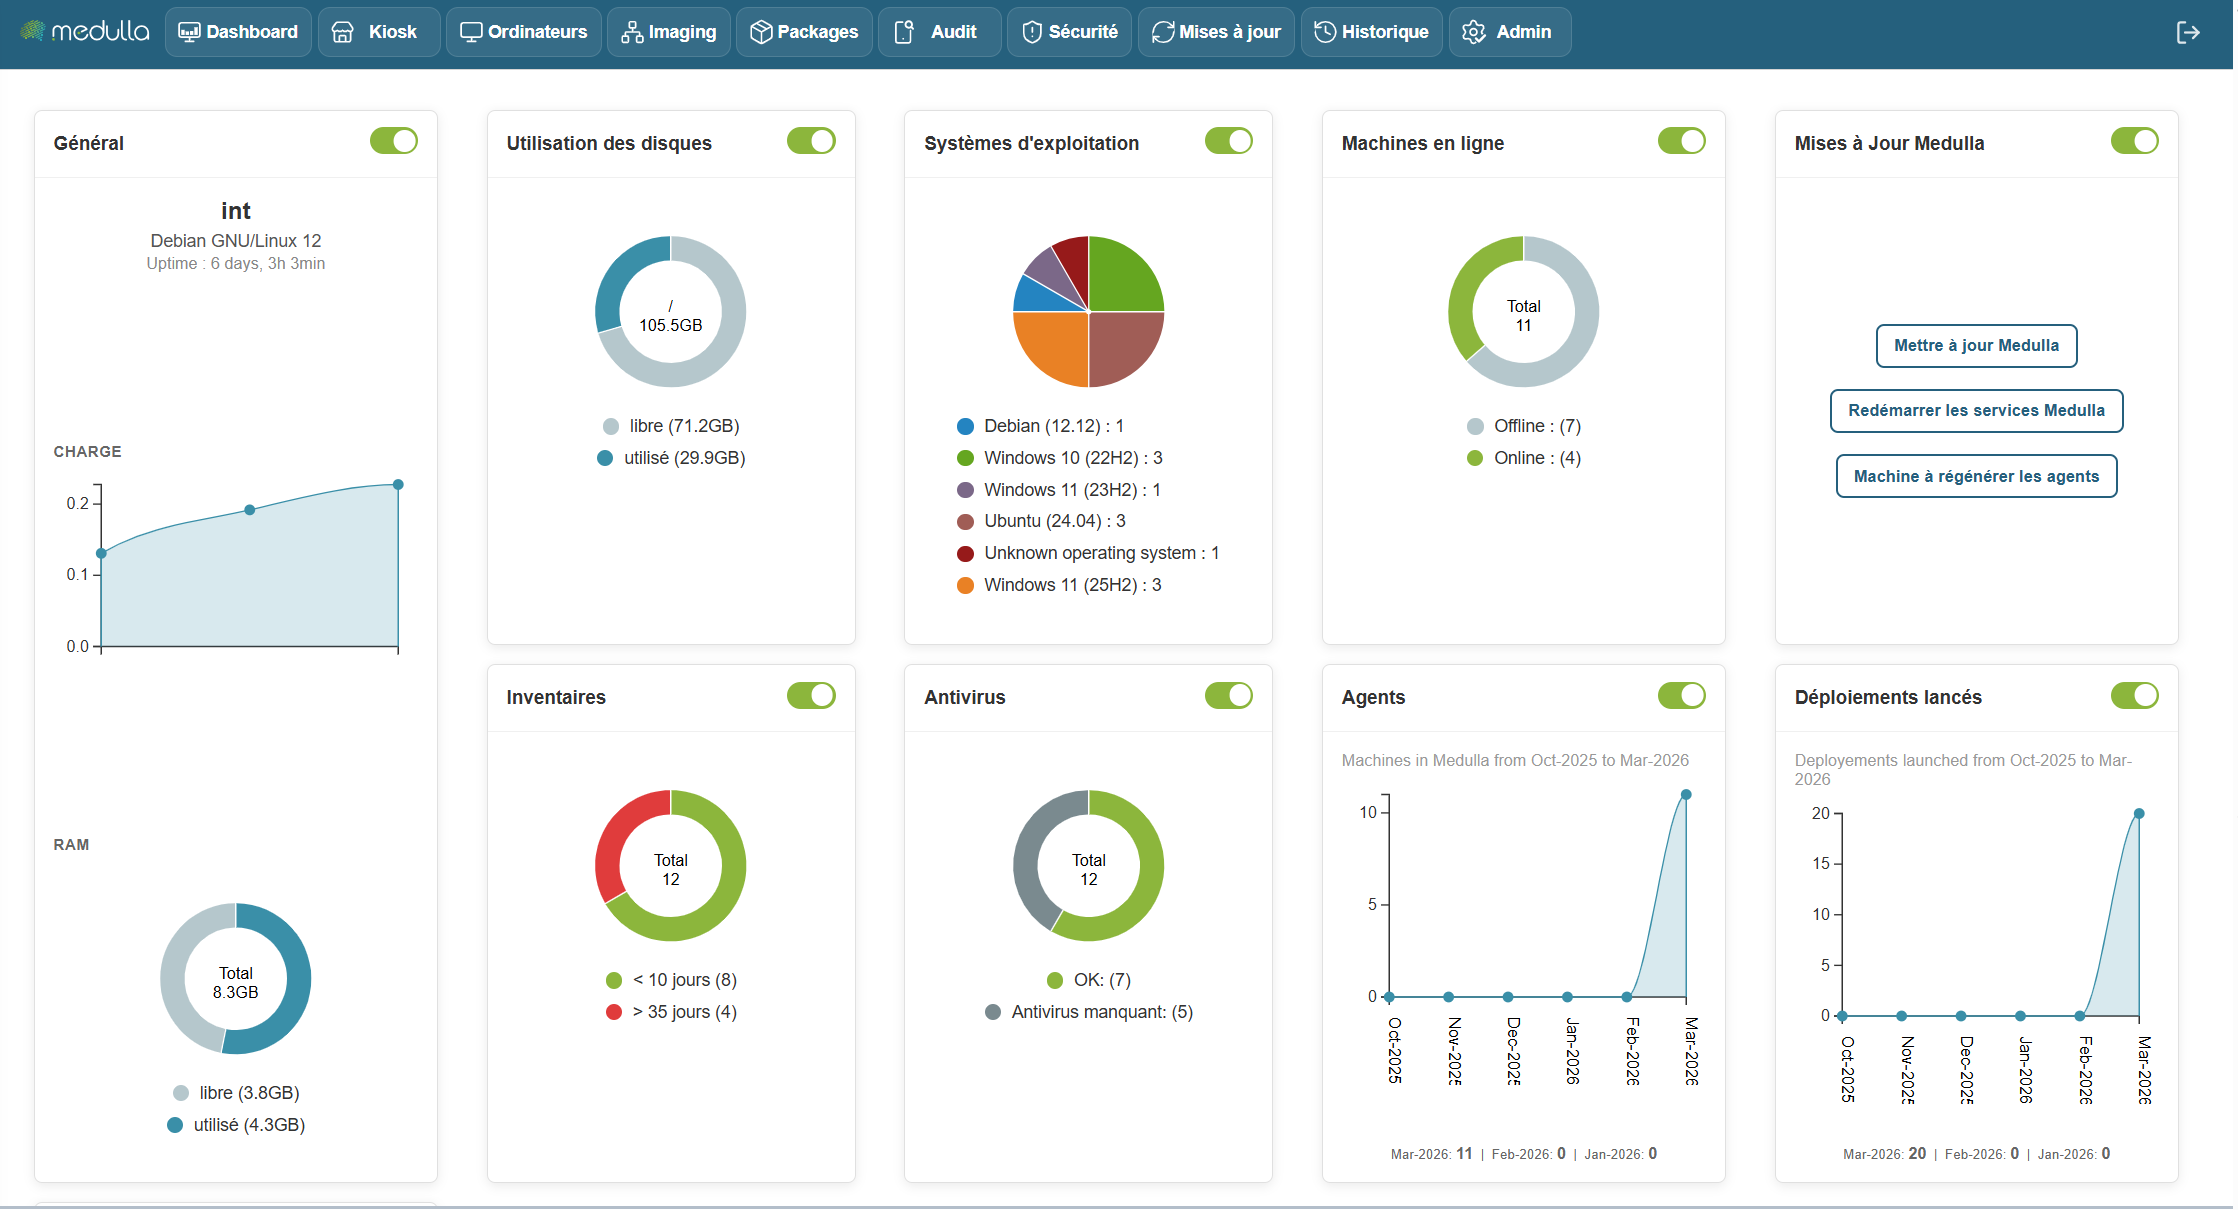
The Medulla dashboard allows you to monitor the real-time status of your infrastructure using customizable widgets. You can move, resize, and arrange the widgets as you wish. Each widget also has a button to show or hide it, depending on your needs.
Some widgets include dynamic charts for a better understanding of the data, updating in real time.
The following widgets allow you to create static groups directly so you can perform actions on them by clicking:
Inventory Widget, Operating System, Online Machines, Antivirus
Available Widgets
Widgets are organized by category and allow you to view various information about your infrastructure. Here are the main categories:
General
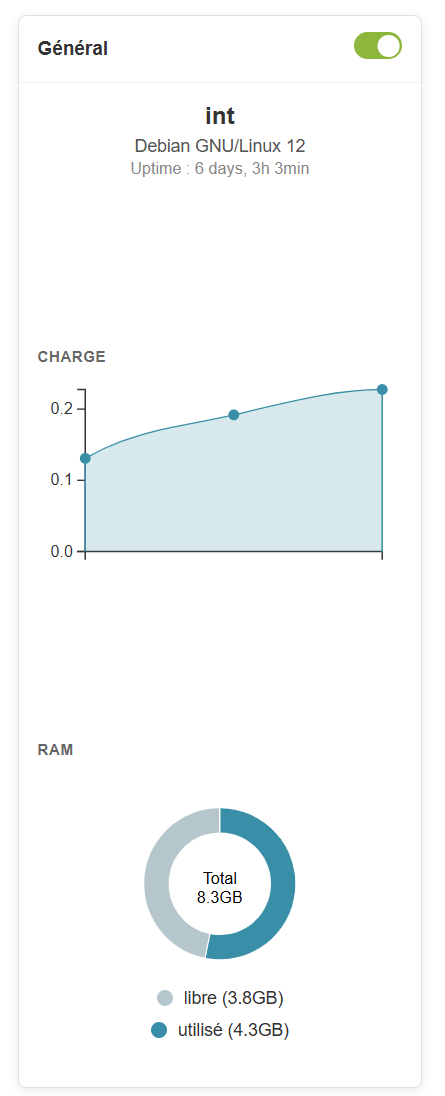
Information provided
-
Server name (example: devdemo.siveo.net on Debian GNU/Linux 12)
-
Uptime (time elapsed since the last system reboot)
-
TotalRAM, available RAM, and used RAM
Customization
This widget can be moved wherever you like, and it is resizable to display more or less information depending on your needs. You can also hide it using the toggle if you don’t need to see this information all the time.
Graphical representation
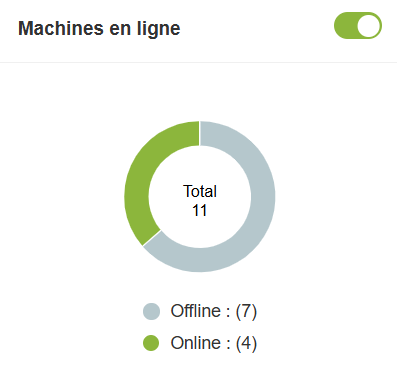
Online machines
Information provided
- Total number of online and offline machines.
Customization
This widget can be moved and resized as you like. The toggle allows you to show or hide it according to your preference.
Graphical representation
Pie chart to visualize the distribution of online and offline machines.
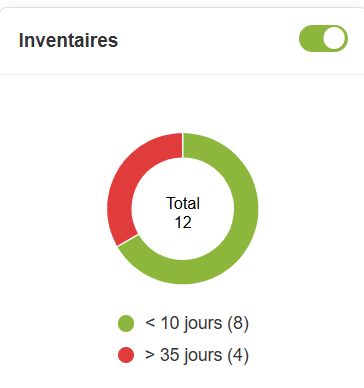
Inventory
Information provided
- Total number of items in the inventory and those that haven't been updated in over 10 days.
Customization
The widget is customizable and can be moved and resized. You can also hide it if you don’t need it.
Graphical representation
A pie chartdisplays the items in the inventory and highlights those requiring an update, providing an overview of the inventory’s status
In summary, the Dashboard is your centralized hub for managing and monitoring the status of your IT infrastructure. It is designed to be flexible and responsive, providing an overview of the performance of your machines and resources, while allowing you to react quickly to any alerts or necessary updates.
With this set of tools and graphical visualizations, the Dashboard gives you optimal control to manage your systems efficiently, while providing a clear and detailed view of your entire IT environment.
Adding a computer in Medulla
The Medulla agent can be downloaded from
http://medulla.domaine.lan/downloads/win/Medulla-Agent-windows-FULL-latest.exe
The Medulla agent can be installed manually or in silent mode:
"Medulla-Agent-windows-FULL-latest.exe /S"
The installation process will continue after the installation is complete; it will install all dependencies.
It is complete when the computer appears in Medulla in blue (online).

Medulla Agent
By default, we provide a global agent for Medulla (as explained in this post).Entity management per workstation is handled via GLPI.
However, if you wishto benefit, it is also possible to. This option, butif it meets your needs. To view agents by Entity:Entity Management
Creating your first package
Link to the complete package module:
https://docs.medulla-tech.io/books/medulla-guide-dutilisation-pas-a-pas/chapter/chapitre-8-packages
-
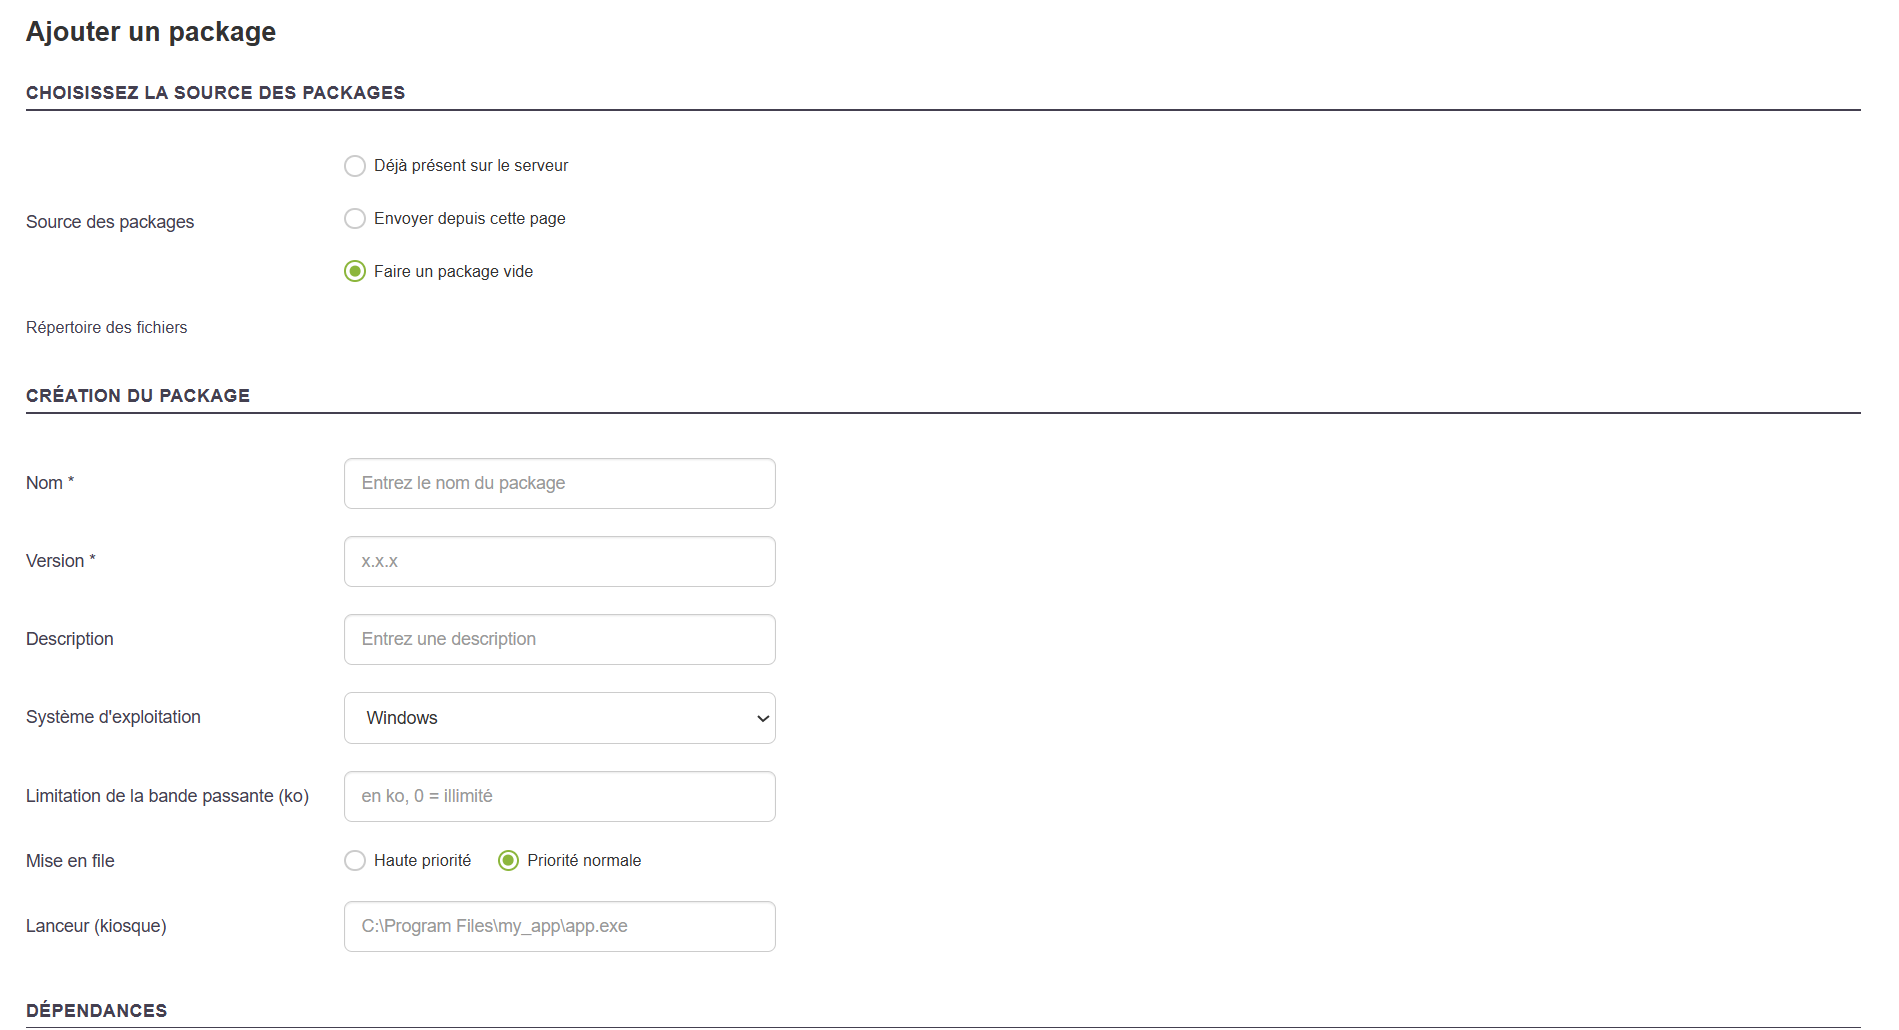
Creating a package involves defining an action (installation, uninstallation, script, etc.) that will be deployed on one or more workstations. The creation form allows you to precisely configure the package’s behavior and its execution options.
Here we will create a simple package, without adding a workflow, solely to install a simple application such as Notepad++.
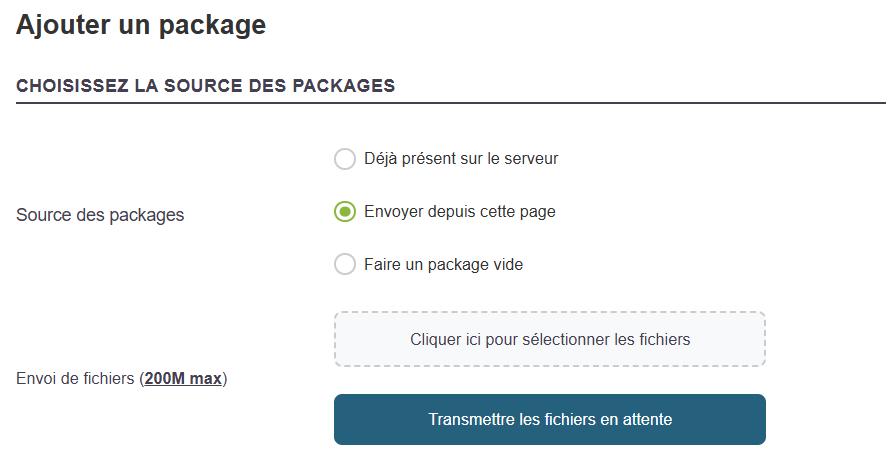
Next, select the source of the files to be used in the package. Four options are available:
- Already on the server
- Upload from this page
- Create an empty package
Use a Notepad++ installer, for example, then click:
-
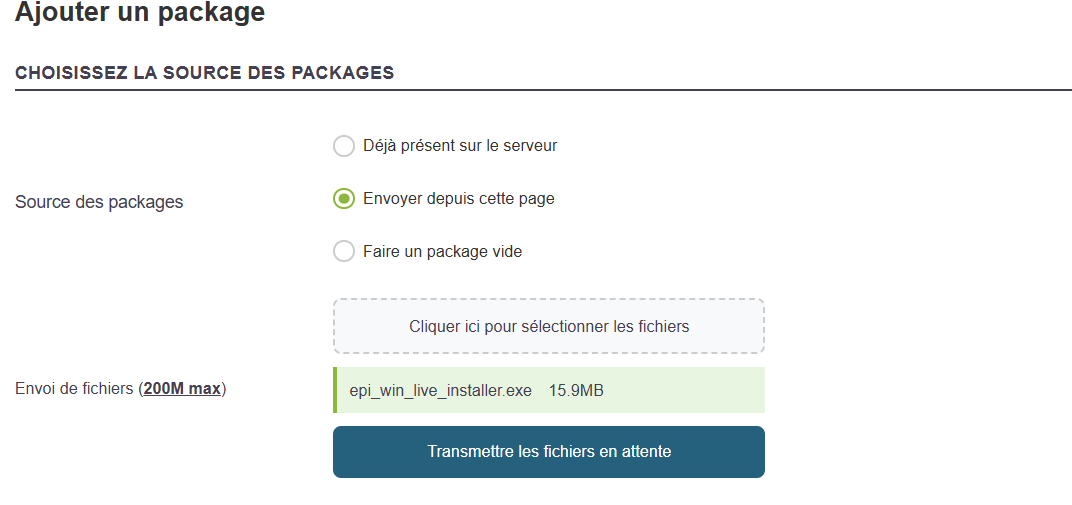
Upload from this page
Import the installation files directly from your computer. - Don’t forget to click “Send pending files.”
General information to provide
Share
SelectGlobal Packages to make the package visible across the entire platform, for all Entities.
Name
Give the package a descriptive name, for example: InstallNotepad
Special characters (except: _ and -) and accented characters are not allowed.
Version
Specify a version number, e.g., 1.0.0 or the Notepad++ version.
Description
Briefly summarize the purpose of the package.
Operating System
Select the target OS, for example:Windows.
Transfer method
Generally, use pushrsync (recommended): Server -> Rsync -> Machine.
Link to inventory
Enable this option to allow tracking of the package after installation via the GLPI inventory, if desired.
As you type the first three letters, autocomplete will activate.
Auto-completion is based on the existing inventory in GLPI.
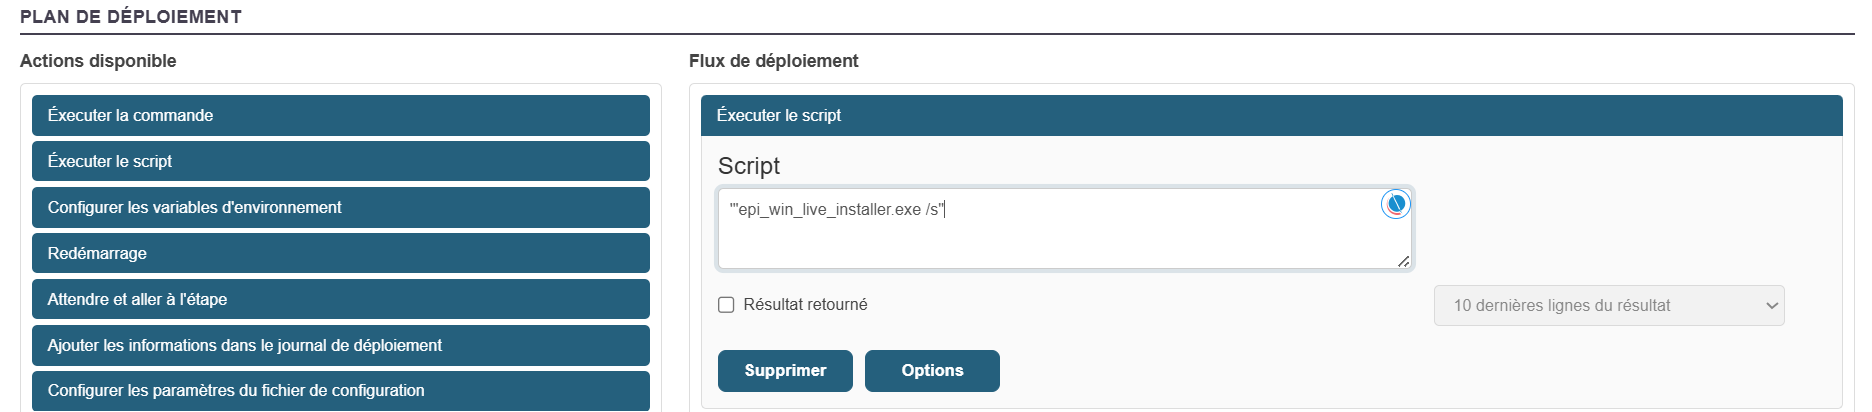
You can add custom actions to the package, depending on your needs:
Here, our wizard will automatically determine, based on rules, the correct command to run the installation file to install the application in silent mode.
-
Run a command or script (When adding a file to the "Package Source" package, our wizard automatically adds the correct command to run the setup file and silently install the application)
Once all sections have been configured and verified
ClickAddto save the package.
It will then be accessible from the "Packages > Package List" library for use in a deployment.
It will temporarily appear in the "Pending Packages List" if you have relays. This list shows the progress of the package synchronization across all your relays, if you have any.
For a complete guide on creating packages: Complete Package Creation
Package deployment
Here we will deploy the package created earlier.
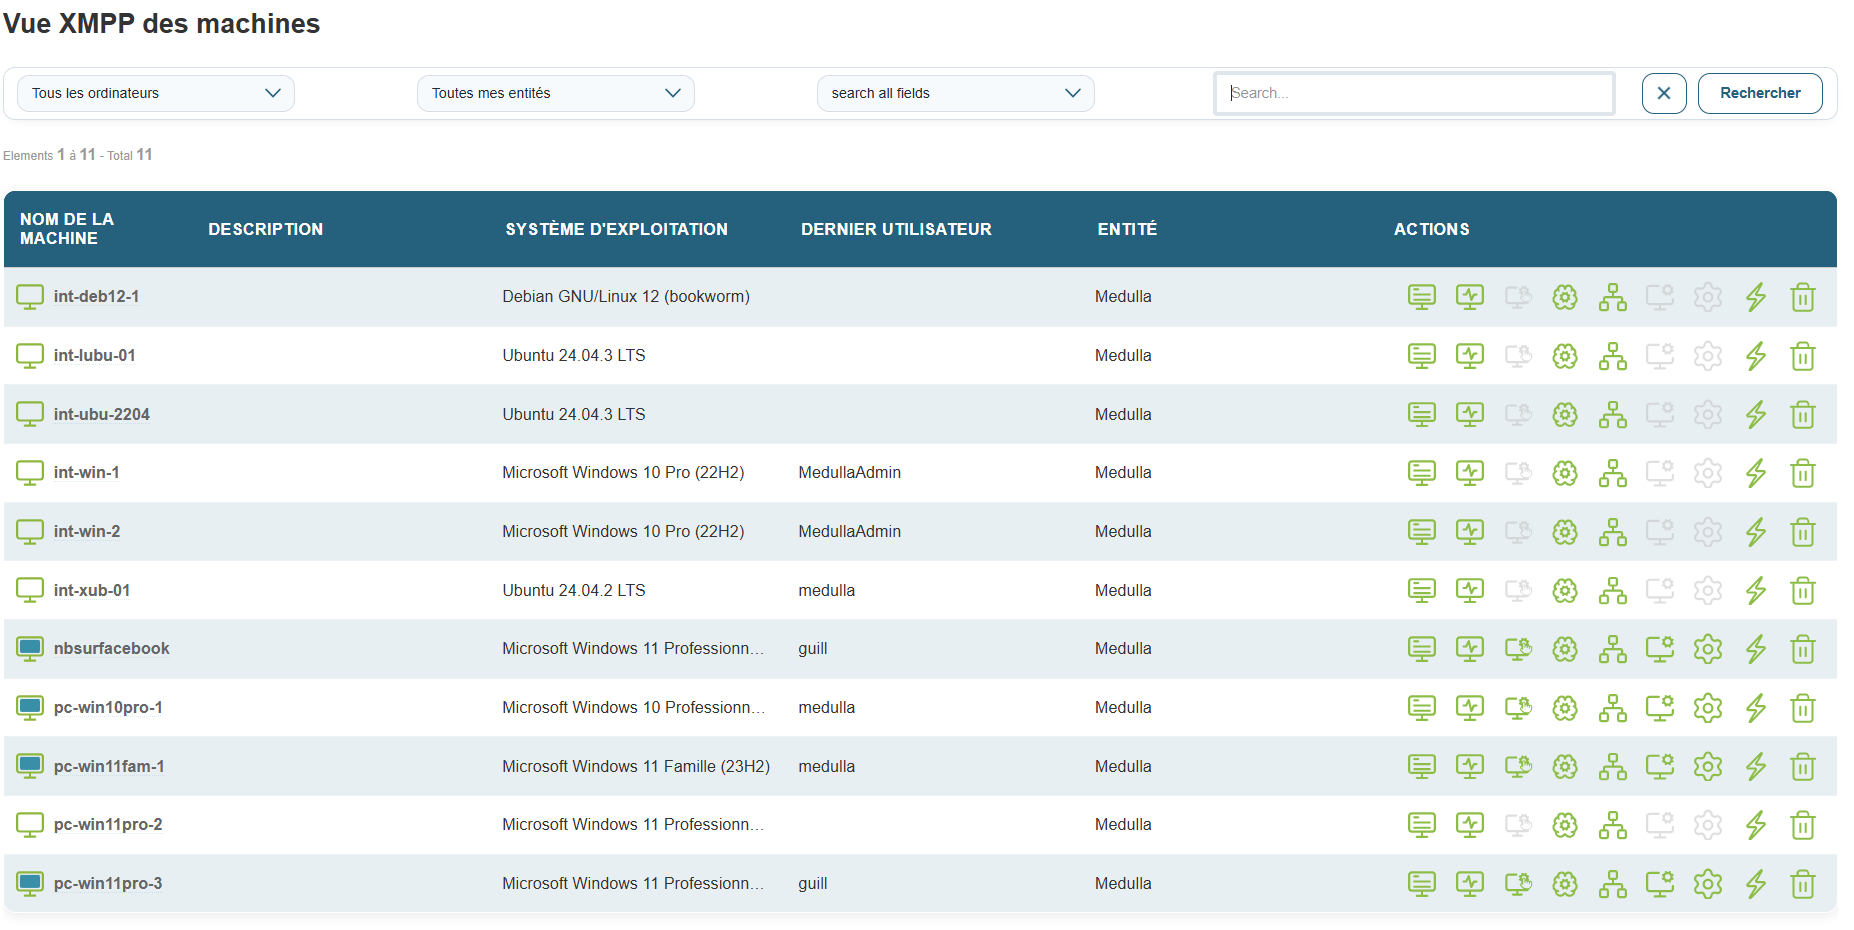
Go to the Computer view and select a workstation. Click the deployment button:
![]() Software Deployment - Remote software installation or update.
Software Deployment - Remote software installation or update.
Find the new package you created earlier in the package list and click the instant deployment icon:
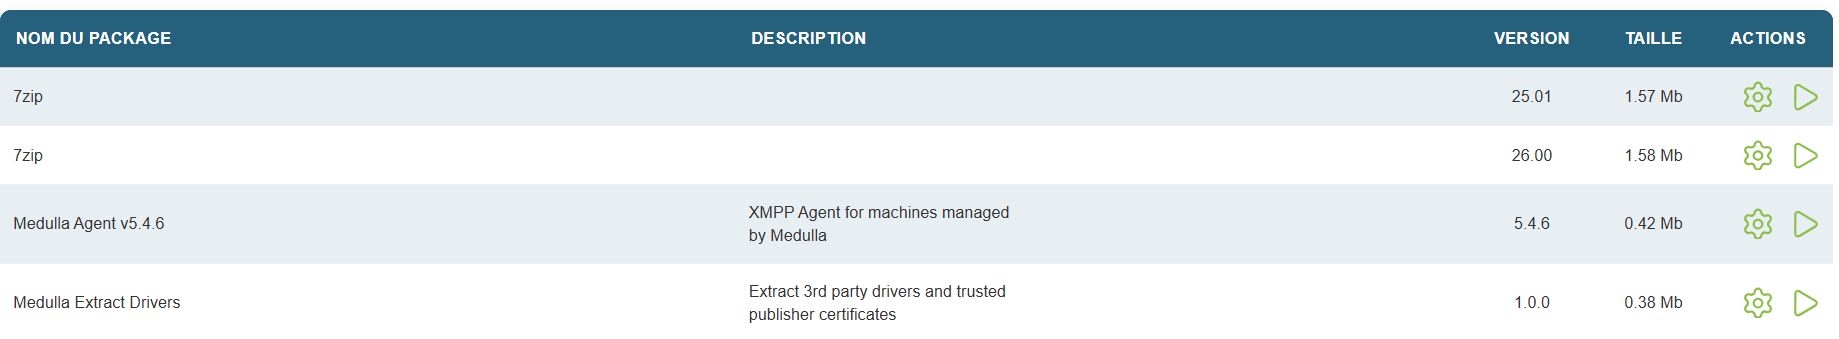
![]() Launch Action - Deploys the package to the previously selected workstation.
Launch Action - Deploys the package to the previously selected workstation.
When you start a deployment, you are automatically redirected to the Deployment Audit page.
Otherwise, go to the "Audit" view; a new row will appear, allowing you to track the progress of the deployment you just performed.
See the page: Deployment Audit
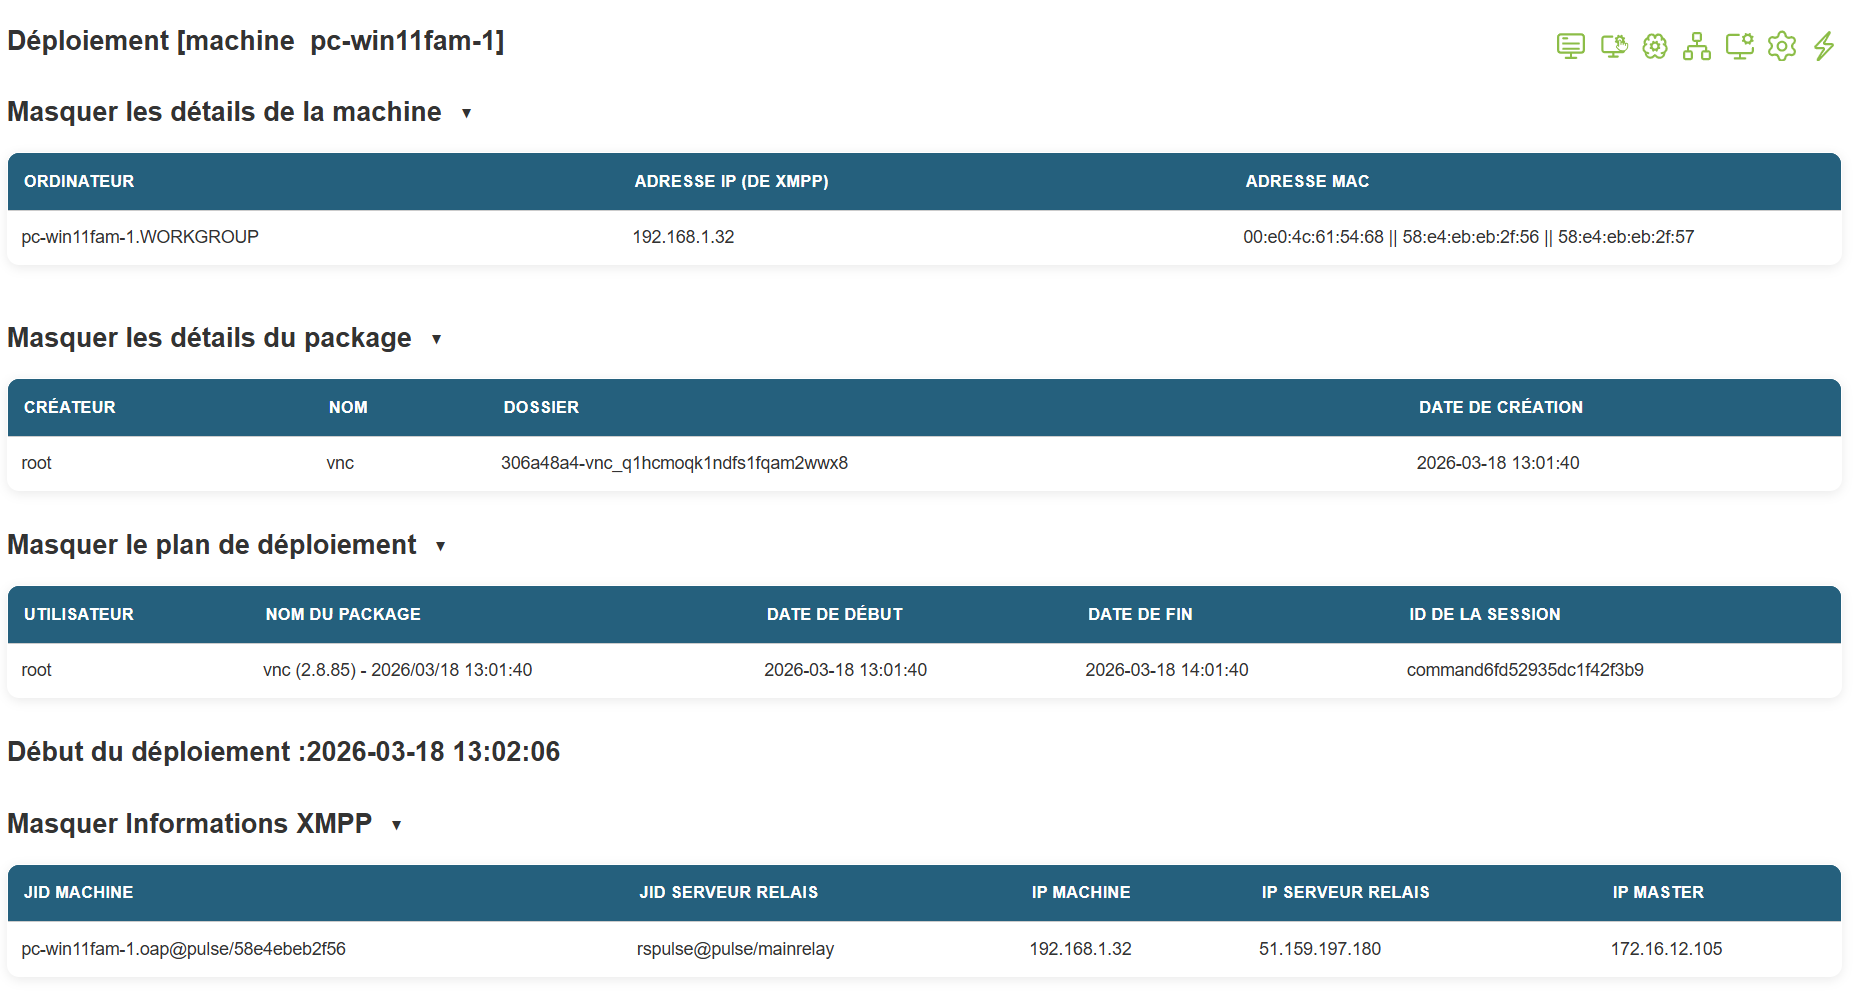
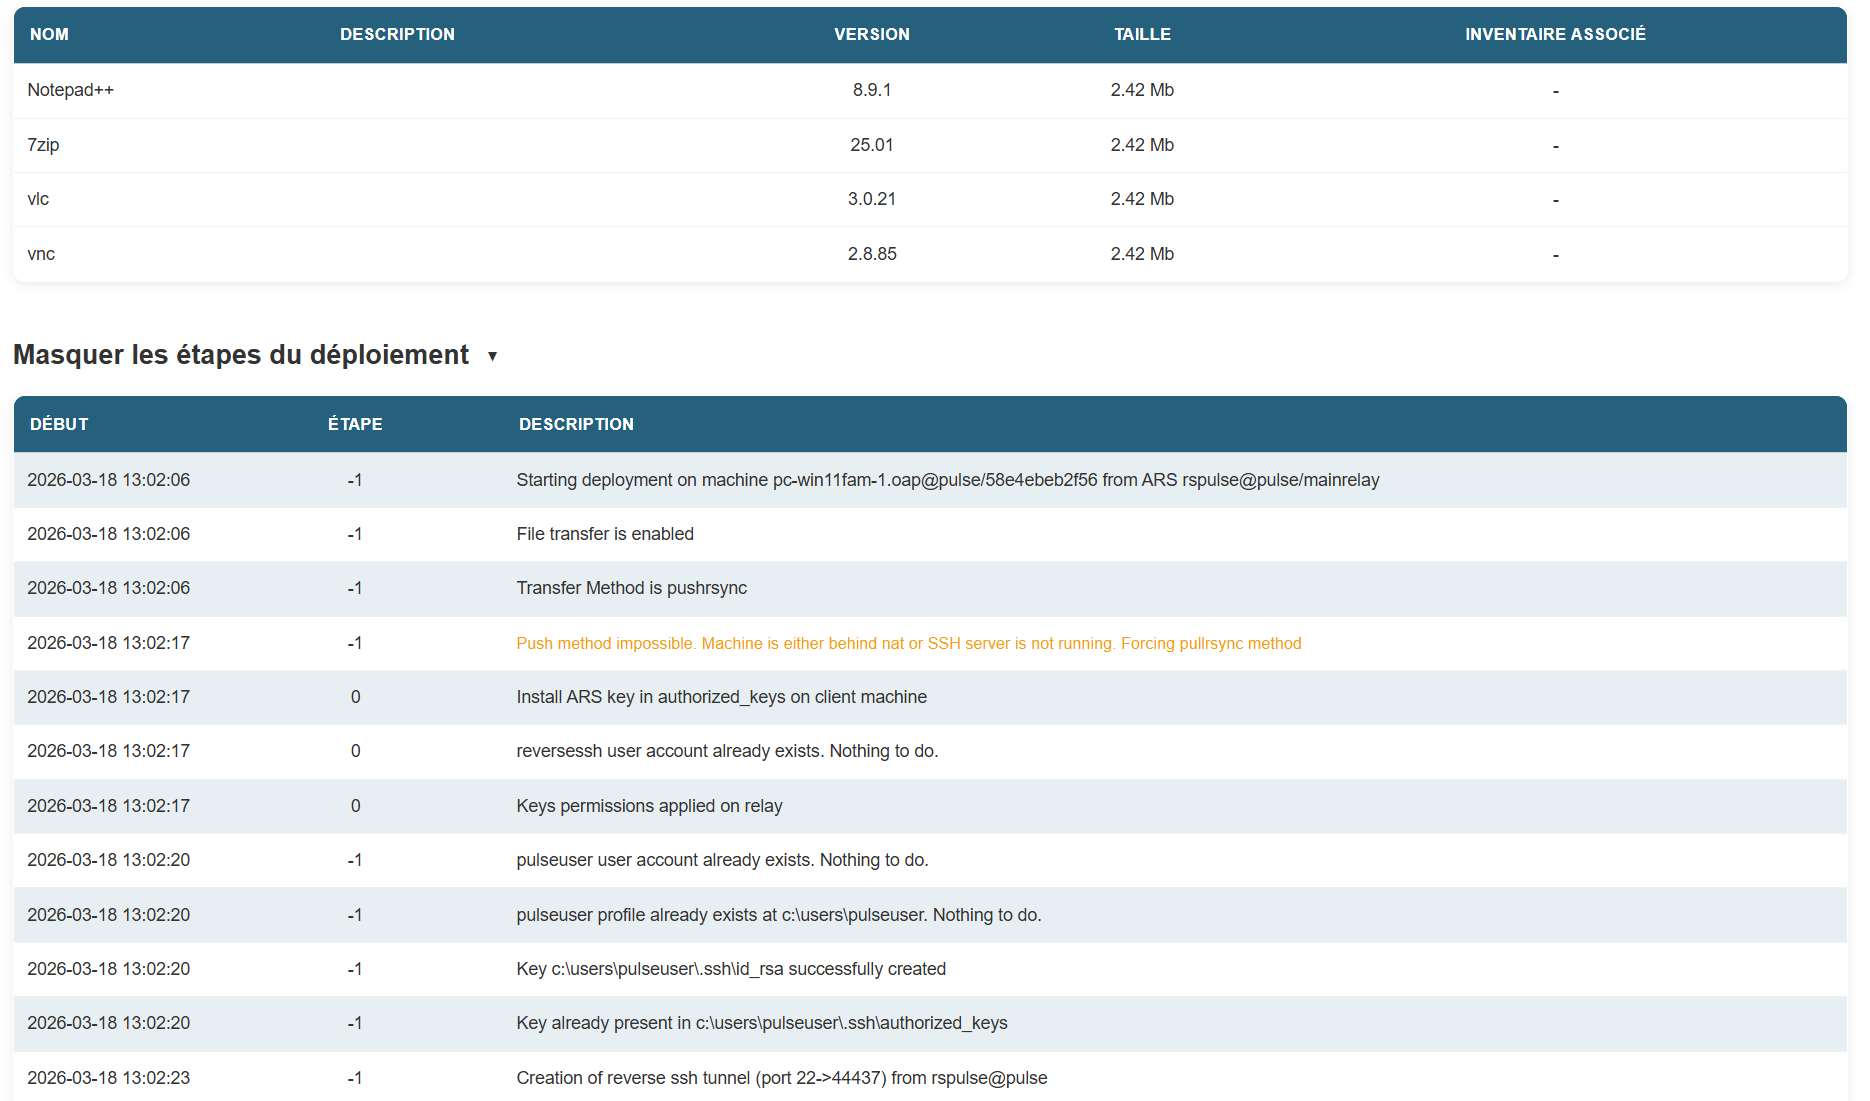
Track the audit of a deployment
Would you like to view the audit of a deployment? Go to the Audit view in the navigation bar.
Search for your deployment by name, which includes the deployment start date and time as well as other useful information.
On the row for your deployment’s audit, on the far right, you’ll find the button that lets you view the full deployment audit: ![]()
You will then be redirected to a new page that includes all the details of the deployment: