Medulla Step-by-Step User Guide
Get started with Medulla with ease. This visual guide walks you step by step through the tool’s daily use, whether you’re new to Medulla or want to take your skills to the next level.
With clear explanations, screenshots, practical examples, and essential reminders, explore each feature with confidence—free of unnecessary jargon, but with the efficiency you need.
- Chapter 1: Table of Contents
- Chapter 2: Getting Started with Medulla
- Chapter 3: Kiosk
- Chapter 4: Entities
- Chapter 5: Computers
- Computers
- All groups
- Network Wake-up
- List of uninventoried machines
- Monitoring alerts
- Custom Quick Action
- Delete a computer
- Chapter 6: Imaging I
- Imaging
- Manage masters
- Manage startup services
- Default startup menu
- Post-imaging scripts
- How Imaging Works
- Chapter 7: Imaging II
- Imaging profiles
- Add a profile
- List of profiles
- Imaging Configuration
- Sysprep Response File Manager
- Imaging groups
- Chapter 8: Packages
- List of available packages
- Add a new package
- Packages on the waiting list
- List of deployment rules
- Add a custom rule
- Launch a deployment and monitor its execution
- Chapter 9: Audit
- Chapter 10: Updates
- How the WSUS update module works.
- Entity Compliance
- Entity Compliance Tracking
- Manage update lists
- Upgrading to major OS versions.
- Automatically approve whitelisted updates.
- Microsoft Product Validation
- Chapter 11: Backup
- Chapter 12: History
- Chapter 13: Admin
- Chapter 14: MDM
- Chapter 15: CVE
- CVE Module (Concept and Principles)
- CVE operation
- Results view by machine
- Results view by entity
- Results view by group
- View all CVEs
- CVE settings.
- Case Studies
Chapter 1: Table of Contents
Table of Contents
Table of Contents
Chapter 1: Table of Contents
Getting Started with Medulla
The Kiosk Module
Understanding Entities and Users
Managing computers
- Computers
- All Groups
- Wake-up Network
- List of uninventoried machines
- Monitoring alerts
- Quick Customization
Imaging – Create and deploy images
- Imaging
- Manage masters
- Manage startup services
- Default boot menu
- Post-imaging scripts
- Imaging profiles
- List of profiles
- Add a profile
- Imaging configuration
- Sysprep response file manager
- Imaging groups
Package deployment
- List of available packages
- Add a new package
- Packages awaiting deployment
- List of deployment rules
- Add a custom rule
- Start a deployment and monitor execution
Logs, monitoring, and auditing
Manage updates
- How the WSUS update module works
- Entity compliance
- Compliance monitoring
- Manage update lists
- Upgrading major OS versions
- Automatically Approve Whitelisted Updates
Backups
History
Administration
MDM
CVE - View Security Vulnerabilities in Your Fleet
- CVEModule (Concept and Principles)
- CVE operation
- Results view by machine
- Results view by entity
- Results view by group
- View of all CVEs
Case studies
Chapter 2: Getting Started with Medulla
How to log in to Medulla
To access Medulla’s features, you must log in with your credentials. This step ensures the security of your data and personalized access.
Login Steps
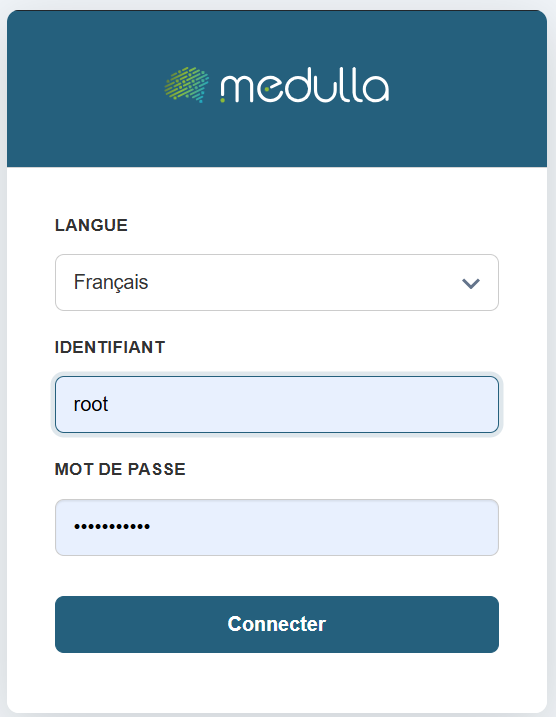
Choose your language
On the login page, select your preferred language from the dropdown menu. The default language is French, but you can change it if necessary.
Enter your username
Enter the username or email address you provided when creating your account.
Enter your password
In the Password field, enter your personal password. Make sure it is spelled correctly: uppercase and lowercase letters are distinguished.
Confirm the login
Click the "Log In" button to access your user account.
For security reasons, avoid saving your password on shared devices.
If you have trouble logging in, contact your organization’s technical support
Dashboard
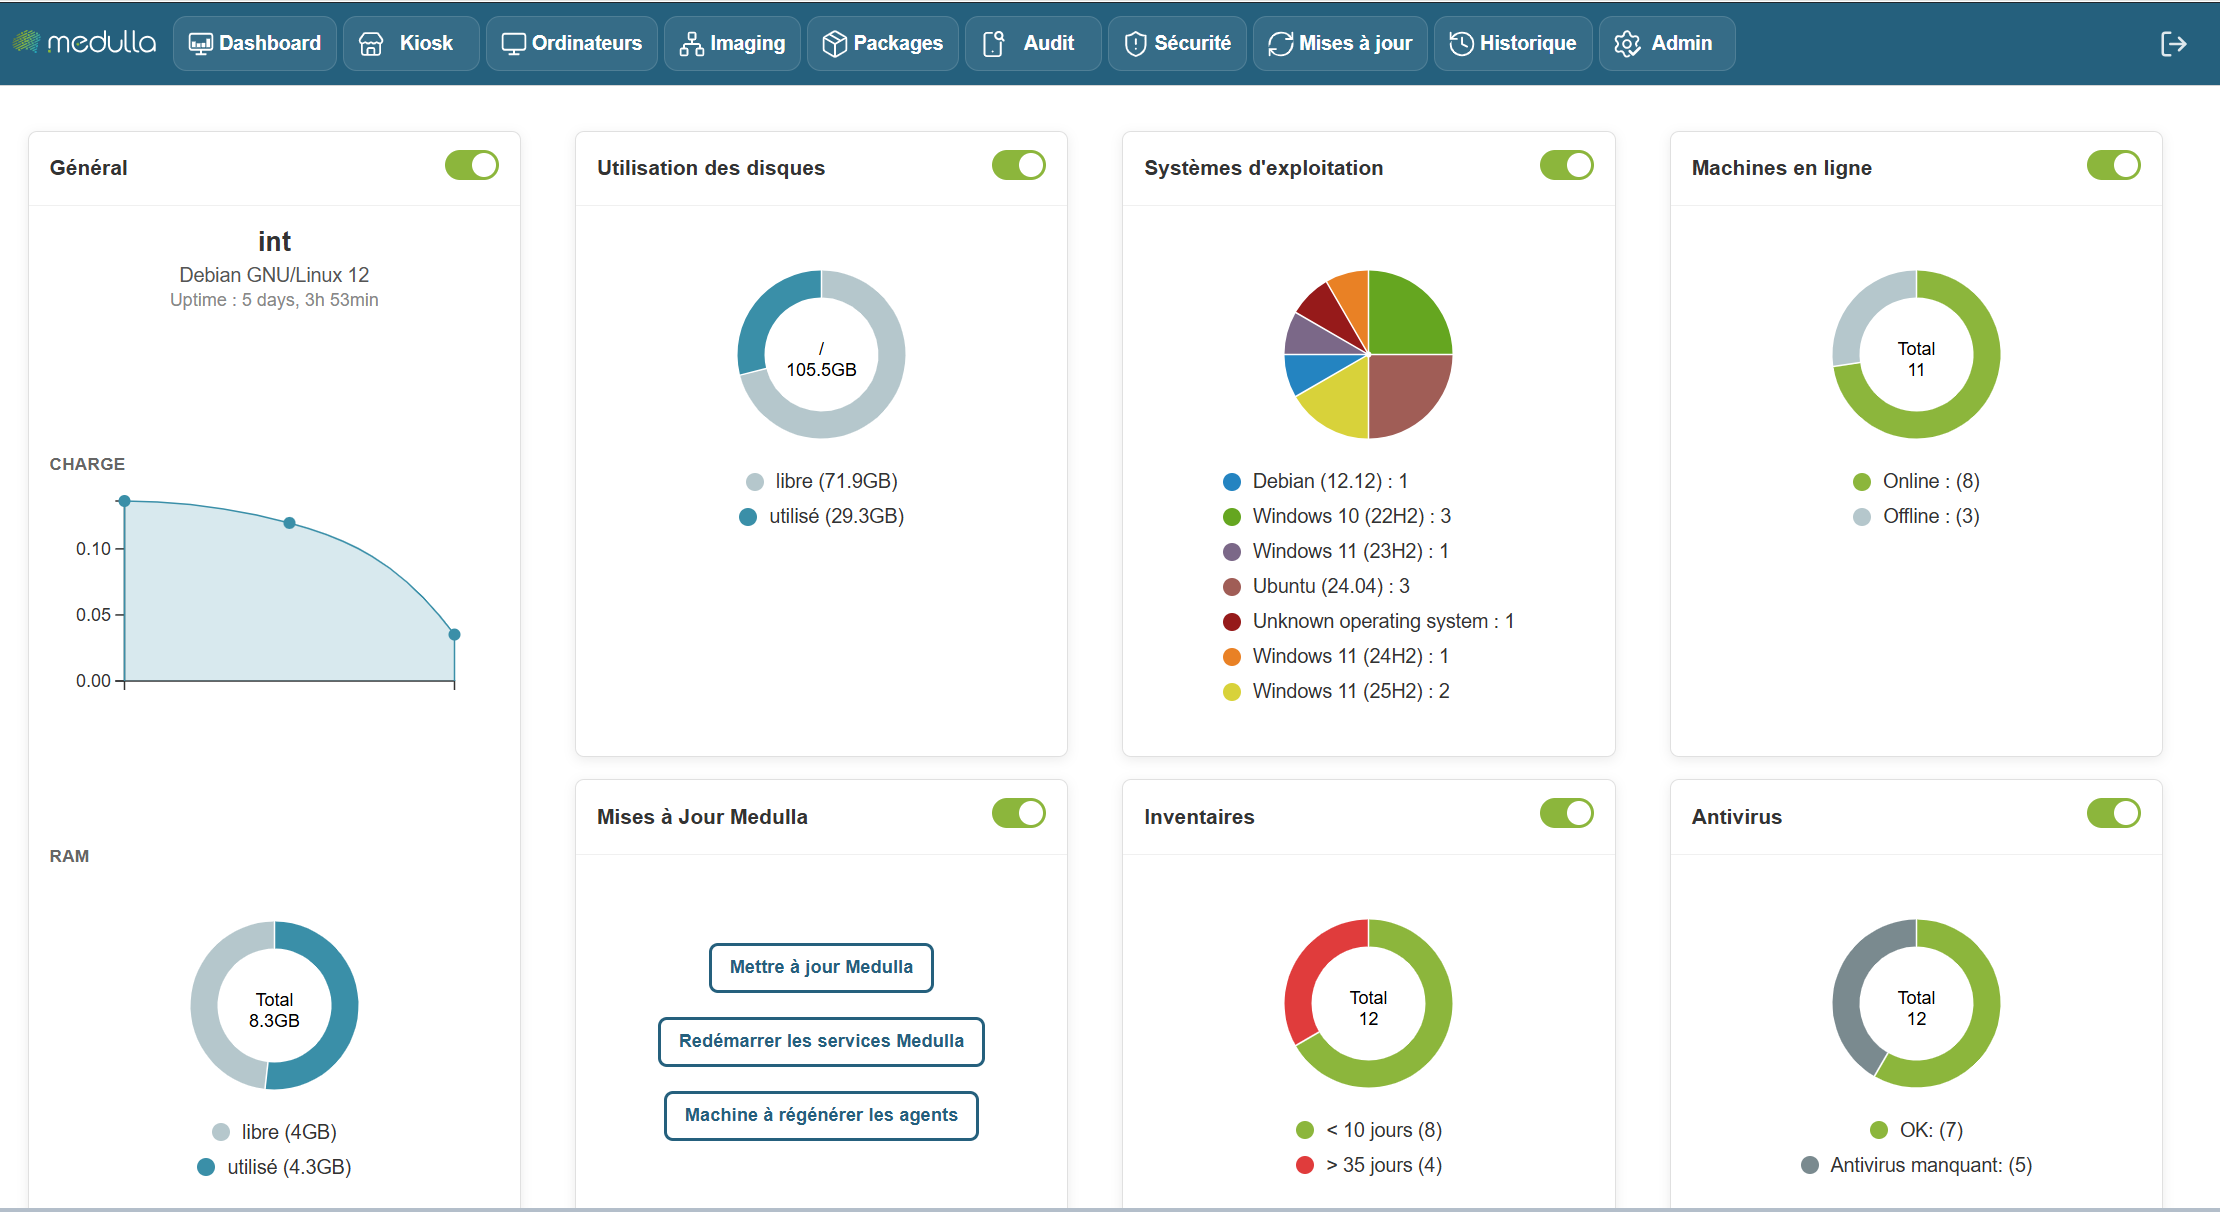
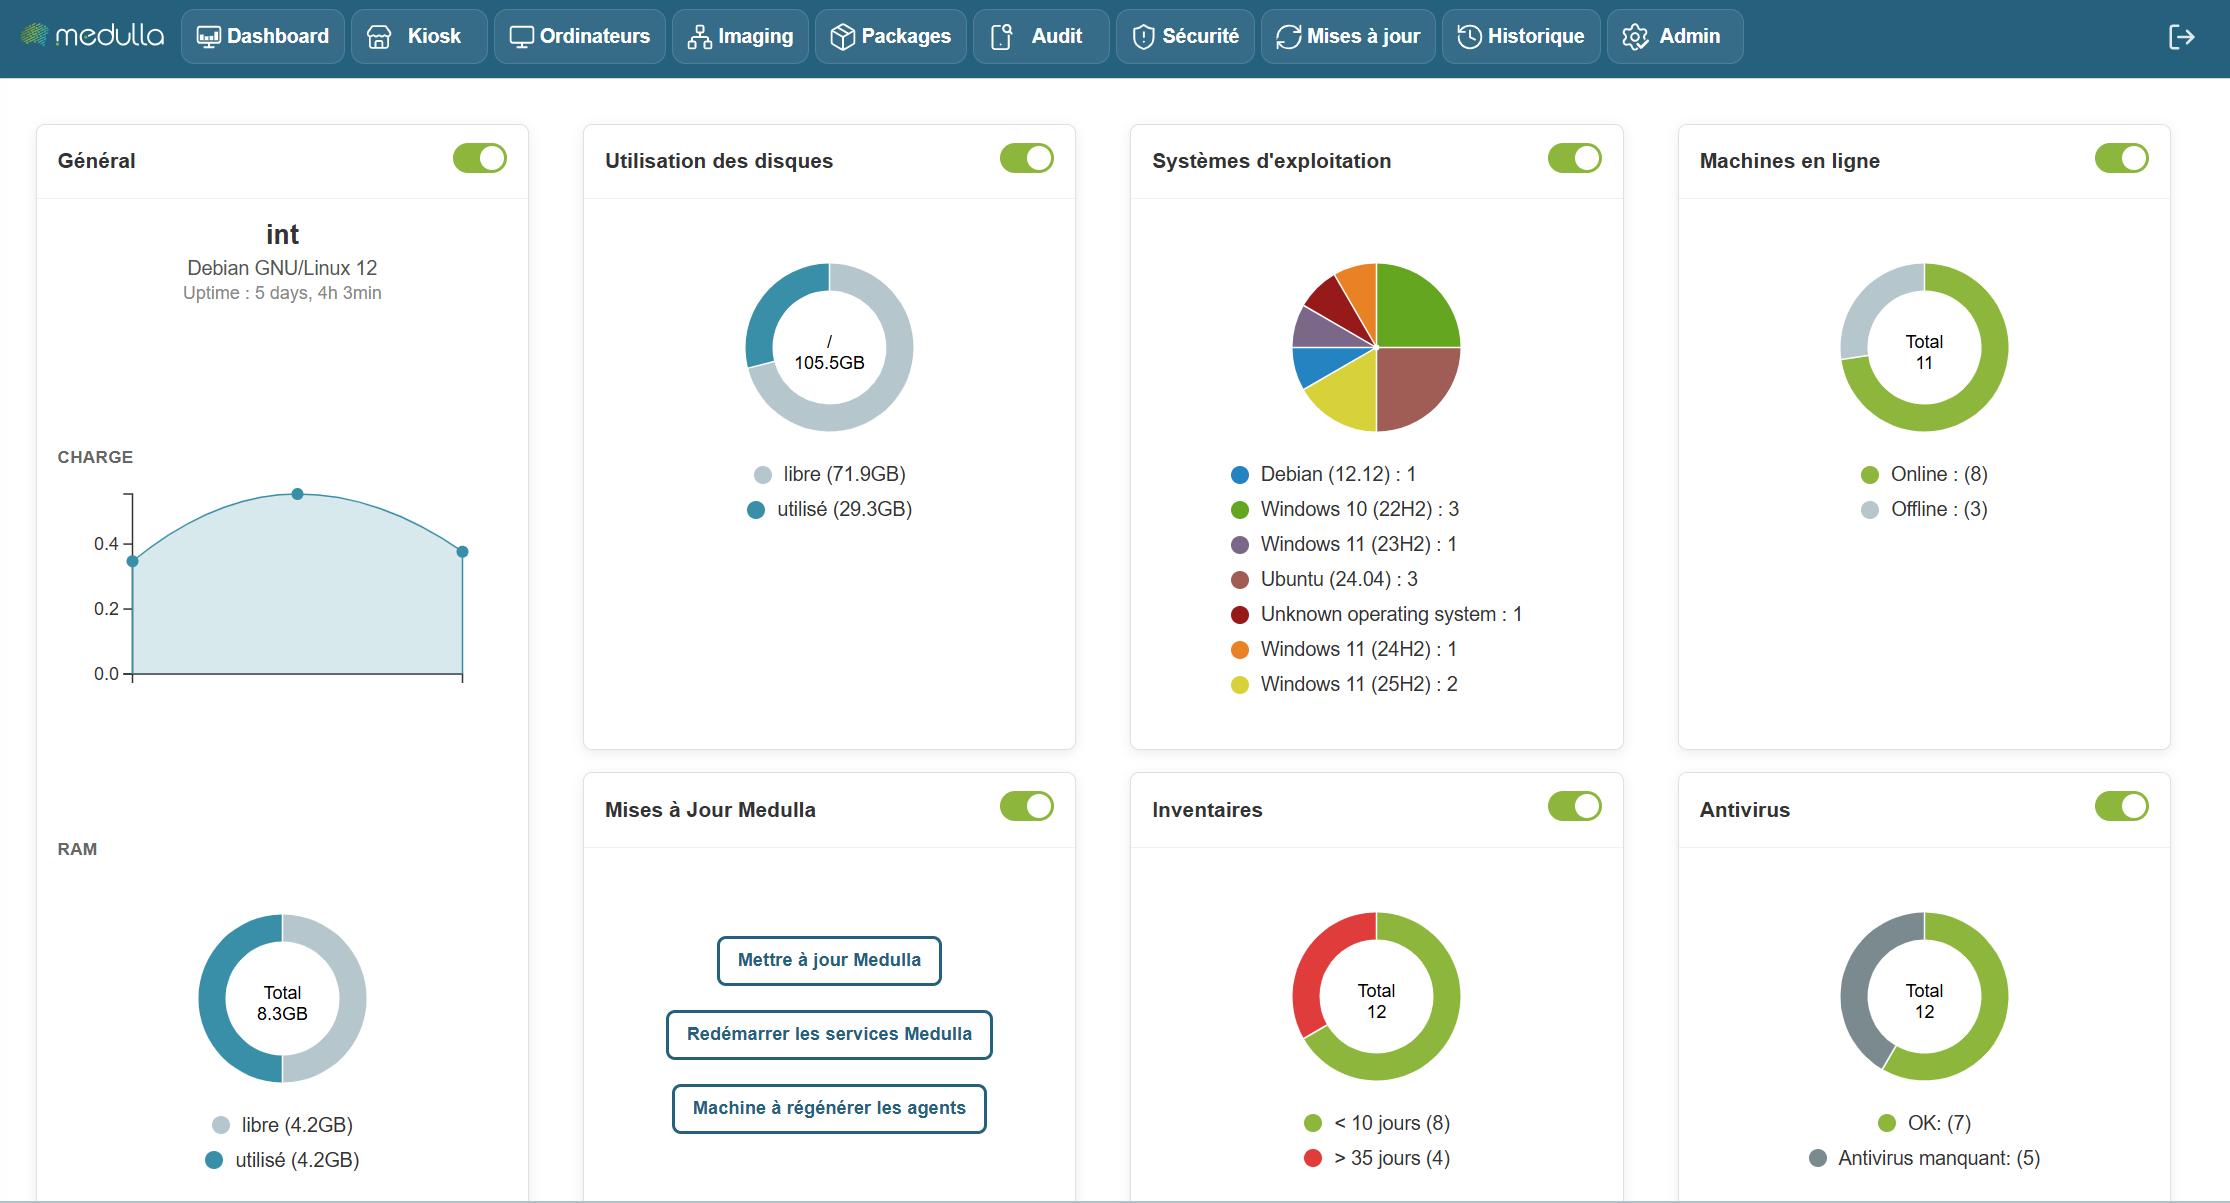
The Medulla dashboard allows you to monitor the real-time status of your infrastructure using customizable widgets. You can move, resize, and arrange the widgets as you wish. Each widget also has a button to show or hide it, depending on your needs.
Some widgets include dynamic charts for a better understanding of the data, updating in real time.
The following widgets allow you to create static groups directly so you can perform actions on them by clicking:
Inventory Widget, Operating System, Online Machines, Antivirus
Available Widgets
Widgets are organized by category and allow you to view various information about your infrastructure. Here are the main categories:
General
Information provided
-
Server name (example: devdemo.siveo.net on Debian GNU/Linux 12)
-
Uptime (time elapsed since the last system reboot)
-
TotalRAM, available RAM, and used RAM
Customization
This widget can be moved wherever you like, and it is resizable to display more or less information depending on your needs. You can also hide it using the toggle if you don’t need to see this information all the time.
Graphical representation
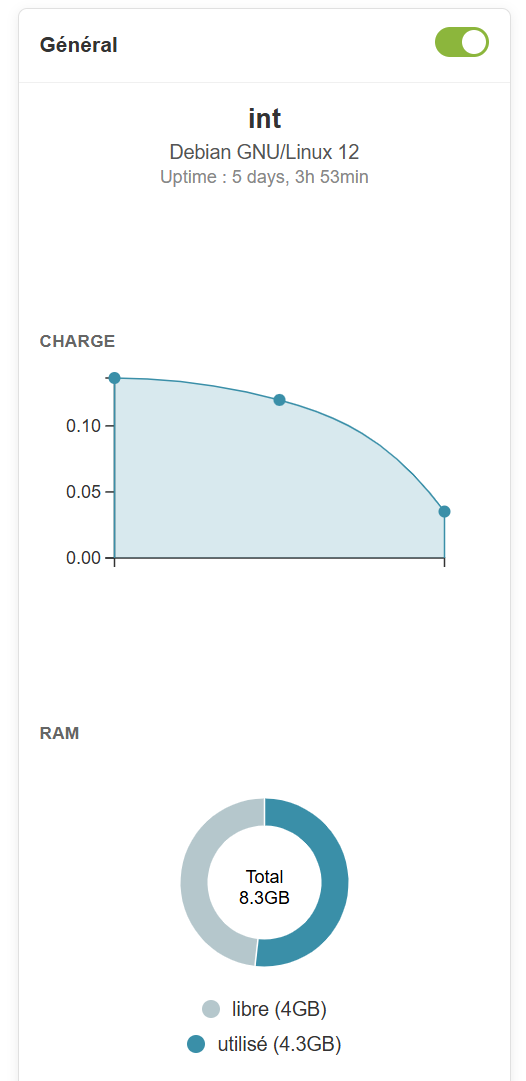
Online machines
Information provided
- Total number of online and offline machines.
Customization
This widget can be moved and resized as you like. The toggle allows you to show or hide it according to your preference.
Graphical representation
Pie chart to visualize the distribution of online and offline machines.
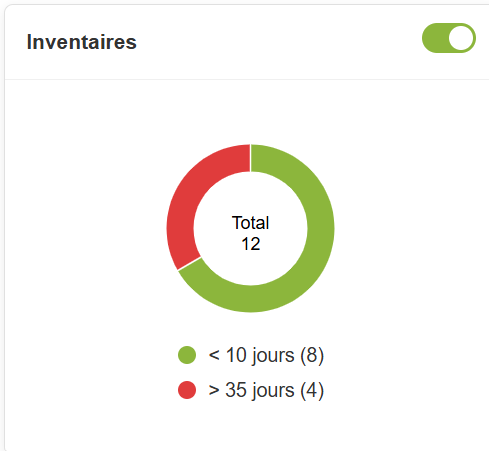
Inventory
Information provided
- Total number of items in the inventory and those that haven't been updated in over 10 days.
Customization
The widget is customizable and can be moved and resized. You can also hide it if you don’t need it.
Graphical representation
A pie chartdisplays the items in the inventory and highlights those requiring an update, providing an overview of the inventory’s status
In summary, the Dashboard is your centralized hub for managing and monitoring the status of your IT infrastructure. It is designed to be flexible and responsive, providing an overview of the performance of your machines and resources, while allowing you to react quickly to any alerts or necessary updates.
With this set of tools and graphical visualizations, the Dashboard gives you optimal control to manage your systems efficiently, while providing a clear and detailed view of your entire IT environment.
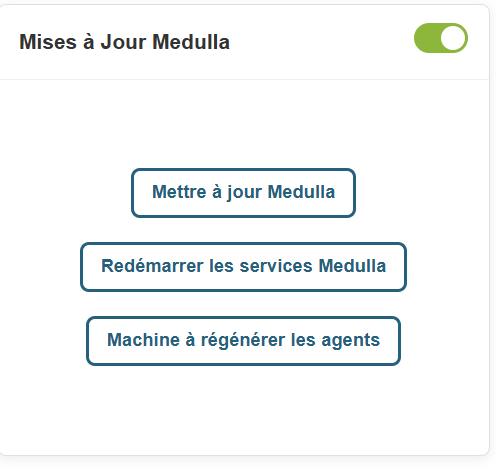
Updating Medulla via the interface
In the Medulla dashboard, an "Update Medulla" widget is available:
This widget allows you to:
- Check for Medulla version updates
- View Medulla version updates;
- Install Medulla version updates
- Restart Medulla services after updates
- Restart Medulla agents after updates
On the widget, click the Check for Updates button.
A popup will appear asking you to confirm the update, with backup requirements.
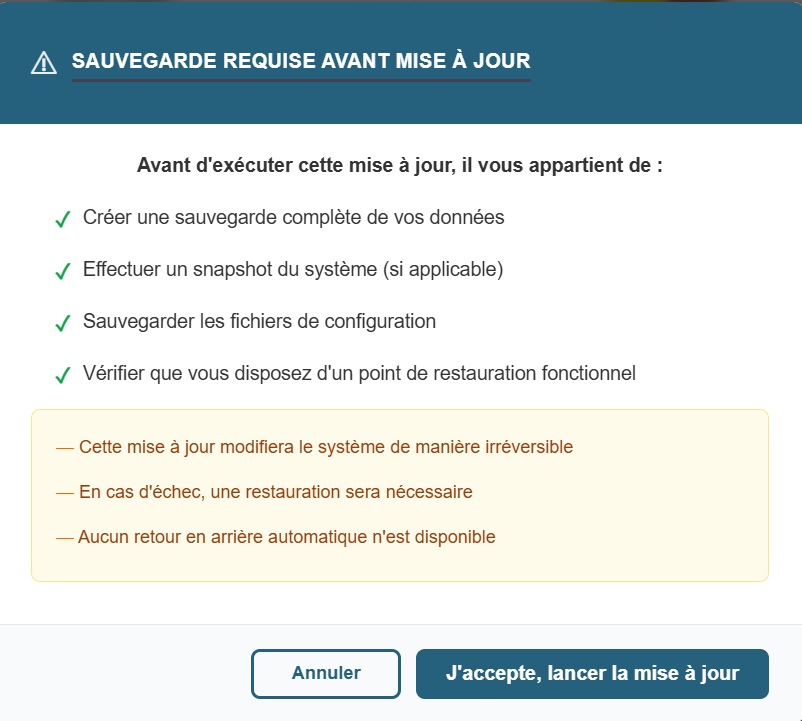
There are 2 buttons on the popup
- Cancel
- I Accept, Start Update.
When you click Start Update, the pop-up displays:
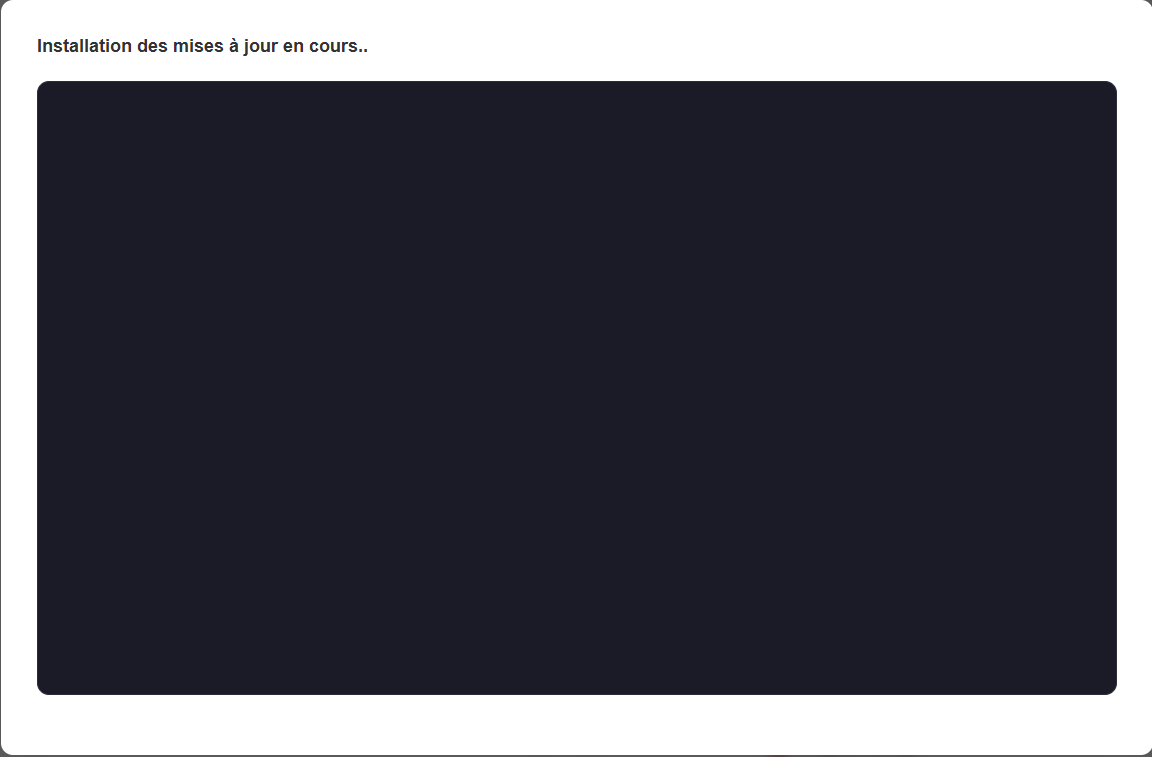
Once the update is complete, Medulla will force a logout from the interface.
Once you reconnect to Medulla, still within the Updates widget, please click the "Restart Medulla Services" button.
The session will be terminated; you will then need to reconnect to the interface.
Click the "Regenerate Agents" button.

The page will then display the following screen:
Chapter 3: Kiosk
Kiosk
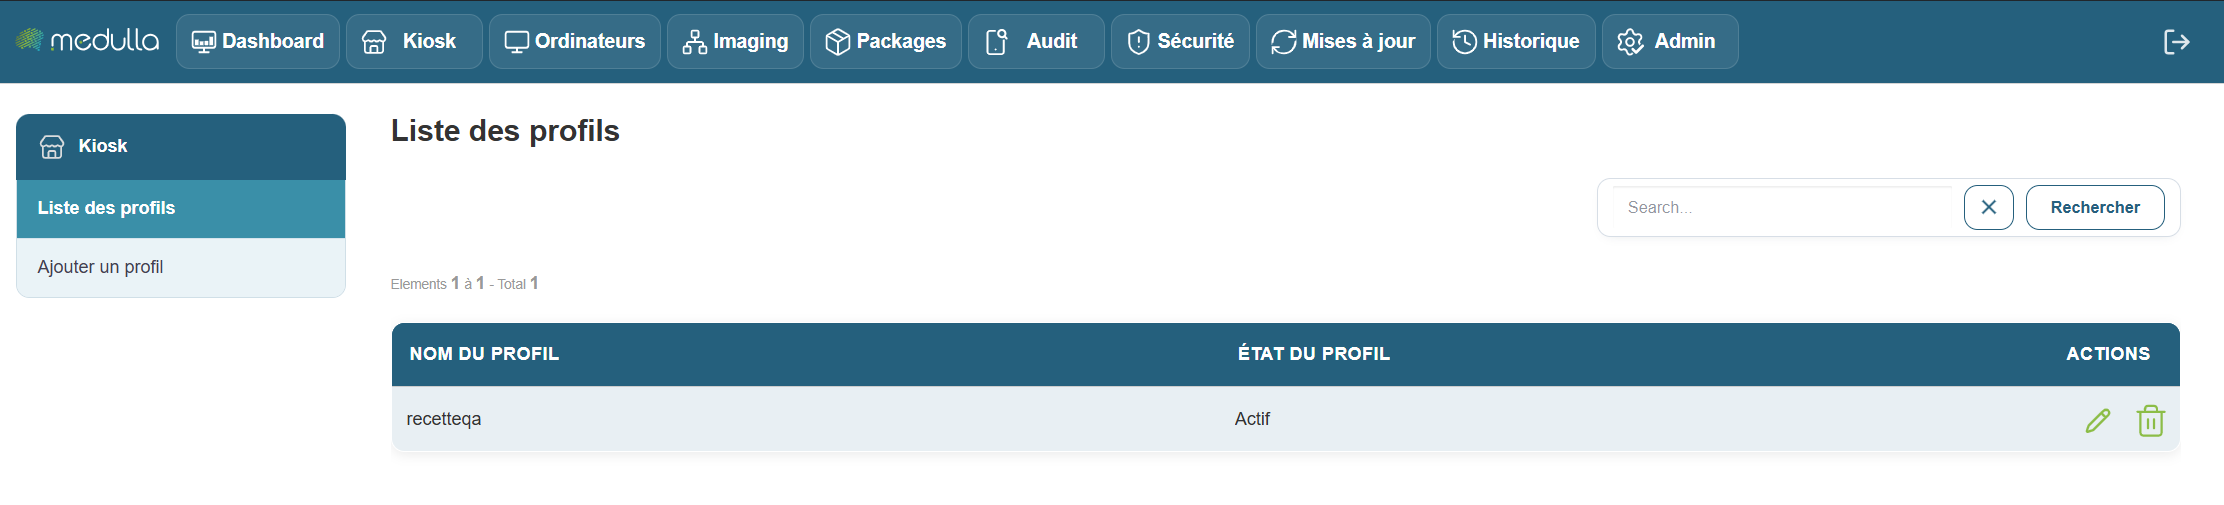
When you arrive at theKiosk interface’s main page, you are immediately directed to the Profile List section, located in the center of the page. This is the first thing you will see upon arriving at this page.
The Profile List Section
This section is located in the center of the screen and displays all user profiles that have already been created. Depending on the number of existing profiles, you will see different information:
Existing Profiles
If profiles have already been created, each profile will appear in a list with information such as:
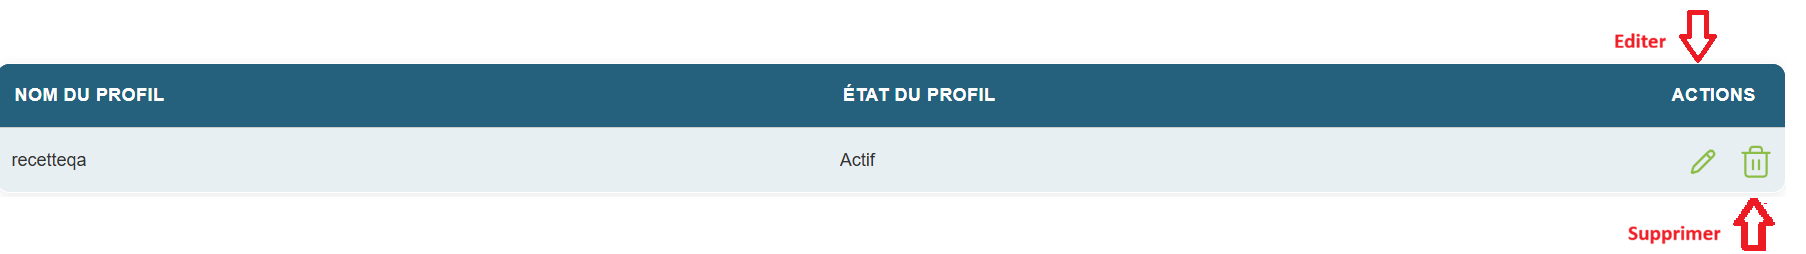
- Profile Name: The name given to the profile when it was created.
- Profile Status: Indicates whether the profile is Active or Inactive.
- Management options: You can edit or delete a profile if necessary.
No profiles created
Don’t worry—creating a profile is quick and easy. Follow the steps below to add a new profile in Kiosk. We’ll walk through it together, step by step.
Add a profile

To create a new profile, start with the section on the left side of the page.
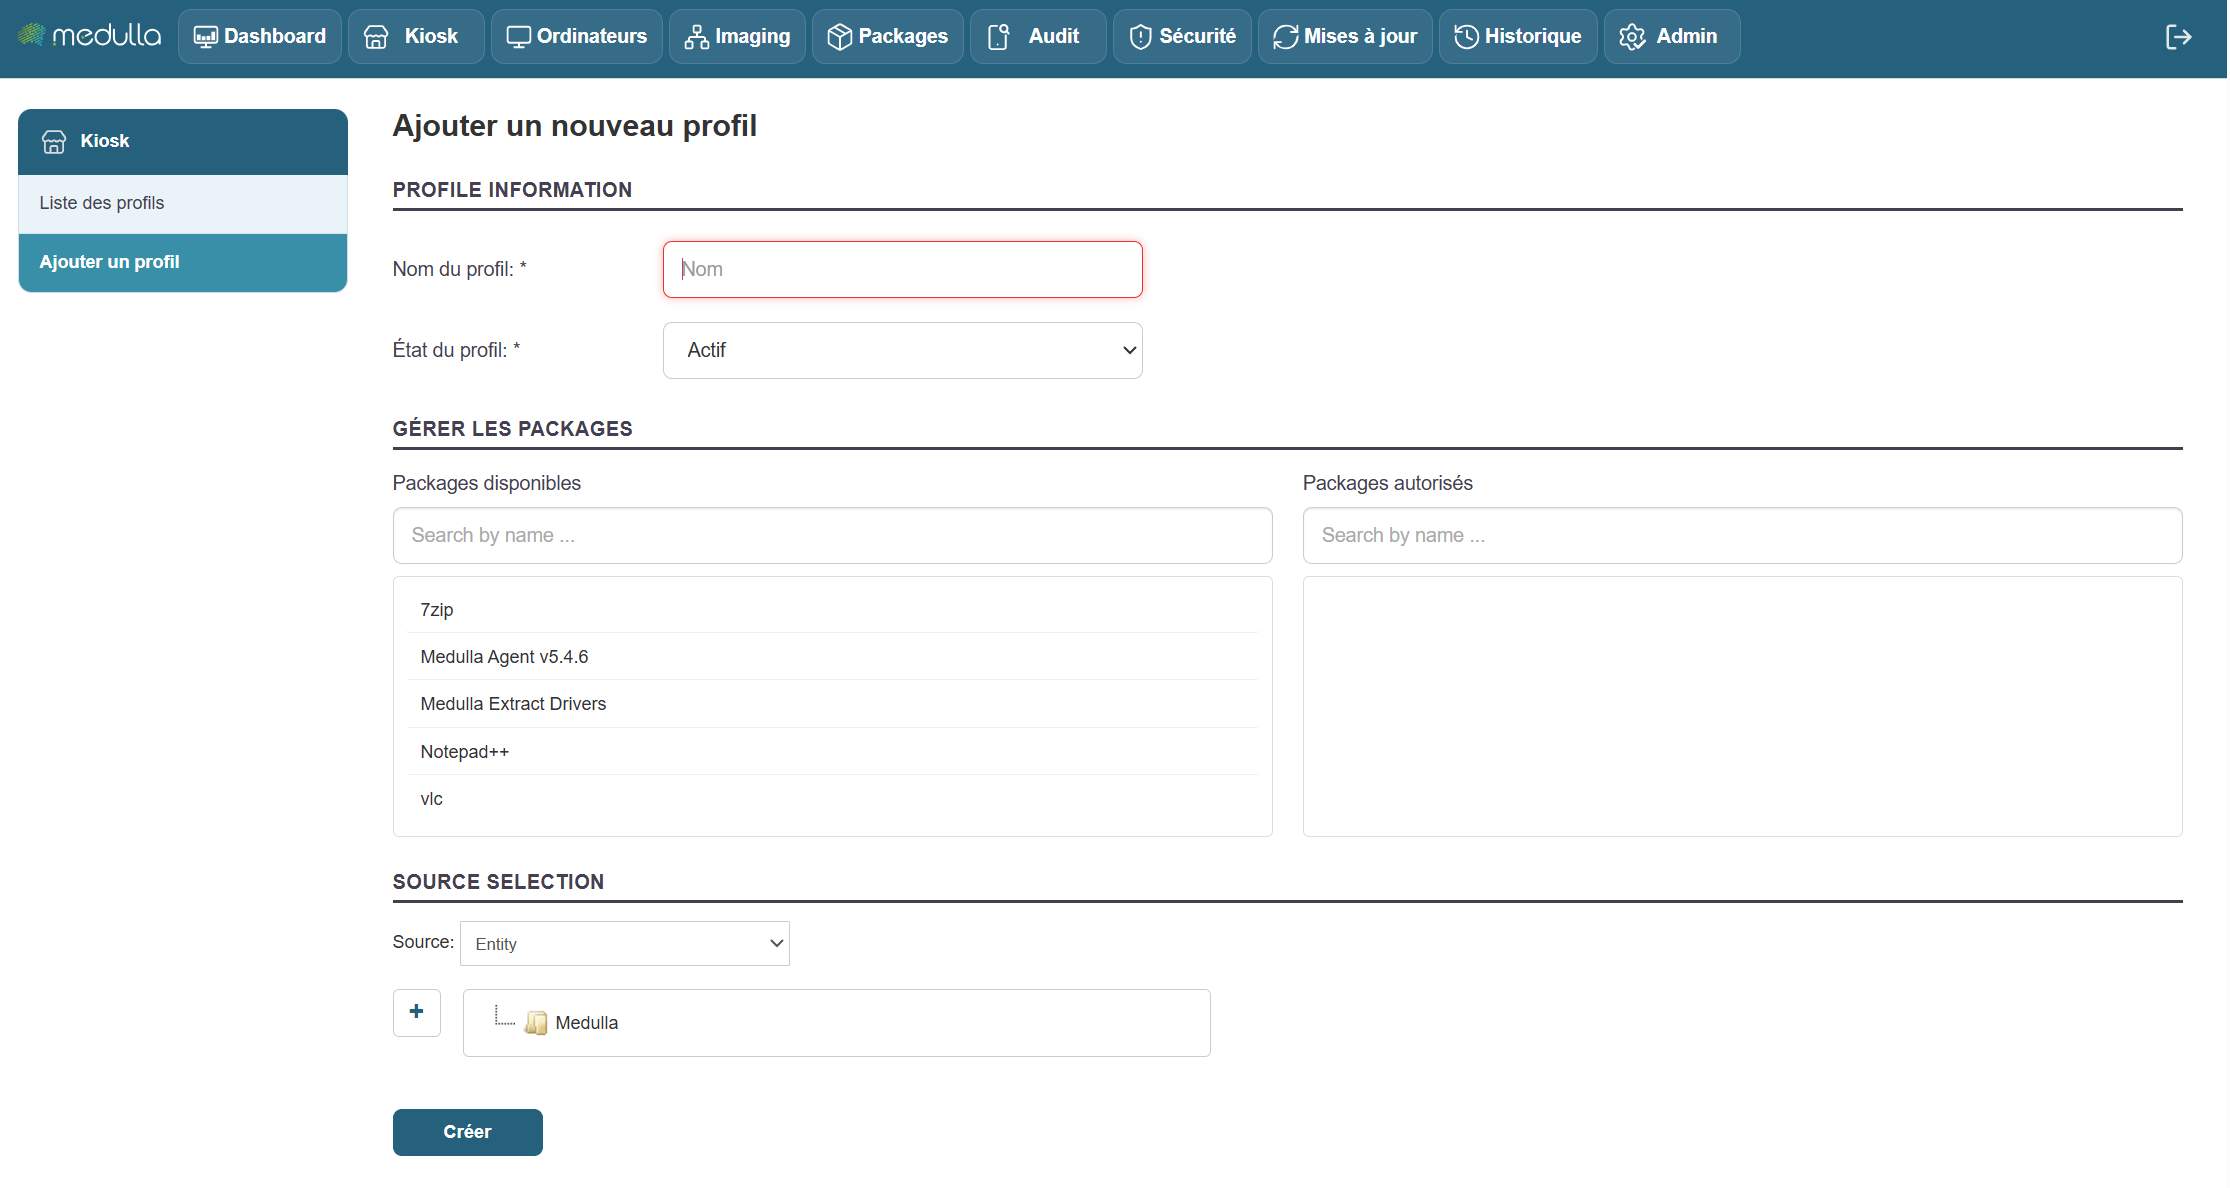
Steps for creating a profile
Click "Add Profile"
You will find a link labeled “Add a profile.” Click on it to access the profile creation page.
Fill out the creation form
Once on the page, you’ll see the form to fill out in the center of the screen. This is where you’ll set up your profile information.
Information to provide
-
Profile name
Enter a name for the profile. This name will then appear in the list of profiles.
Examples: User1, HRProfile. -
Profile status
Select the profile status when creating it:-
Active: The profile will be immediately operational.
-
Inactive: The profile will be created but will remain inactive (it will need to be activated later).
-
-
Manage packages (associated applications)
There are two sections for managing applications:-
Available packages: List of applications you can add.
Use the “Search by name…” field to search for a specific application. -
Authorized packages: List of applications already added to the profile.
To add an application, select it from “Available packages.” It will then be added to “Authorized packages.”
-
-
Application sources
At the bottom of the form, choose the source(s) of the applications to associate:-
Entity
-
LDAP
-
Group
- OR User
- Or Machine
-
Finalization
Once all the information has been entered, click the “Create” button to confirm the creation of the profile. The new profile will then be added to the Profile List, visible in the center of the home page.
When adding packages to a Kiosk profile, it is essential that an inventory be associated with the package.
Without this association, the packages cannot be assigned.
When deploying packages via Convergence, they must also be linked to an inventory.
Without this link, the deployment cannot be performed.
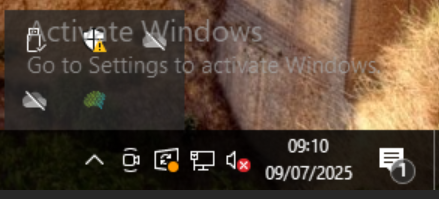
Medulla Kiosk
Once profiles have been created in the Medulla interface, users whose computers are connected to Medulla will see an icon representing the Medulla logo in their system tray: 
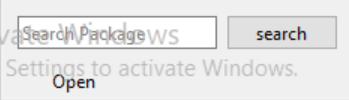
Double-click the icon to open the kiosk and view the applications that the Medulla administrator(s) have made available:
You can also right-click and then click the "Open" button:

Next, the user simply selects the relevant package and clicks the "Install" button.
The user then has several options available:
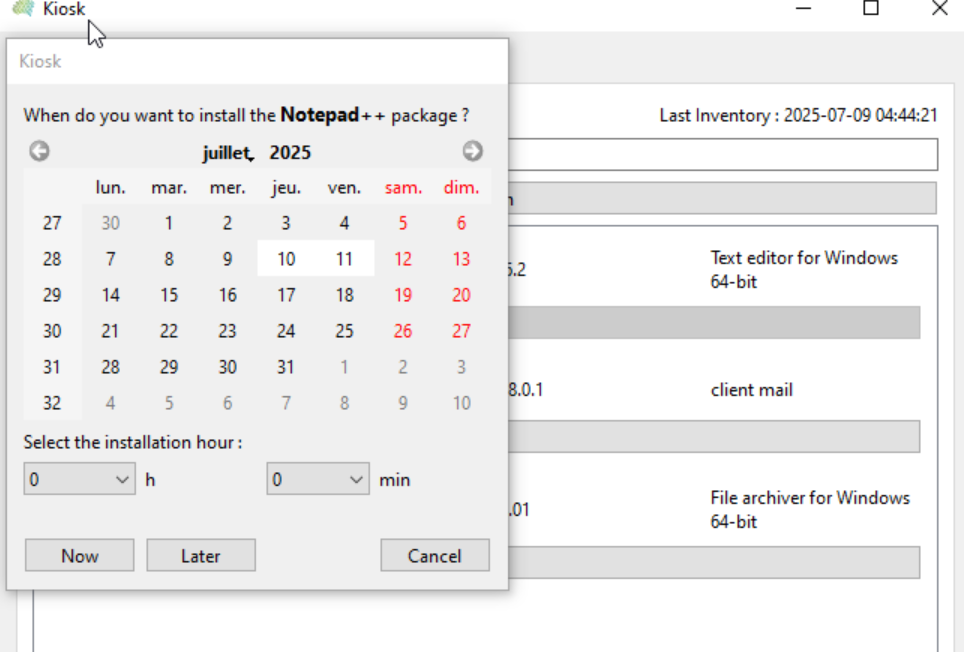
You can schedule a deployment date and time, then click the "Later" button (e.g., Today at 5 p.m.); at that time, the deployment will be carried out on the date and time scheduled by the user.
Or click "Now" to start the deployment immediately.
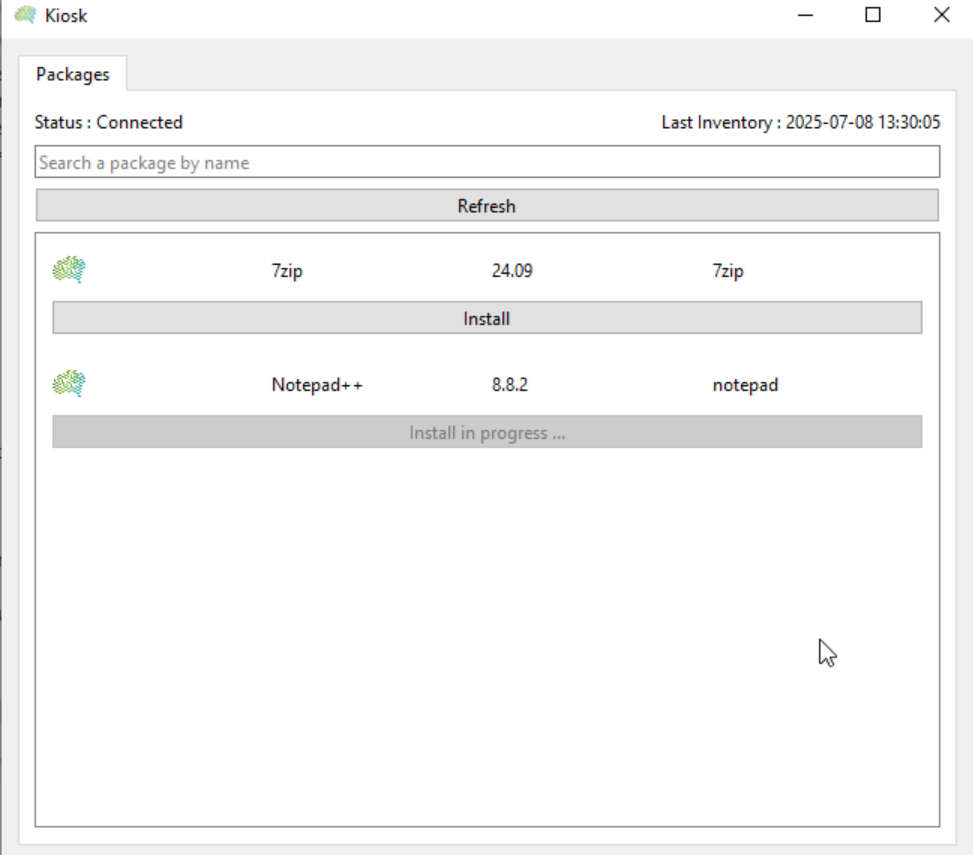
The user will then see the "Install" button change to "Install in Progress. "
Once the "Install" action has been clicked, the Medulla agent will send the installation request to the Medulla server, and the server will handle the installation as a normal deployment.
In the Medulla console, the administrator will find the deployment in the Audit tab with the command name followed by @Kiosk@, which identifies deployments via the kiosk.

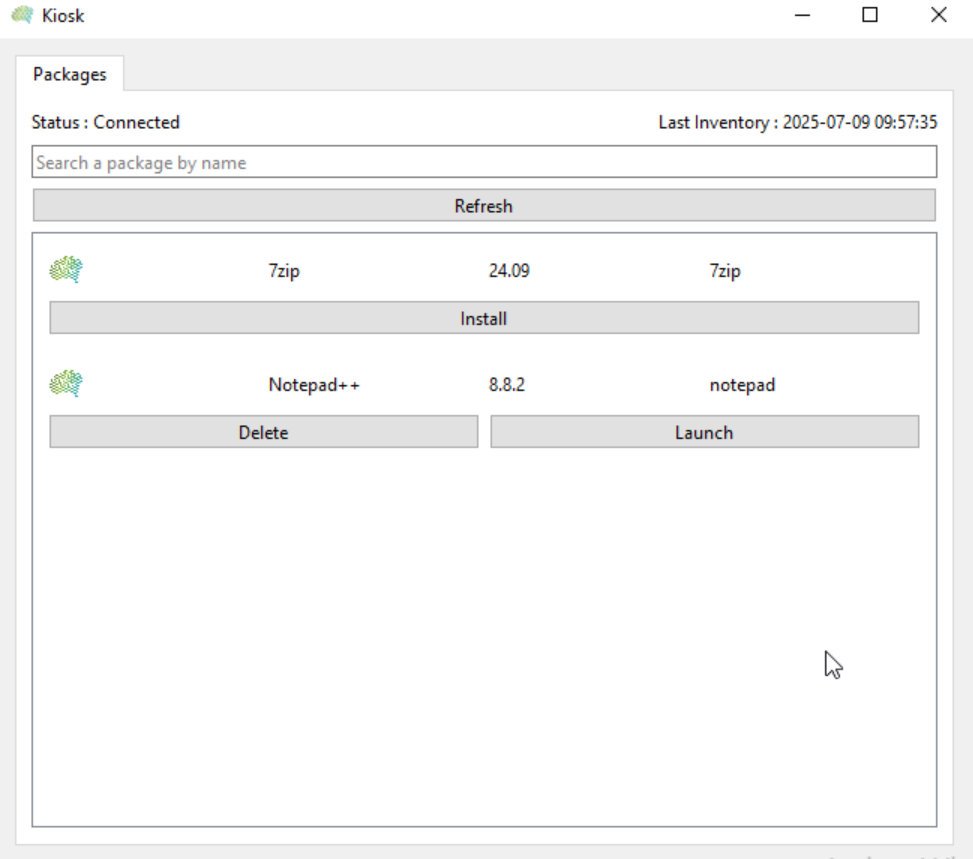
The user will see their kiosk window change to display the "Launch" button and the "Delete" button, which allows them to remove the program.
Chapter 4: Entities
Managing Entities in Medulla
This section guides you through managing entities within Medulla. You will learn how to view existing entities, add new ones, assign users to them, and download tagging agents directly based on the entities.
Entities in the Medulla module are provisioned directly in the GLPI or ITSMNG backend.
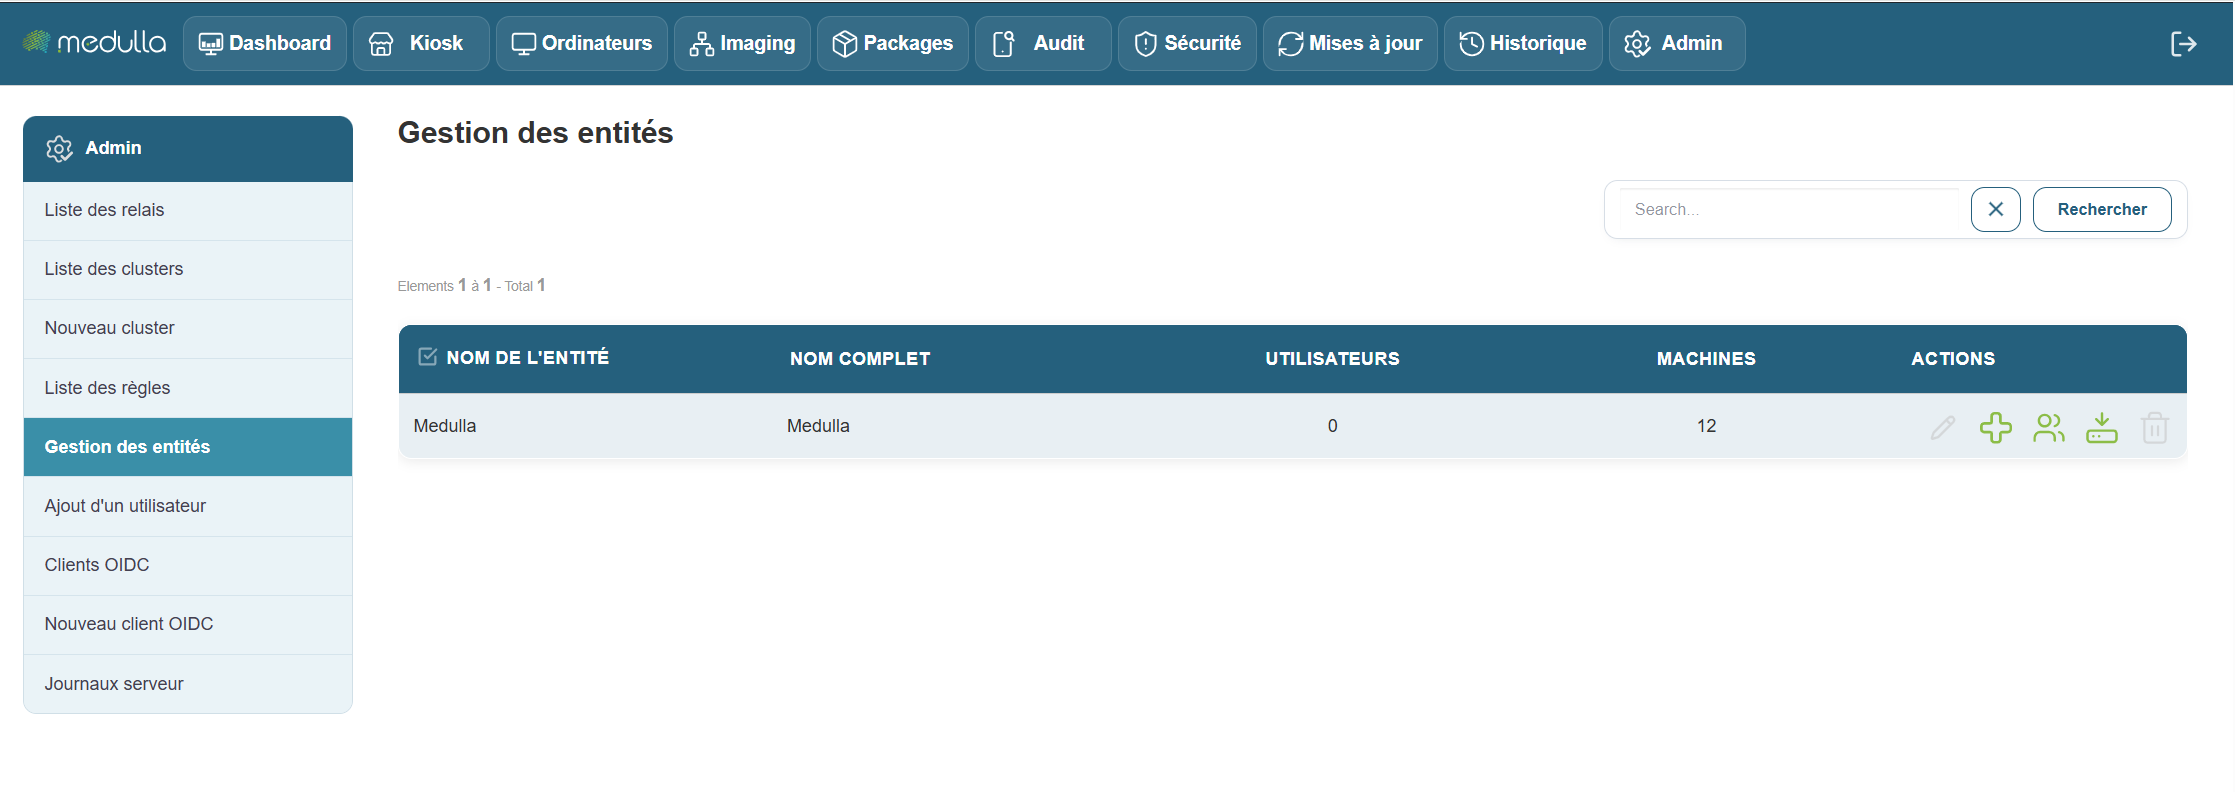
The Entity List Section
Located in the center of the screen, this section displays all entities registered in your Medulla environment.

Root Entities.
By default, a root entity is created in Medulla. This root entity can contain child entities and users within the root entity as well as within the child entities.
The following information is displayed for each entity:
-
Entity Name: the unique name of the entity.
-
FullName: the full name of the entity.
-
Number of users attached to this entity.
-
Number of machines: attached to this entity.
-
Actions: options toadd an entity, assign a user to the entity , and download the agent directly linked to the entity for inventory purposes.
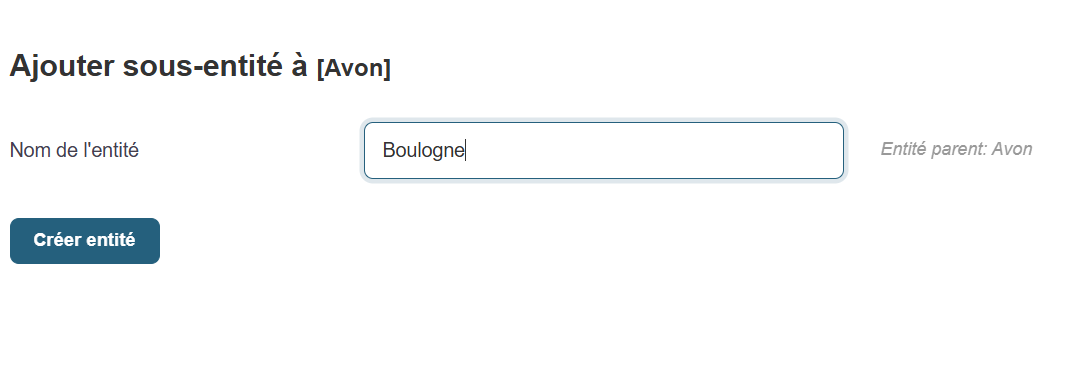
Add a Sub-Entity
To create a sub-entity, click the  on the parent entity's row, then give it a name and click the "Create Entity" button.
No users registered
If no users have been added yet, the users section will show a count of 0, as shown in the screenshot above.
Medulla Agent
By default (on-premise or classic configuration), we provide a global agent for Medulla; entity management per workstation is handled via GLPI.
However, if you wish to benefit , it is also possible to . This option , but if it meets your needs.
If you choose to have one agent per Entity as explained in this post, you will find the "Download an agent" buttons in the actions for an entity
. Select the Windows or Linux agent, then click Submit to download the relevant agent.
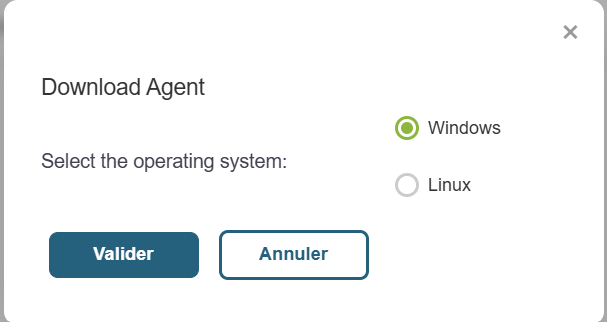
It will directly link the workstation to the entity configured in the downloaded agent.
Add an entity and create users
![]()
The button above opens the menu for creating a sub-entity of the root entity.
To create a new entity in Medulla, simply fill in the following field and then click the Create Entity button
- Entity Name
Go to the user creation page for an entity.
In the side menu bar on the left side of the screen, click the button

Click the “Add a user” link to open the creation page.
The form will appear in the center of the screen.
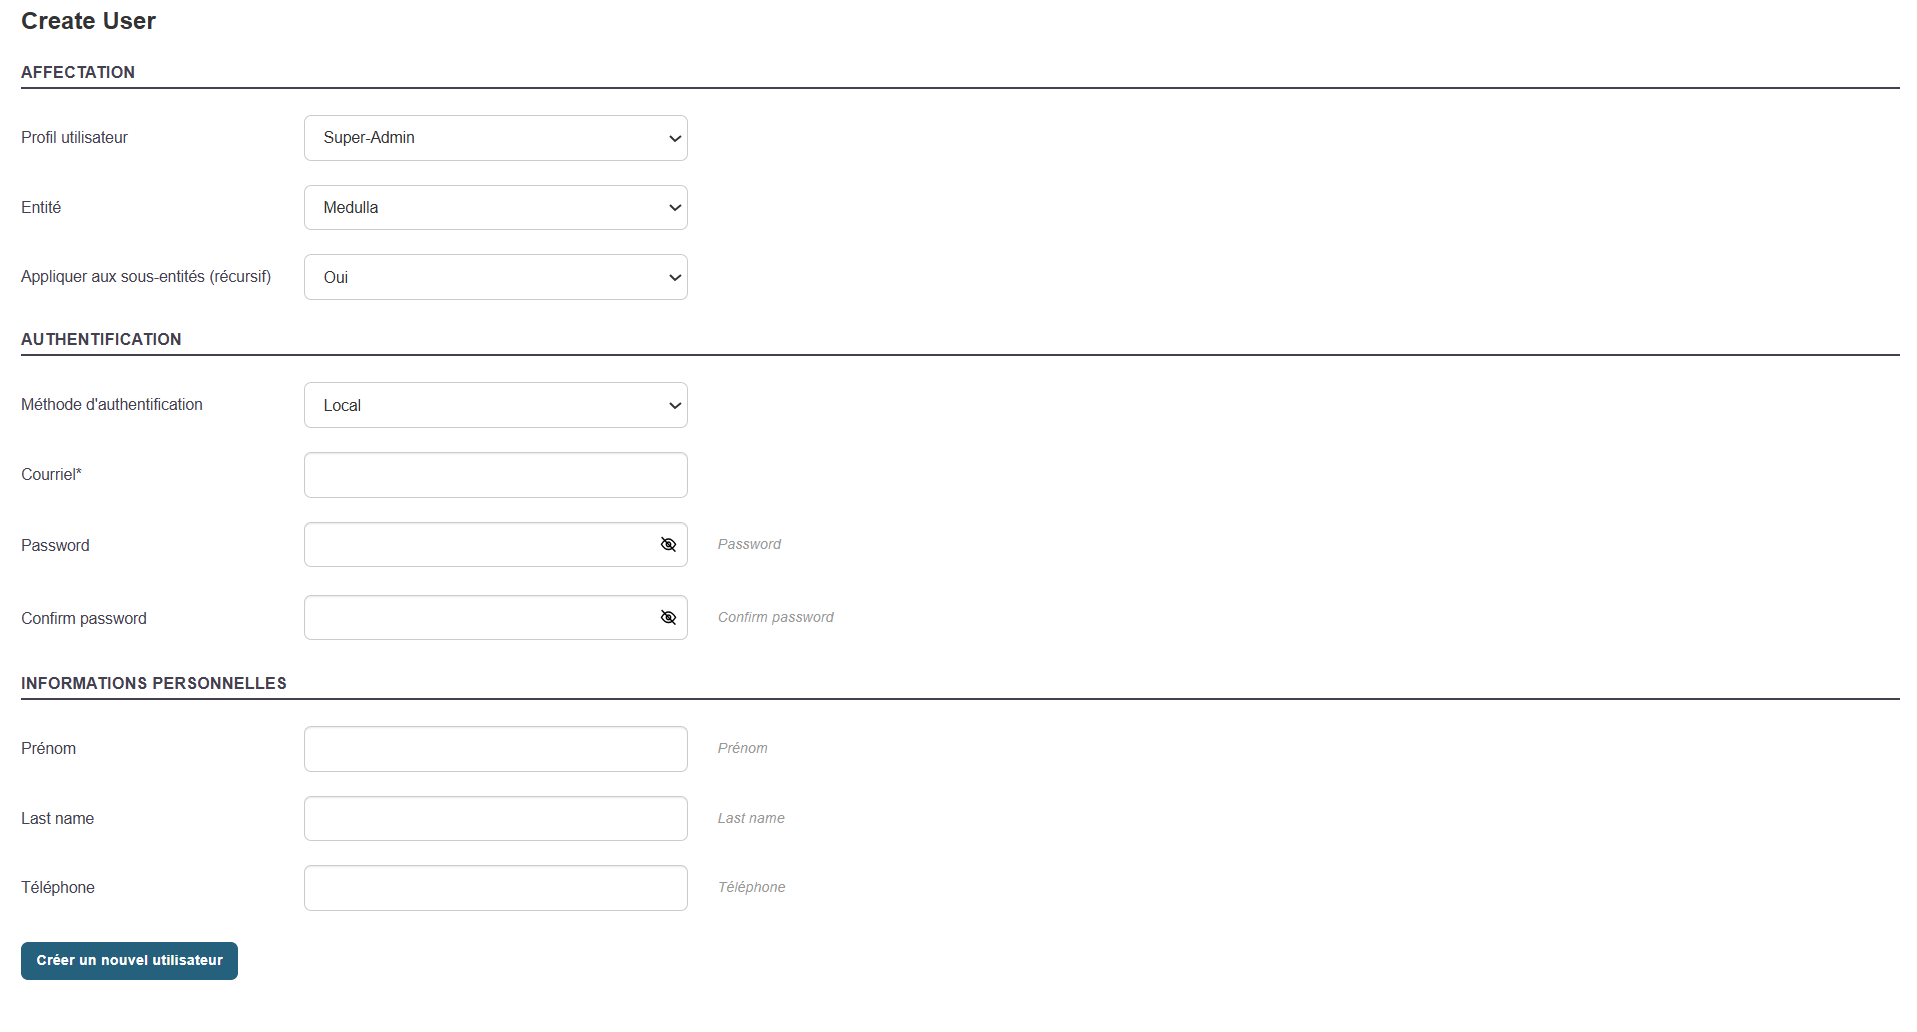
Fill out the Creation Form
Here are the fields to fill out
- User Profile: Select the user profile you want to associate with the user.
- Entity: Select the entity you want to map to the user.
- Apply to Sub-entities: Whether you want the profile and user to apply to sub-entities recursively or not.
- Authentication: Either a local user based on GLPI or ITSM, or a user mapped from AD or OIDC.
-
Email: An email address associated with the user.
-
Password and confirmation: The password that will allow the user to log in.
-
Last Name / First Name
-
Phone and/or Mobile
Then click the "Create New User" button to confirm the user's creation.
Edit an existing user

You can edit an existing user’s information at any time by clicking the button in Entity Management:

-
Go to the User List (center of the page).
-
Locate the relevant user.
-
Click " Edit " in the "Actions" column.
-
Update the necessary fields (name, email, etc.).
-
Save the changes.
Modify MMC Permissions
To adjust a user’s access rights in Medulla, you can modify their MMC rights (also known as ACLs— Access Control Lists).
Currently being redesigned.
If they do not have permissions for a module (for example, “Imaging”), they will not be able to view the logs associated with that module in the history, even if access to the history is authorized.
Chapter 5: Computers
Computers

This section is dedicated to the comprehensive management of all IT devices in Medulla. Whether you want to monitor, organize, or interact remotely with your machines, everything is centralized in a user-friendly and intuitive interface.
Computer management in Medulla is based on a centralized interface accessible via the XMPP View. From this interface, you have access to all the features needed to monitor machine status, perform targeted searches, apply filters, and perform various actions on your computers—all in real time.
XMPP View of Computer Workstations
The XMPP View is the heart of workstation management in Medulla. It allows you to monitor the connection status of each machine in real time and interact with them. This module centralizes information and available actions for complete control of your IT infrastructure
Filters and Workstation Selection
At the top of the page, you have three radio filters to select computers based on their connection status:
-
All Computers: Displays all machines, regardless of their status.
-
Online computers: Displays only computers that are currently connected.
-
Offline computers: Displays machines that are not currently connected.
These filters are useful for quickly and efficiently managing machines based on their availability.
Filtering by Entity
Global Search
Using the “Search all fields” search field, you can search for a machine by entering a keyword. This search field applies to all fields visible in the table, such as the machine name, IP address, operating system, or associated entity.
Actions Available on Devices
Under each computer workstation in Medulla, you have several actions available for remote management and control. These actions include advanced features such as machine inventory, monitoring, remote control, and much more. For a detailed view of each function, consult the Admin section, which covers these options in depth.
Here is an overview of the available actions:
![]() GLPI Inventory Tracking and management of hardware and software configurations via integration with GLPI.
GLPI Inventory Tracking and management of hardware and software configurations via integration with GLPI.
![]() Monitoring Real-time monitoring of machine performance.
Monitoring Real-time monitoring of machine performance.
![]() Remote Control : Directaccess to machines to perform troubleshooting or maintenance tasks.
Remote Control : Directaccess to machines to perform troubleshooting or maintenance tasks.
 Backup: Access to the Medulla backup module for user workstations.
![]() Software Deployment : Remoteinstallation or updating of software.
Software Deployment : Remoteinstallation or updating of software.
![]() Imaging Management Deployment and managementof system images.
Imaging Management Deployment and managementof system images.
![]() XMPP Console: Verify machine connectivity and interact in real time via XMPP.
XMPP Console: Verify machine connectivity and interact in real time via XMPP.
![]() Editing Configuration Files: Modify configuration files remotely.
Editing Configuration Files: Modify configuration files remotely.
 Quick Actions: Launch actions and commands via the XMPP protocol.
 Delete machine
All GLPI Computers
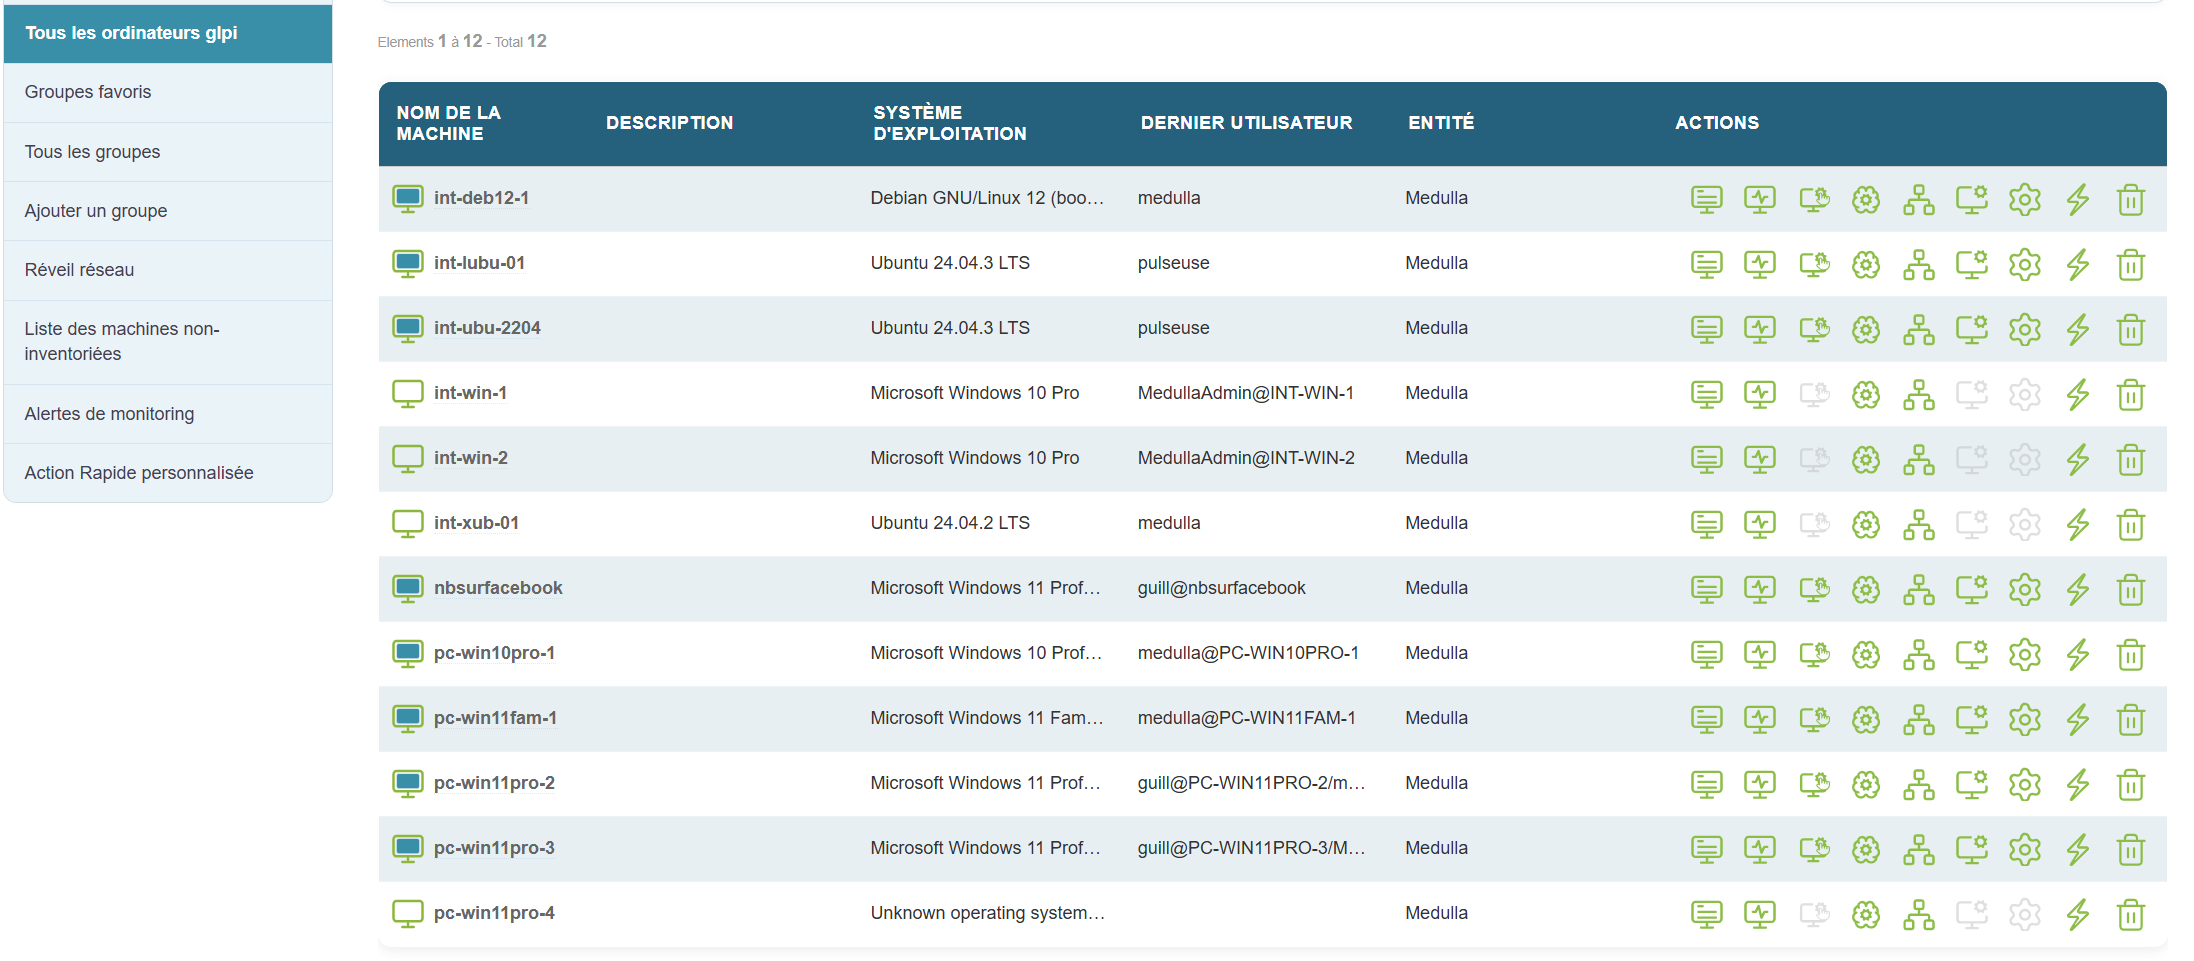
This section displays only the computers that have been synchronized withGLPI via the automated inventory. Here, you can view all machines registered in the GLPI system and check their status.
Features:
-
Display similar to the main page: You will find a visual interface identical to that of the "All Computers" view, with options to filter online or offline machines.
-
GLPI fields displayed: Key information about computers synchronized with GLPI is visible, such as:
-
Machine name
-
Operating system (OS)
-
Entity to which the machine is linked
-
Last user
-
And other important information
-
-
Filter by connection status: The interface allows you to filter online and offline machines based on their synchronization status with GLPI.
-
Display based on GLPI connection: Only computers that have been successfully synchronized with the GLPI inventory will appear here. If no machines appear, this may mean that the GLPI inventory has not been configured correctly or that the machines have not yet been synchronized.
If no devices appear here, it means that the GLPI inventory has not yet been configured or that the machines have not been synchronized
All groups
Favorite Groups
Once computer groups have been created, you can mark some of them as favorites for quick access.
Favorite groups are useful for:
-
Teams that regularly work on the same set of workstations
-
Preparing bulk action scenarios (imaging, updates, etc.)
-
Monitoring critical or sensitive machines
All Groups
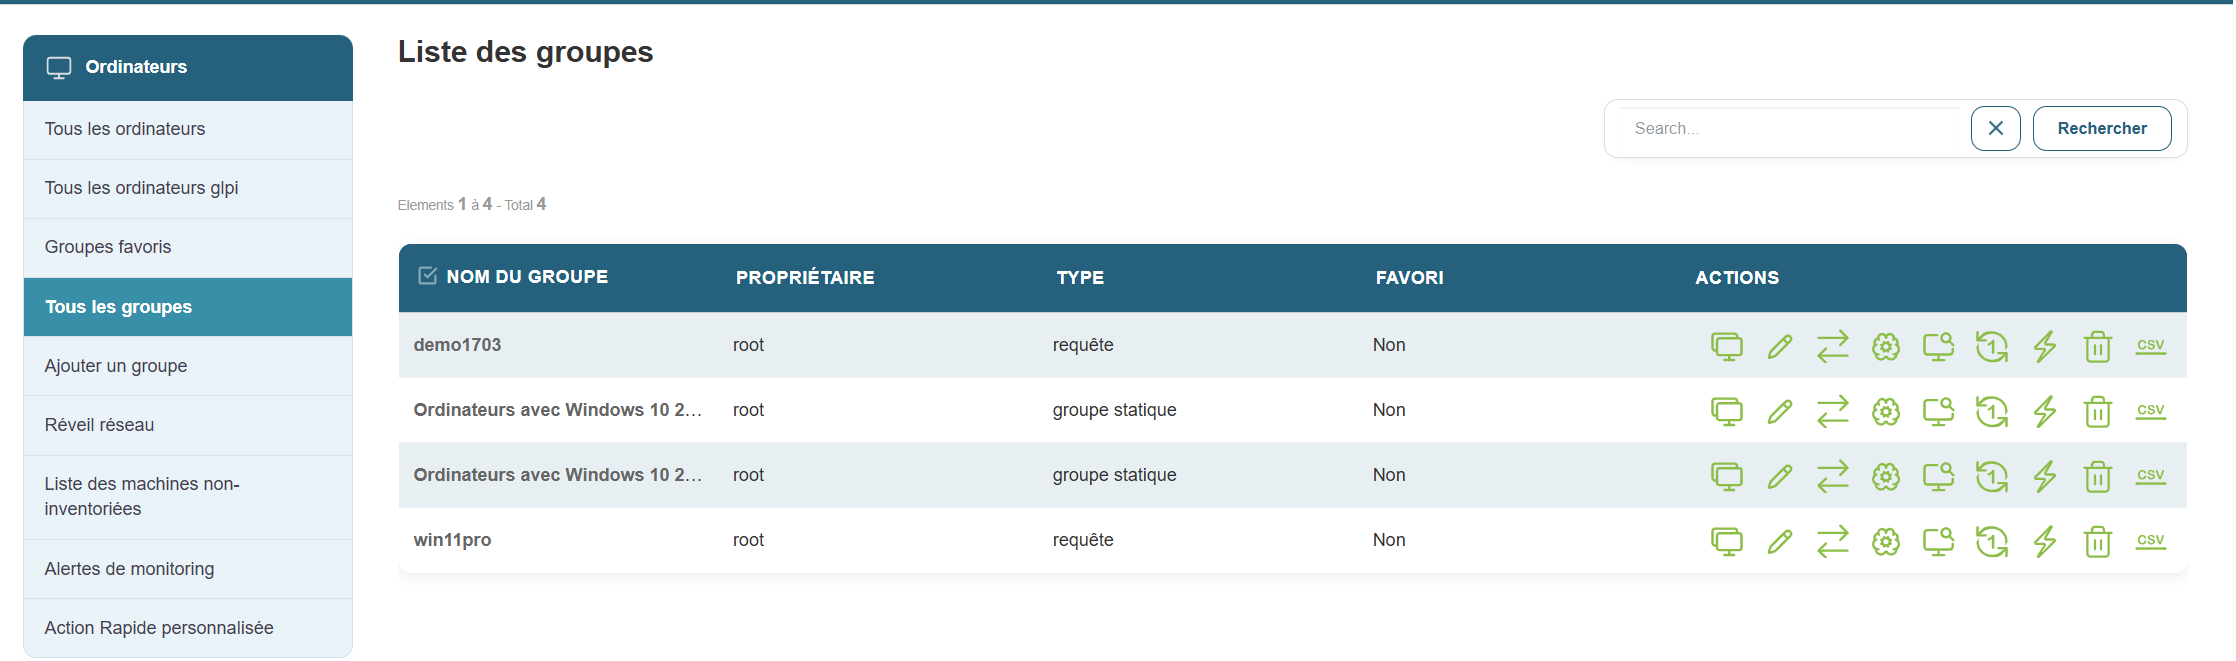
This section displays all available computer groups in your Medulla instance. This allows you to manage all groups centrally and perform large-scale actions, such as:
-
Software deployment
-
Installing updates
-
Remotely rebooting machines
-
Exporting reports to CSV format
It also allows you to perform a range of large-scale actions, such as deploying software, installing updates, remotely restarting machines, or exporting reports to CSV format
Add a group
Medulla offers several ways to structure and organize your IT infrastructure through a flexible group system. When creating a group, you can choose from several methods:
Creating a dynamic group
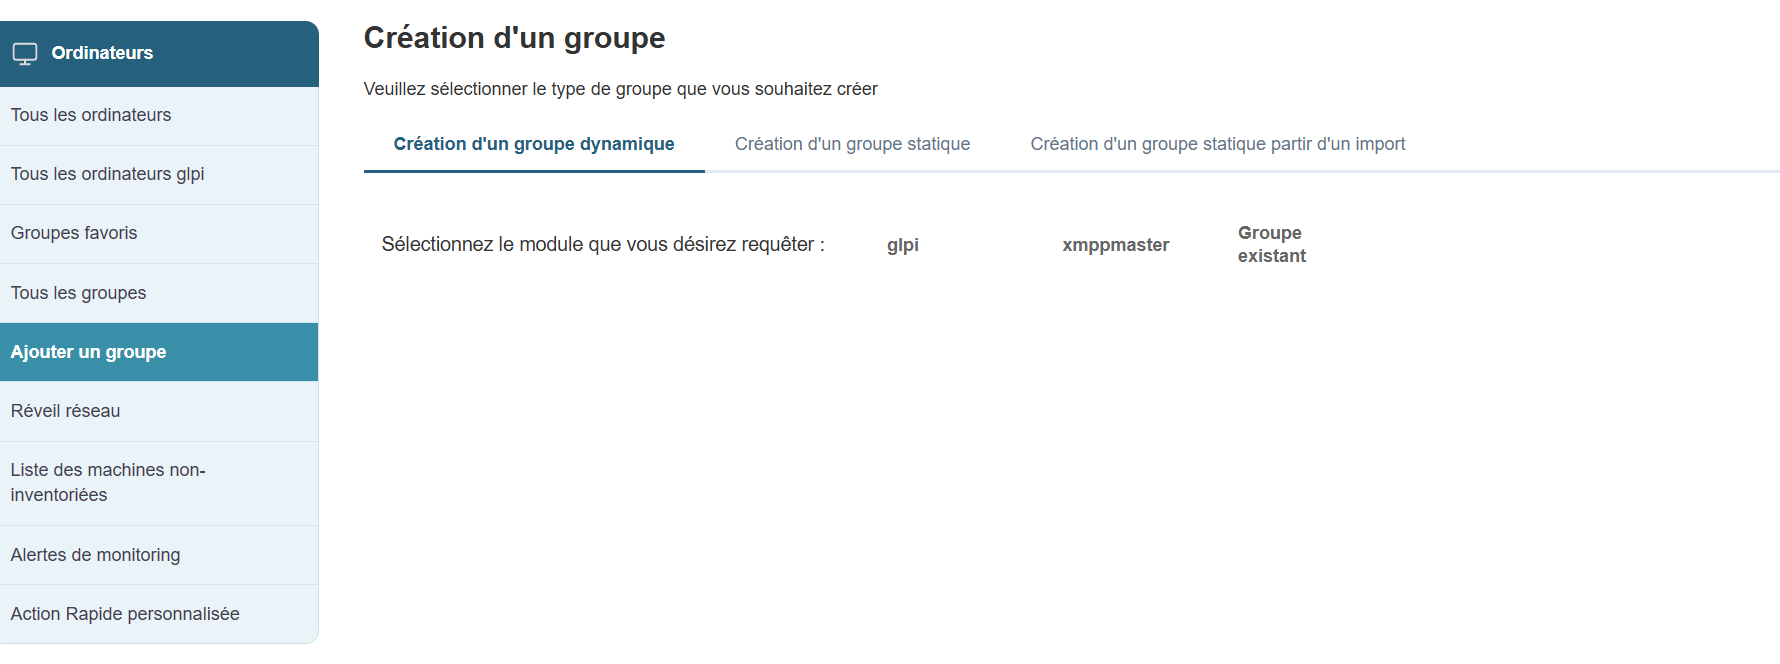
Dynamic groups allow you to automatically target machines based on predefined criteria. These groups update automatically as soon as a machine meets or no longer meets the selected criteria.
Modules available for creating a dynamic group:
-
GLPI: queries based on the GLPI inventory (OS, hardware status, etc.)
-
XMPPMaster: queries related to XMPP actions (real-time communication, monitoring, etc.)
-
Group: to cross-reference or filter existing groups
Dynamic groups are particularly useful in constantly evolving environments or for automated targeted deployment
Creating a static group
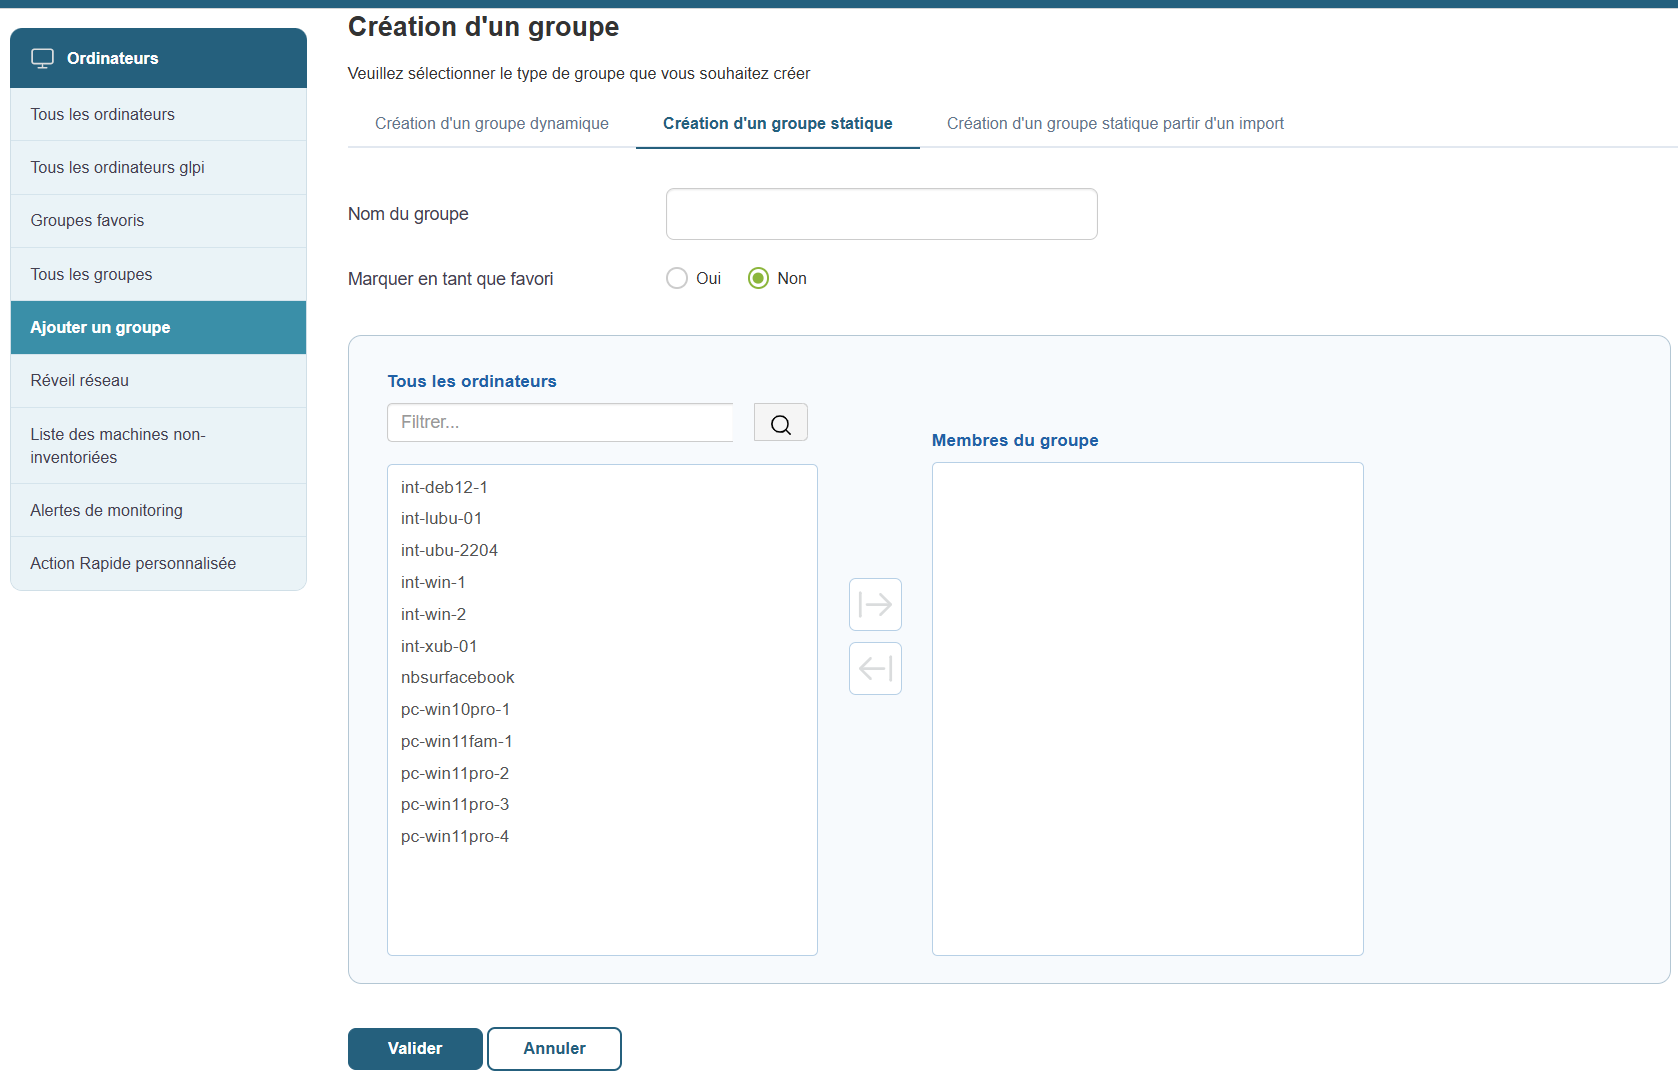
Static groups are created manually by explicitly selecting the machines to include. Unlike dynamic groups, the composition of a static group does not change automatically. You will need to add or remove machines as needed.
Functionality:
-
Group Name: Give the group a clear and relevant name.
-
Favorite: Check this option if you want the group to be easily accessible from the favorites menu.
-
Select machines: Choose the computers to include in the group from the list of available machines.
Typical use cases:
-
Create a group of test machines.
-
Prepare a set of computers to configure manually.
-
Monitor a fixed set of workstations in a specific context.
Static groups are ideal for one-time scenarios or specific monitoring tasks
Creating a static group from an import
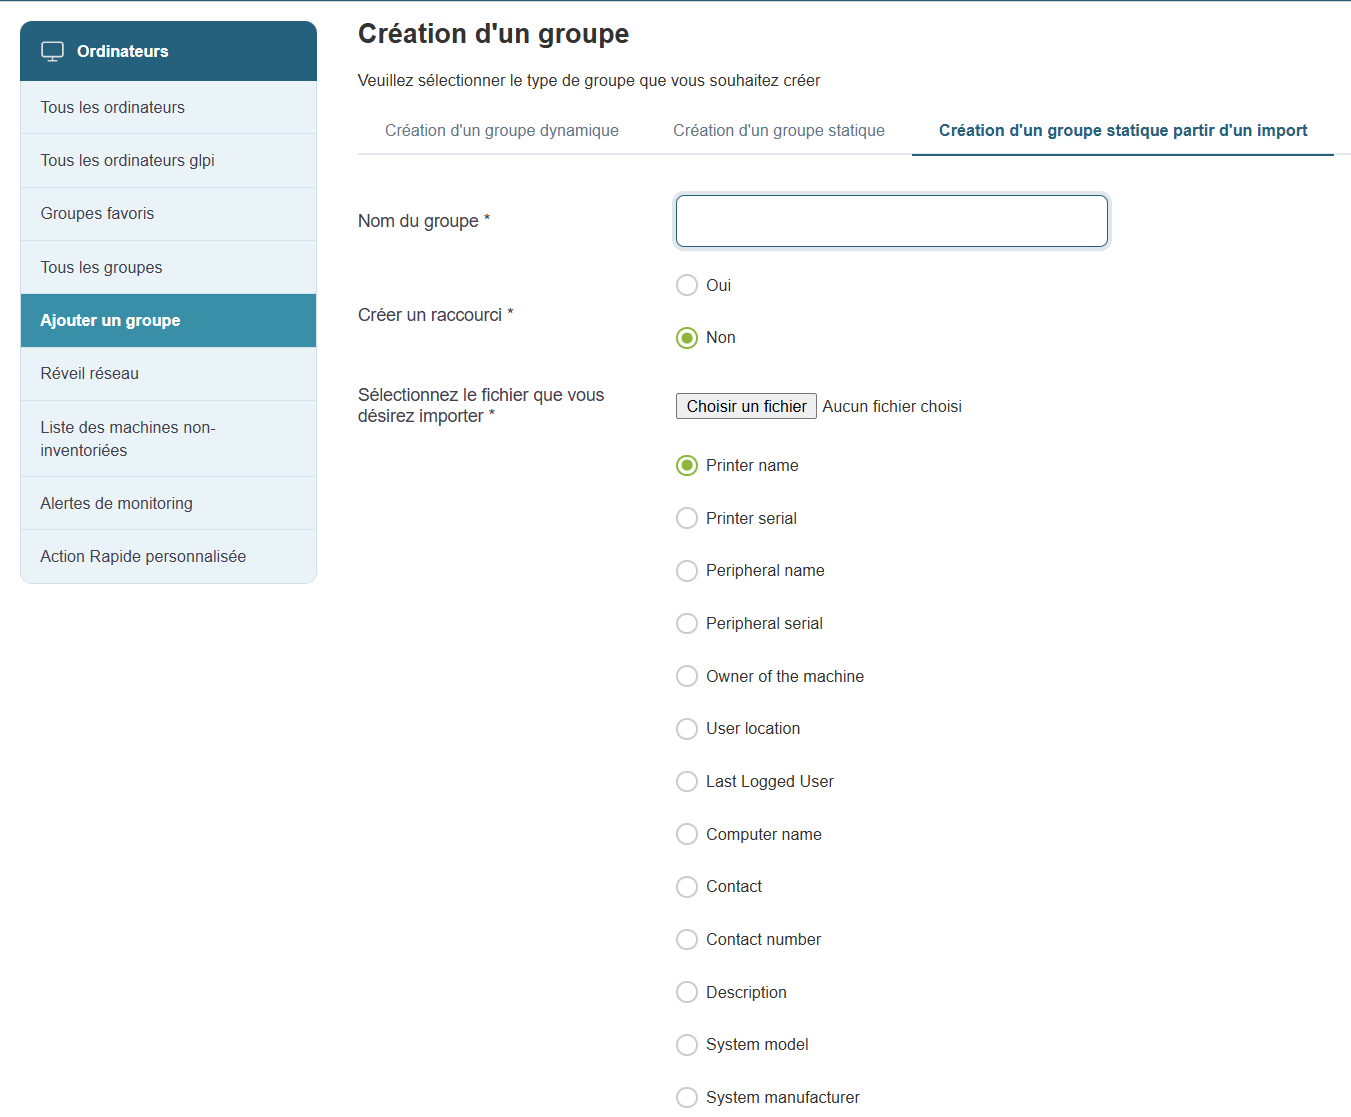
If you already have a list of machines (in CSV or Excel format), you can easily create a group from this file.
Creation steps:
-
Group Name: Enter a name for the group.
-
Favorite: Check this option if you want the group to be a favorite.
-
Import file: Click "Choose a file" to import your list ( CSV or Excel formats supported).
-
Define data types: Specify the data types contained in the file (e.g., Machine Name, User, Inventory Number, Operating System, etc.).
This method is ideal if you are retrieving information from an external system or a structured Excel spreadsheet.
Network Wake-up
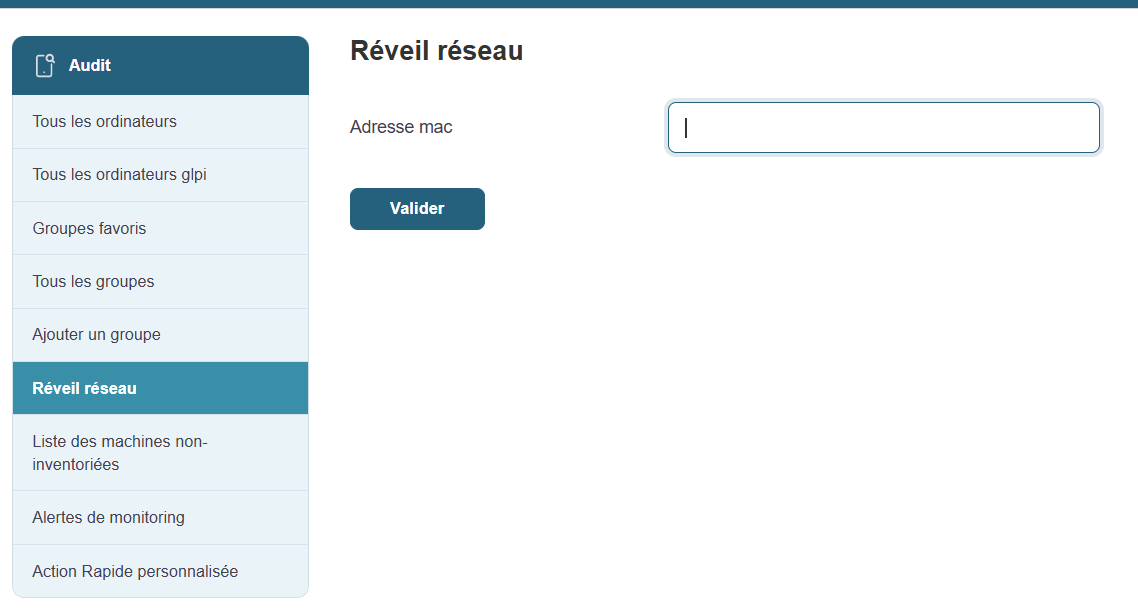
Wake on LAN (WOL) is a handy feature that allows you to remotely power on machines that are turned off, provided they are configured to accept this command.
How does it work?
Accessible from the Medulla main menu, this feature displays a list of machines compatible with Wake on LAN. This allows you to take remote control and manage the power-up of workstations without having to physically move to them.
Information available for each machine:
-
Machine Name: The identifier of the computer you want to wake up.
-
Current status: Displays the machine’s status (online or offline).
-
Action button: Allows you to attempt to wake up the selected machine. Clicking this button will attempt to send the wake-up command.
Prerequisites:
Wake-on-LAN relies on proper BIOS/UEFI configuration of the machines. Ensure this feature is enabled on the machines before attempting to wake them remotely.
Typical uses:
-
Booting groups of machines before a deployment or maintenance operation.
-
Wake up computers to update them or run backups overnight, so as not to disrupt business operations during the day.
Benefits of Wake on LAN:
-
Time savings: Remotely boot multiple machines simultaneously.
-
Flexibility: Allows you to keep workstations up to date and perform maintenance operations without physical intervention.
-
Increased productivity: Ideal for IT teams that need to manage a large number of machines without disrupting users.
This feature relies on the workstations’ BIOS/UEFI settings (Wake-on-LAN must be enabled
Typical use
-
Remotely boot a group of computers before a deployment operation
-
Wake up computers to keep them up to date or run backups overnight
List of uninventoried machines

This section allows you to quickly identify machines that are not properly inventoried in Medulla. These may be machines that have never reported information, or machines that have been offline for too long.
Objective:
-
Identify inactive or misconfigured machines.
-
Verify that the XMPP/GLPI agents are functioning properly on the machines.
-
Identify machines that have been deleted without being cleaned up in the database.
Overview:
When you access this page, a table appears listing all machines with inventory anomalies. Here is the information available in this table to help you diagnose and resolve these issues:
Table columns:
-
XMPP Machines: List of machines with an XMPP agent enabled, allowing real-time communication with Medulla.
-
JID (Jabber ID): Unique identifier of the XMPP agent, used to establish the connection with Medulla.
-
Archi: The machine’s hardware architecture (e.g., x86_64, ARM, etc.).
-
Class: The machine’s class (e.g., PC, server, terminal, etc.).
-
Kiosk Presence: Indicator showing whether the Kiosk is installed and operational on the machine.
-
OR Users: Organizational unit associated with the machine’s users.
-
OU Machines: Organizational unit associated with the machine itself.
-
Cluster Name: Name ofthe cluster to which the machine might belong (if applicable).
-
Cluster Description: Description or additional details about the machine’s cluster.
-
MAC Address: The machine’s MAC address, used to uniquely identify network devices.
-
XMPP IP: IP address used for XMPP communication.
-
Actions: Buttons for performing actions on the machine, such as deleting, updating, or repairing the agent.
Typical use cases:
-
Suspected inactive machine or failing agent:
If you suspect that a machine is no longer active or that the XMPP/GLPI agent is no longer functioning properly, this page is an excellent starting point for checking its status. In particular, you can identify the machine using the MAC address or the XMPP IP. -
Inventory cleanup or audit preparation:
If you are cleaning up the inventory or preparing for an audit, this list allows you to identify machines to check or remove from the database. You can quickly filter and locate machines to audit, for example, by checking information such as the presence of Kiosk or the XMPP status.
Helpful tip:
If a machine appears in this list but no longer appears in "All Computers, " this may mean that it has been disconnected for a long time or that its XMPP/GLPI agent is misconfigured. You can then take the necessary steps to resolve the issue (reinstalling the agent, deleting the entry, etc.).
Monitoring alerts
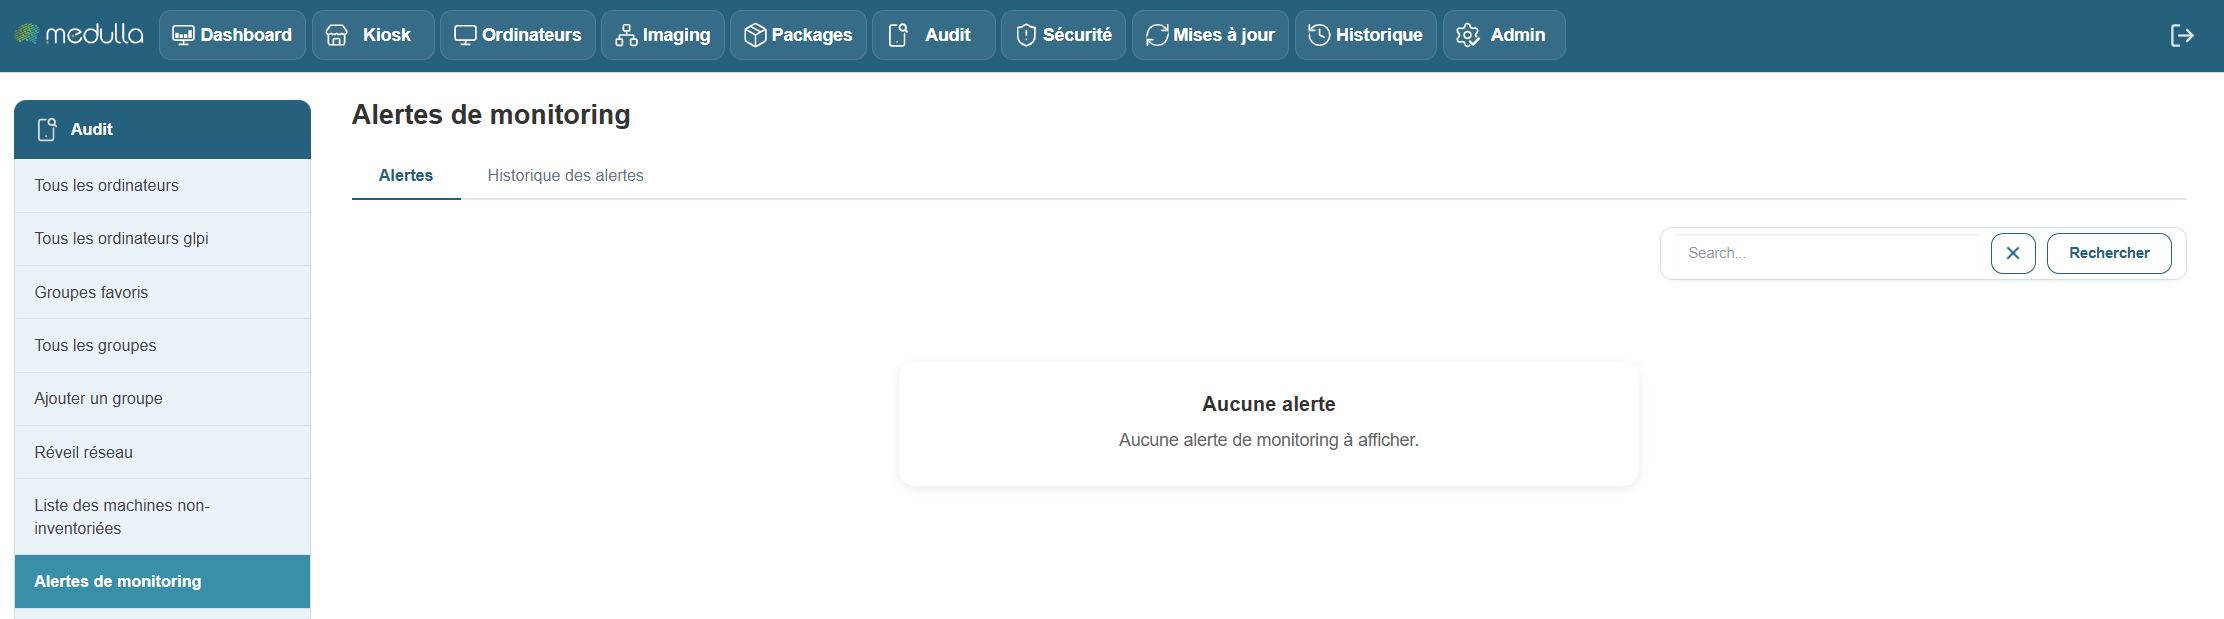
This section centralizes all alerts generated by the monitored machines in your Medulla environment. It allows you to track, in real time or later, hardware or software incidents detected by the monitoring agents deployed on your machines.
Objective
-
Identify critical or recurring incidents: such as disk failures, device errors, network anomalies, or any other issue affecting monitored machines.
-
Ensure clear event traceability: by maintaining a precise timestamp for each alert to guarantee comprehensive tracking.
-
Enable a rapid response: by alerting administrators to detected issues so they can intervene quickly.
Alert History
When no alerts are currently active, you can view the history of past events. This includes resolved alerts, ensuring complete traceability of incidents and actions taken on your machines.
Information available in the history:
If alerts are logged, the table will display the following:
-
Machine name: Name of the machine affected by the alert.
-
Event date: Exact date and time of the incident.
-
Event type: Category of the incident (e.g., device error, hardware failure).
-
Machine message: Details of the error or problem reported by the machine.
-
Affected device: The device associated with the incident (e.g., hard drive, network card).
-
Status: Current status of the alert (open, in progress, resolved).
-
Message: Alert message generated by the monitoring agent.
-
Serial number: Serial number of the device or machine.
-
Firmware: Firmware version related to the incident.
-
Comment: Space for comments or details about the incident.
-
Available Actions: Actions to take regarding the incident (e.g., resolve, ignore, export).
Note: If the table is empty, it means that no alerts have yet been detected or recorded in your environment.
Recommendations
Before making any changes, it is recommended that you back up the existing file.
Apply changes carefully and test them on a small number of machines.
Contact your system administrator if you have any questions about a setting.
Custom Quick Action
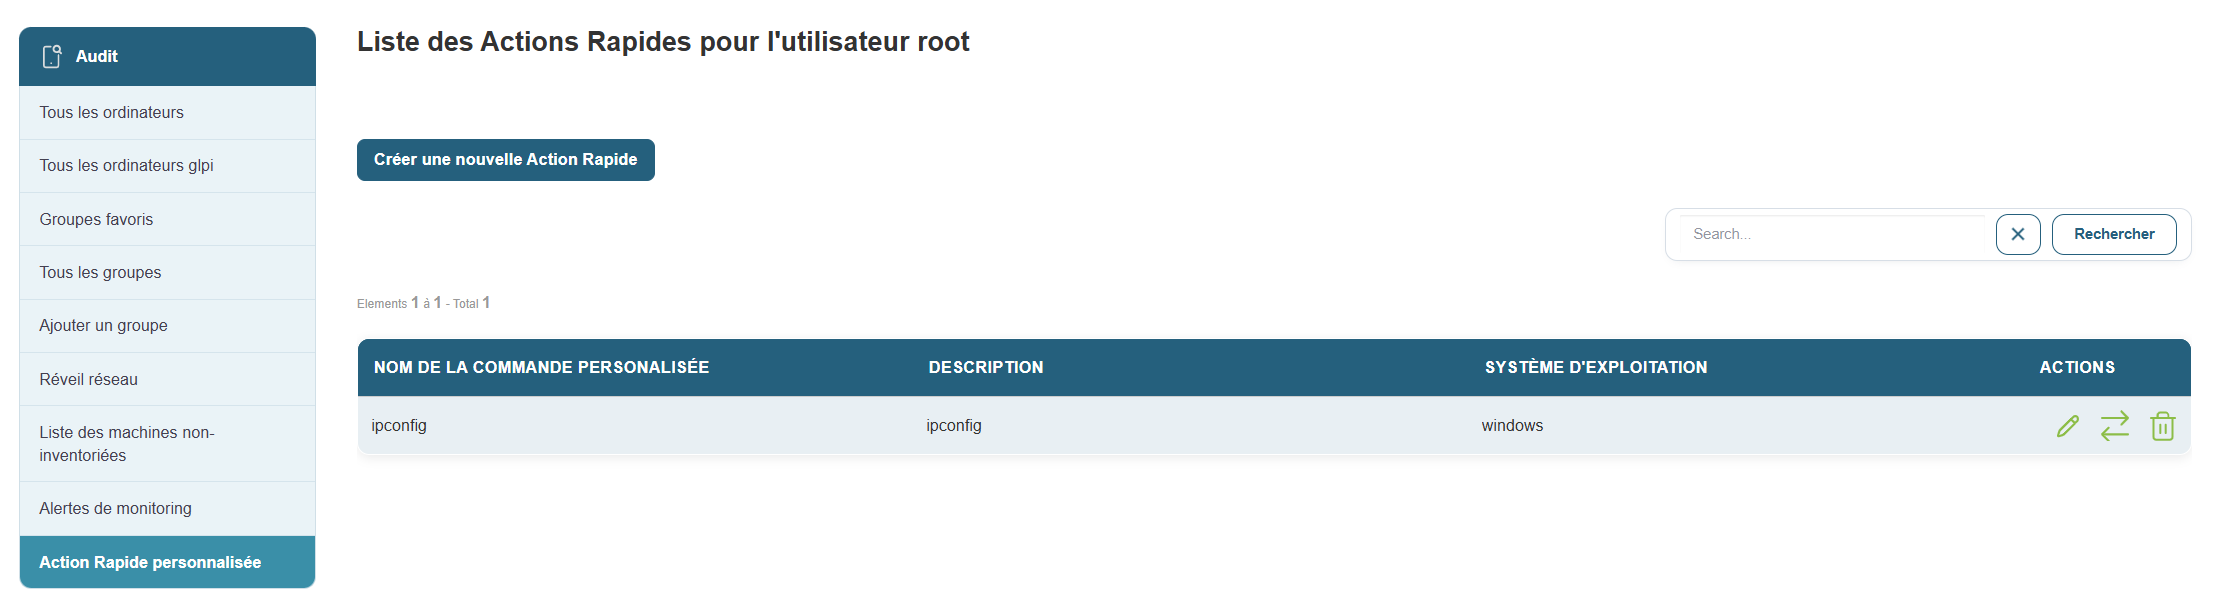
The Custom Quick Action section allows you to create and manage automated actions that will be executed remotely on your machines. These actions can include specific scripts or commands, thereby facilitating bulk management and the automation of administrative tasks across multiple workstations simultaneously.
Overview
Once in this section, you will see a list of all custom quick actions already configured for the root user. If no actions have been created yet, an empty table will appear, allowing you to add custom commands.
The table contains the following information:
-
Custom Command Name: The name assigned to the quick action. This is the name that will be used to identify the action.
-
Description: A summary or detailed description of what the action does. This allows you to quickly understand the purpose of the command without having to consult its script.
-
Operating System: The type of system for which the quick action was defined (e.g., Windows, Linux, macOS).
-
Actions: The options available to edit or delete an existing quick action.
Create a new custom quick action
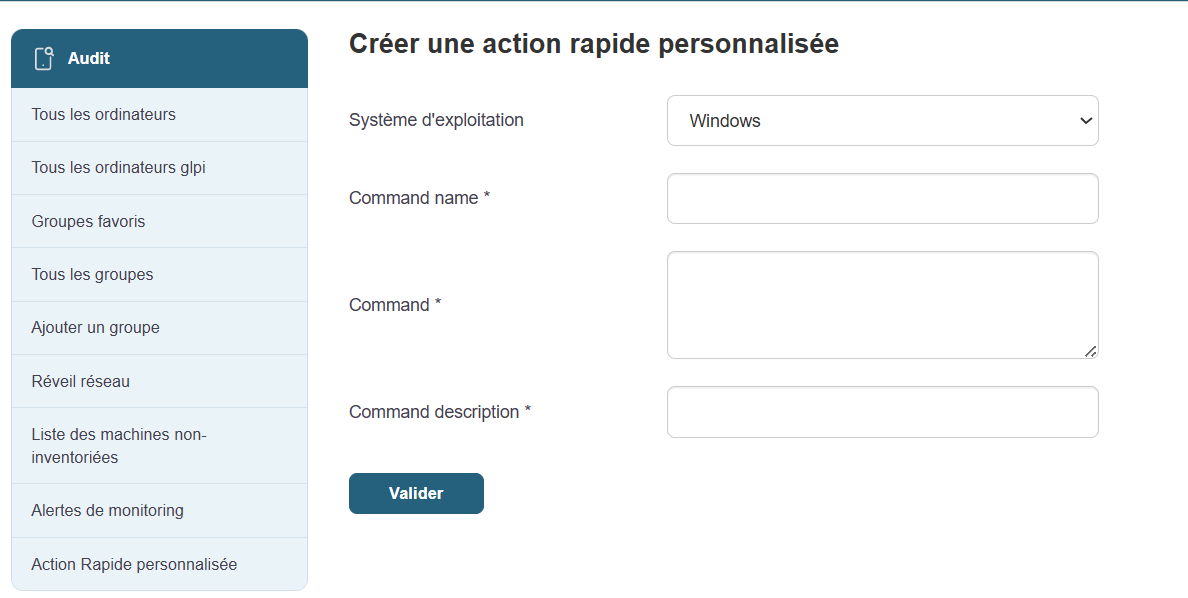
To create a new custom quick action, simply click the "Create a custom quick action" button at the top of the page. This will take you to a form where you can define the settings for your new command.
Custom Quick Action Creation Form
The form is divided into several essential fields:
-
Operating System:
Select the target operating system on which the command will be executed. Example: Windows, Linux, macOS, etc. -
Command Name:
Give this quick action a unique name so you can easily identify it among other commands. This name should be clear and descriptive to avoid confusion. -
Command or Script:
Enter the exact command or script you want to run remotely on the target machines. For example, you can enter a command such as:shutdown /r /t 0to immediately reboot a Windows machine, or another administrative script tailored to your needs. -
Command Description:
Add a concise description explaining the purpose of the command. This will help all administrators understand its purpose, even if they weren’t responsible for creating it.
Once all fields are filled in, simply click "Validate" to save and activate the action. The action will now be available in the list of custom commands and can be executed on the target machines.
Verification: Before running an action on a large number of machines, test it on a single machine to ensure it works as expected.
Documentation: It is recommended that you clearly describe each quick action so that all users can understand its purpose and effects.
Security: Commands can have a significant impact on systems. Ensure that only authorized and necessary actions are executed.
Delete a computer
To delete a device, simply go to the Computer view, select the device you want to delete, go to the actions on the right, and click the "Trash" button. ![]()
Chapter 6: Imaging I
Imaging

This section is dedicated toverifying the status of the imaging server, an essential step before deploying a system or creating a reference image.
The imaging server is a central component of Medulla: it allows a system image (a sort of complete "copy" of a computer) to be sent to one or more workstations. If this server is unavailable or malfunctioning, no imaging-related operation can be completed.
This is why it is recommended to systematically check its status before performing any such action.
Accessing the Imaging Server Status
When you click on the Imaging Server Status tab, you are immediately taken to the page where the pre-selected entity is neither private nor public; we will therefore refer to it as "General."
"General" Entity with Server Offline
This means that the imaging server linked to the "General" entity is inactive. You will not be able to deploy images to the machines in this entity
Understanding the Displayed Information
Selected Entity
At the top of the page, you must selectthe relevantentity.
Entities correspond to logical groupings, often used to separate environments (e.g., services, departments, locations).
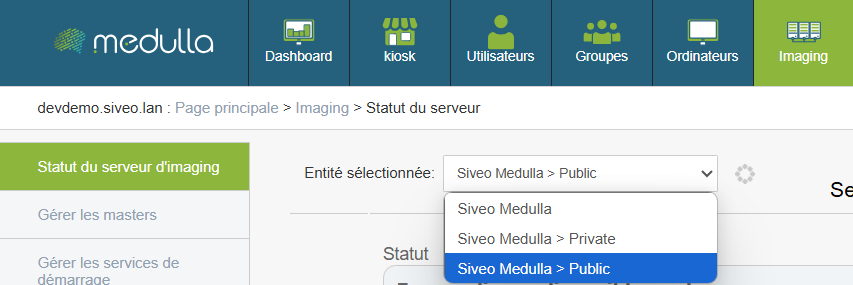
Examples of entities:
- Public
- Private
- General
Why it matters:
Each entity can be linked to a separate imaging server. It is therefore crucial to verify the status of the server for the entity you wish to use.
Server Status
For the selected entity, a visual indicator shows the current status of the server.
Three statuses may appear:
- Available
The server is operational. You can proceed with image creation or deployment. - Offline
The server is not responding.
No imaging operations can be performed.
Recommended action: contact the administrator or technical support. - Connection error
The server is reachable, but the connection fails (often due to a configuration or network communication issue).
Operations are blocked.
Recommended action: report the issue to the technical team.
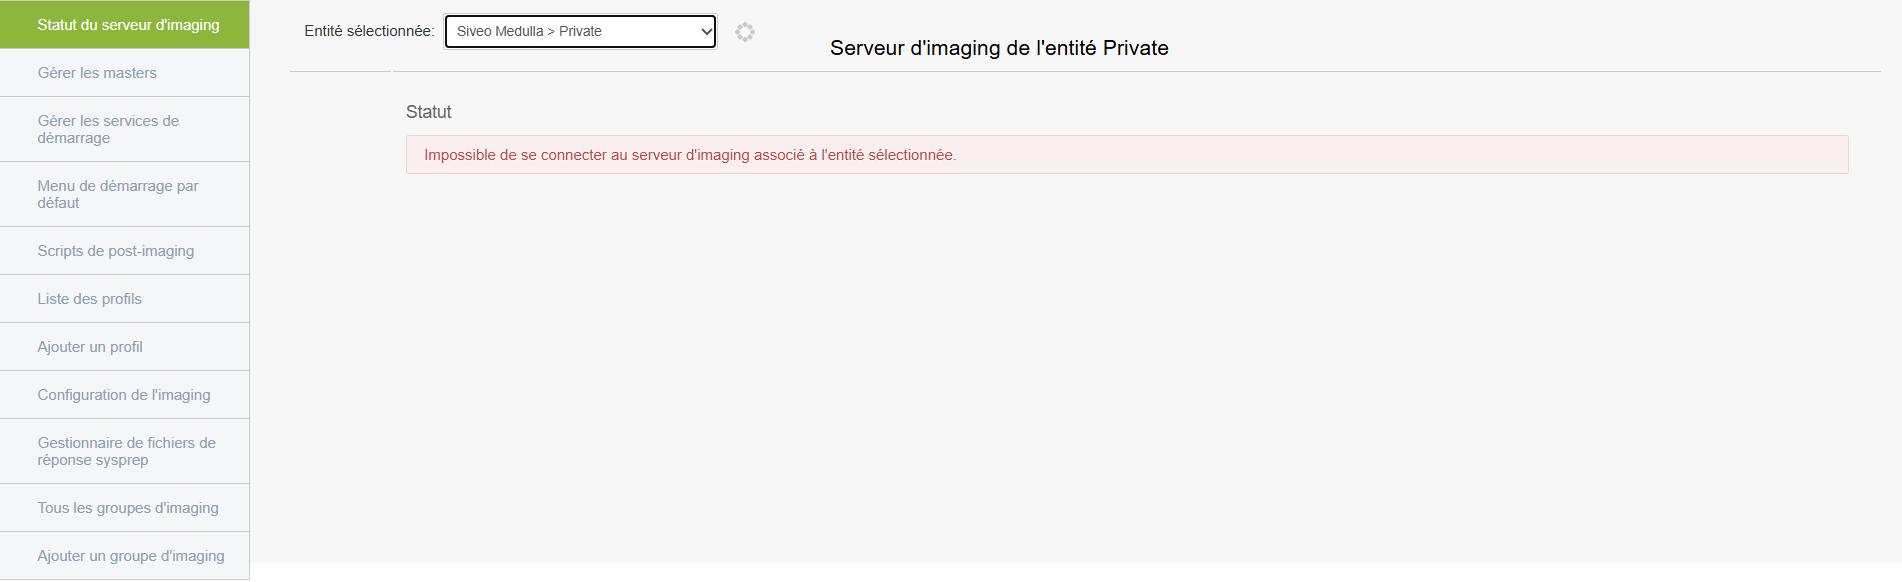
"Private" entity with connection error
Even if the server appears to be accessible, communication is not working.
The deployment will fail upon launch because the connection between Medulla and the server is broken.
"Public" entity with successful connection

If there are no errors and the server is online, this means the server is active and ready for use; it will therefore display various statistics as shown with the "Public" entity above.
In this case, it will display various information:
- Available disk space on the server: This section shows the server’s storage capacity, i.e., the space available to host system images. This space is divided into two parts called “partitions”; the first (dev/vda3) is the main partition, and the remaining free space indicates that there is room left to store images. The second is a small partition used for server boot but has no impact on deployments.
- Server load: This data provides a general overview of the server’s status, such as the duration of operation without a reboot and RAM usage
- Public entity statistics: This is information about imaging usage within the entity. Clients correspond to the machines associated with the entity; the "client has x backup images" field indicates which machines required a restore, and the number of available masters tells us how many system images are ready for deployment.
Before performing any imaging operation, verify that you are on the correct entity and that the server status is listed as “Available.”
If the status is "Offline" or "Connection Error, " do not proceed and notify the administrator or support.
Manage masters
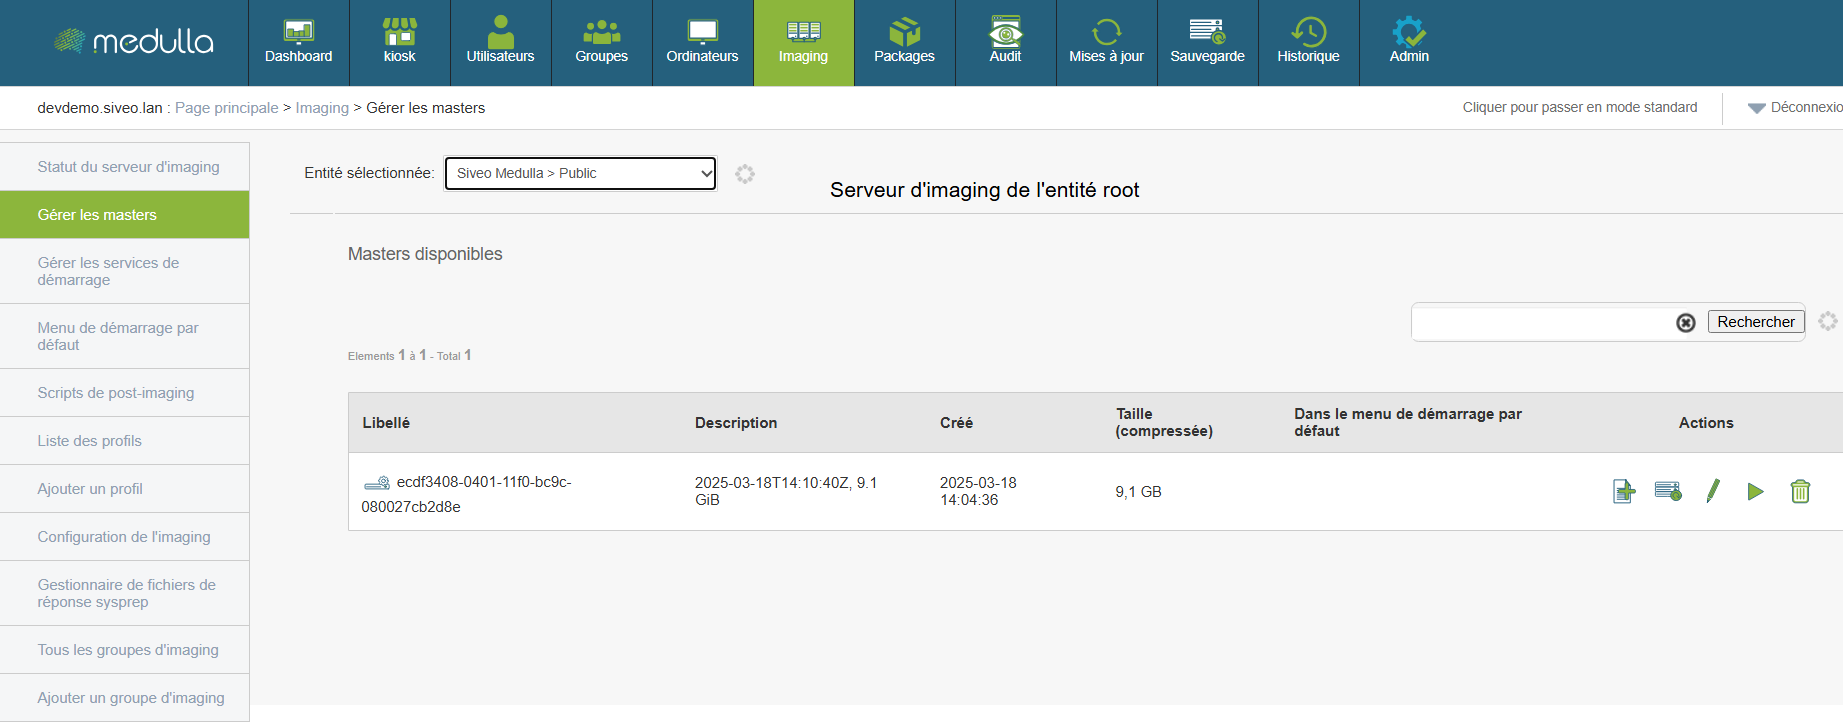
A master is a complete system image created from a configured workstation. It serves as a template for quickly and consistently deploying an environment to other machines.
Before any deployment, it is essential to know which masters are available and how to use them.
Reading the displayed information
Each master is presented as a line containing several elements:
-
Label: automatic identifier for the image.
-
Description: optional text describing the image’s content or purpose.
-
Creation date: indicates when the image was generated.
-
Compressed size: size of the image file (expressed in GB).
-
Default startup menu: specifies whether the image is used automatically during network startup.
-
Actions: set of options available for the image.
Use a master for deployment
-
Select a master from the list.
-
Check its date, description, and size to ensure it matches what you want to deploy.
-
Select the image as the basis for deploying one or more workstations via the dedicated interface.
The master system will be automatically installed on the target workstations, without requiring manual intervention on each machine.
Actions available for each image
For each master, you can perform several operations:
Before using a master, verify that it matches the desired configuration, including the operating system, version, and installed software. Only delete a master if you are certain it is no longer in use, as this action is irreversible. If you are unsure which image to choose or what action to take, it is recommended that you contact your technical support representative for guidance.
Manage startup services
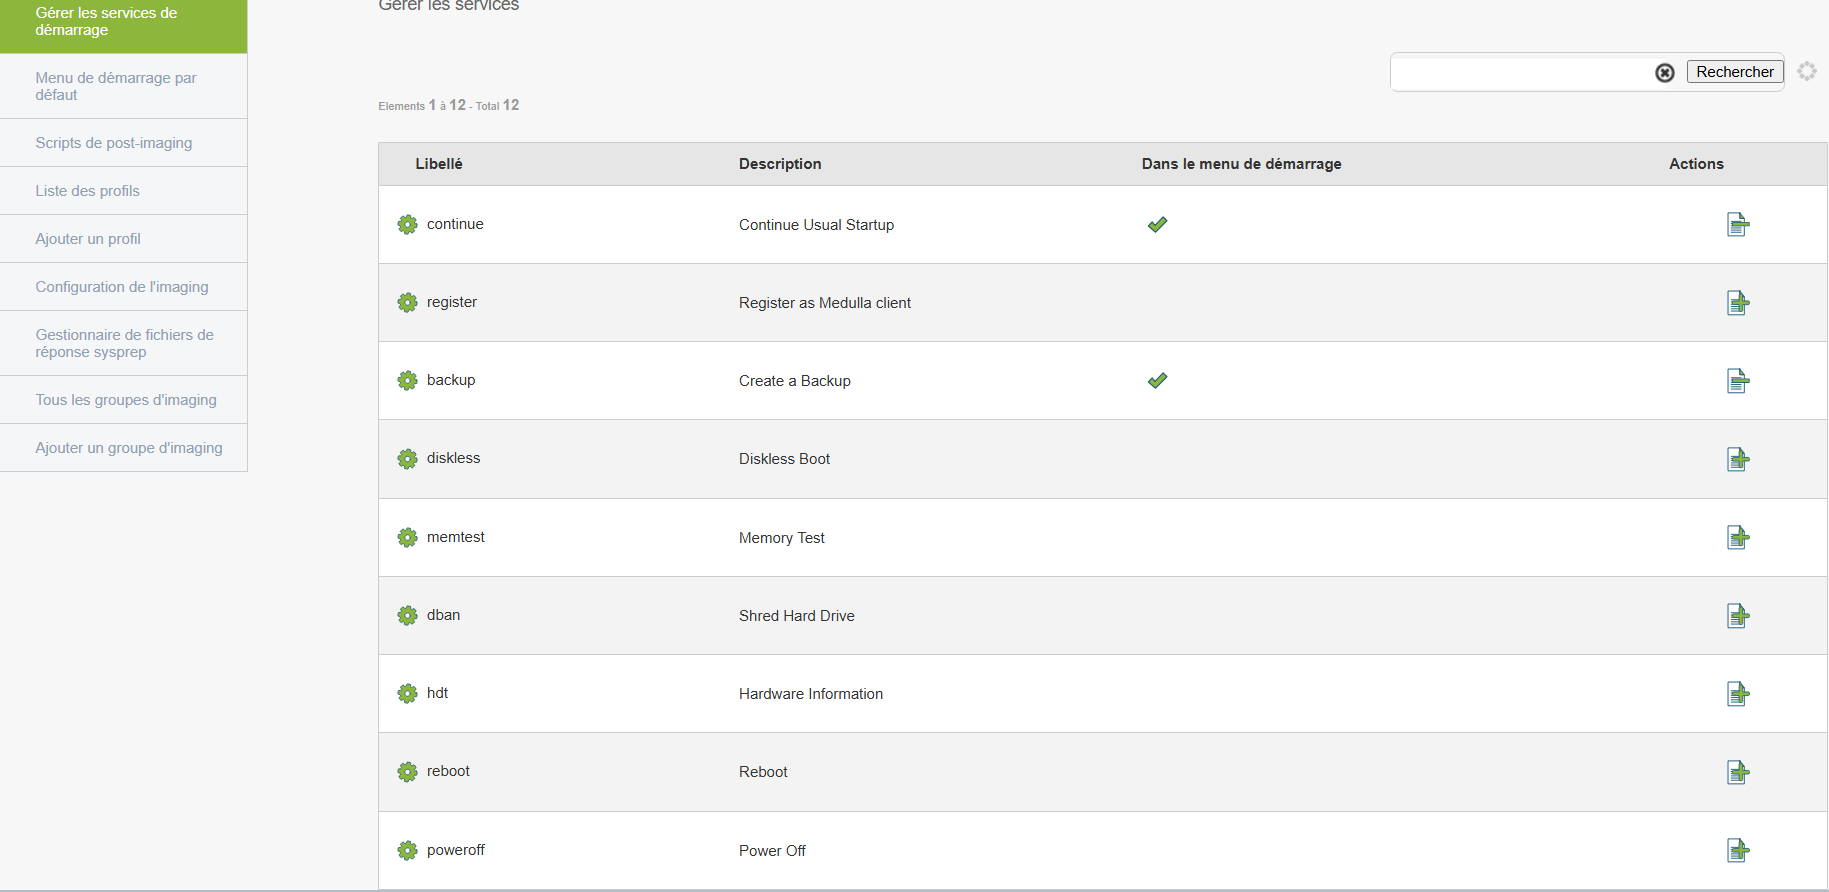
Boot services allow machines to boot an image from the network (via PXE, for example).
To configure
You can
-
Enable or disable certain services
-
Customize the boot process to suit your environment
Default startup menu
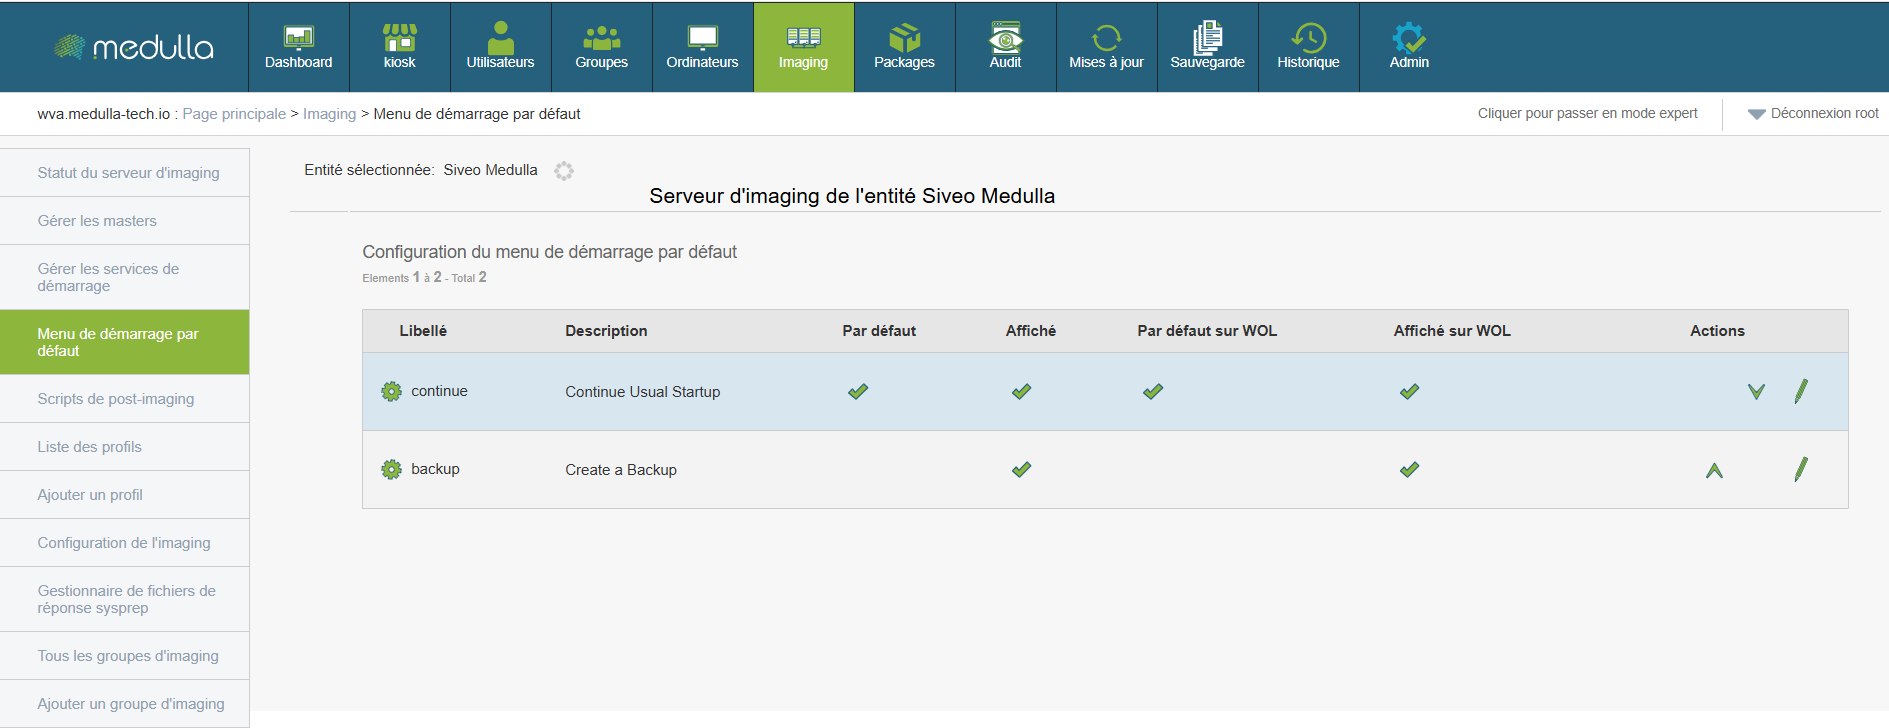
This section allows you to choose between automatic or manual behavior when machines start up.
Access
Available options
You can edit each option to adjust:
-
Default selection
-
Classic startup display or WOL (Wake On LAN)
Post-imaging scripts
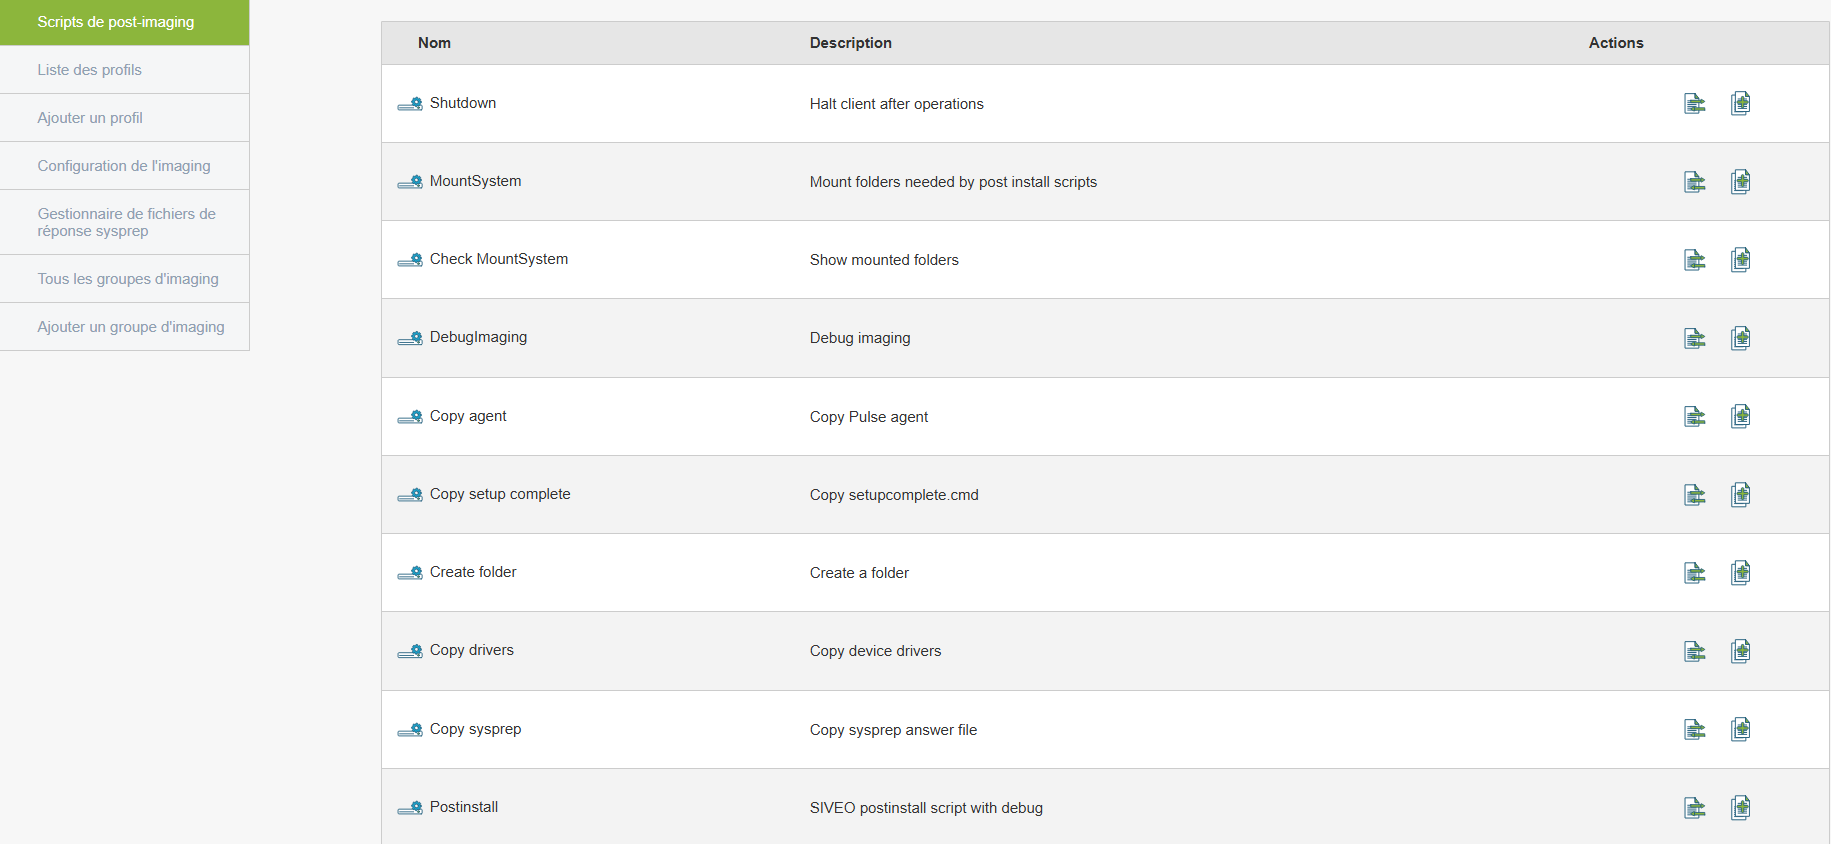
Allows you to automate actions after an image is deployed (such as installing software or configuring the network).
To create/edit a script
MountSystem
CopySysprep (the name of your sysprep without parentheses)
CopyRunAtOnce
CopyAgent
CopyDrivers
UseOEMBiosLicence (if you are using Windows OEM licenses)
-
Associate it with a deployment process
Here is what the post-install script options do:
MountSystem: copies the master image to the machine, mounts the partition(s), and detects the mount points for the various operations.
CopySysprep: retrieves the registered hostname from the PXE (the MAC/hostname association), adapts it in the answer file, and copies it to the Windows image under a generic name, unatended.xml.
CopyRunAtOnce: copies the setupcomplete.cmd file, which will be executed on the final Windows reboot. This file primarily serves to delete the unatended.xml file, which likely contains a user with domain join permissions.
CopyAgent: copies the Medulla-Agent-windows-FULL-latest.exe agent; it is also possible to pass a parameter to select the agent to deploy.
CopyDrivers: Copies the default drivers required by Windows 10.
UseOEMBiosLicence: Copies the license present in the BIOS and enters it into the post-installation sysprep file.
How Imaging Works
import_master.shOPTIONAL
Once the machine is properly registered, you will see the "backup" option in the menu to save the computer's image in order to create a master.
- First, you must back up a computer running a fresh copy of Windows straight out of the box. Then, when you boot it up, you must skip the OOBE (Out of Box Experience, the questions during Windows installation)
- Make sure there is no "pending reboot"; here is the command to check for one:
- You can then perform some basic Windows configurations if needed, such as creating a user account, etc.
- Run the prepare-master.ps1 script found here:
- Reboot the machine.
Creating a master
Chapter 7: Imaging II
Imaging profiles
Medulla features imaging profile management. These profiles allow you to associate a master with one or more postinstall configurations, enabling you to link the master and the profile either to specific machines, to imaging groups, or to apply it directly at the server level.
This simplifies the deployment of workstations via Medulla’s imaging module.
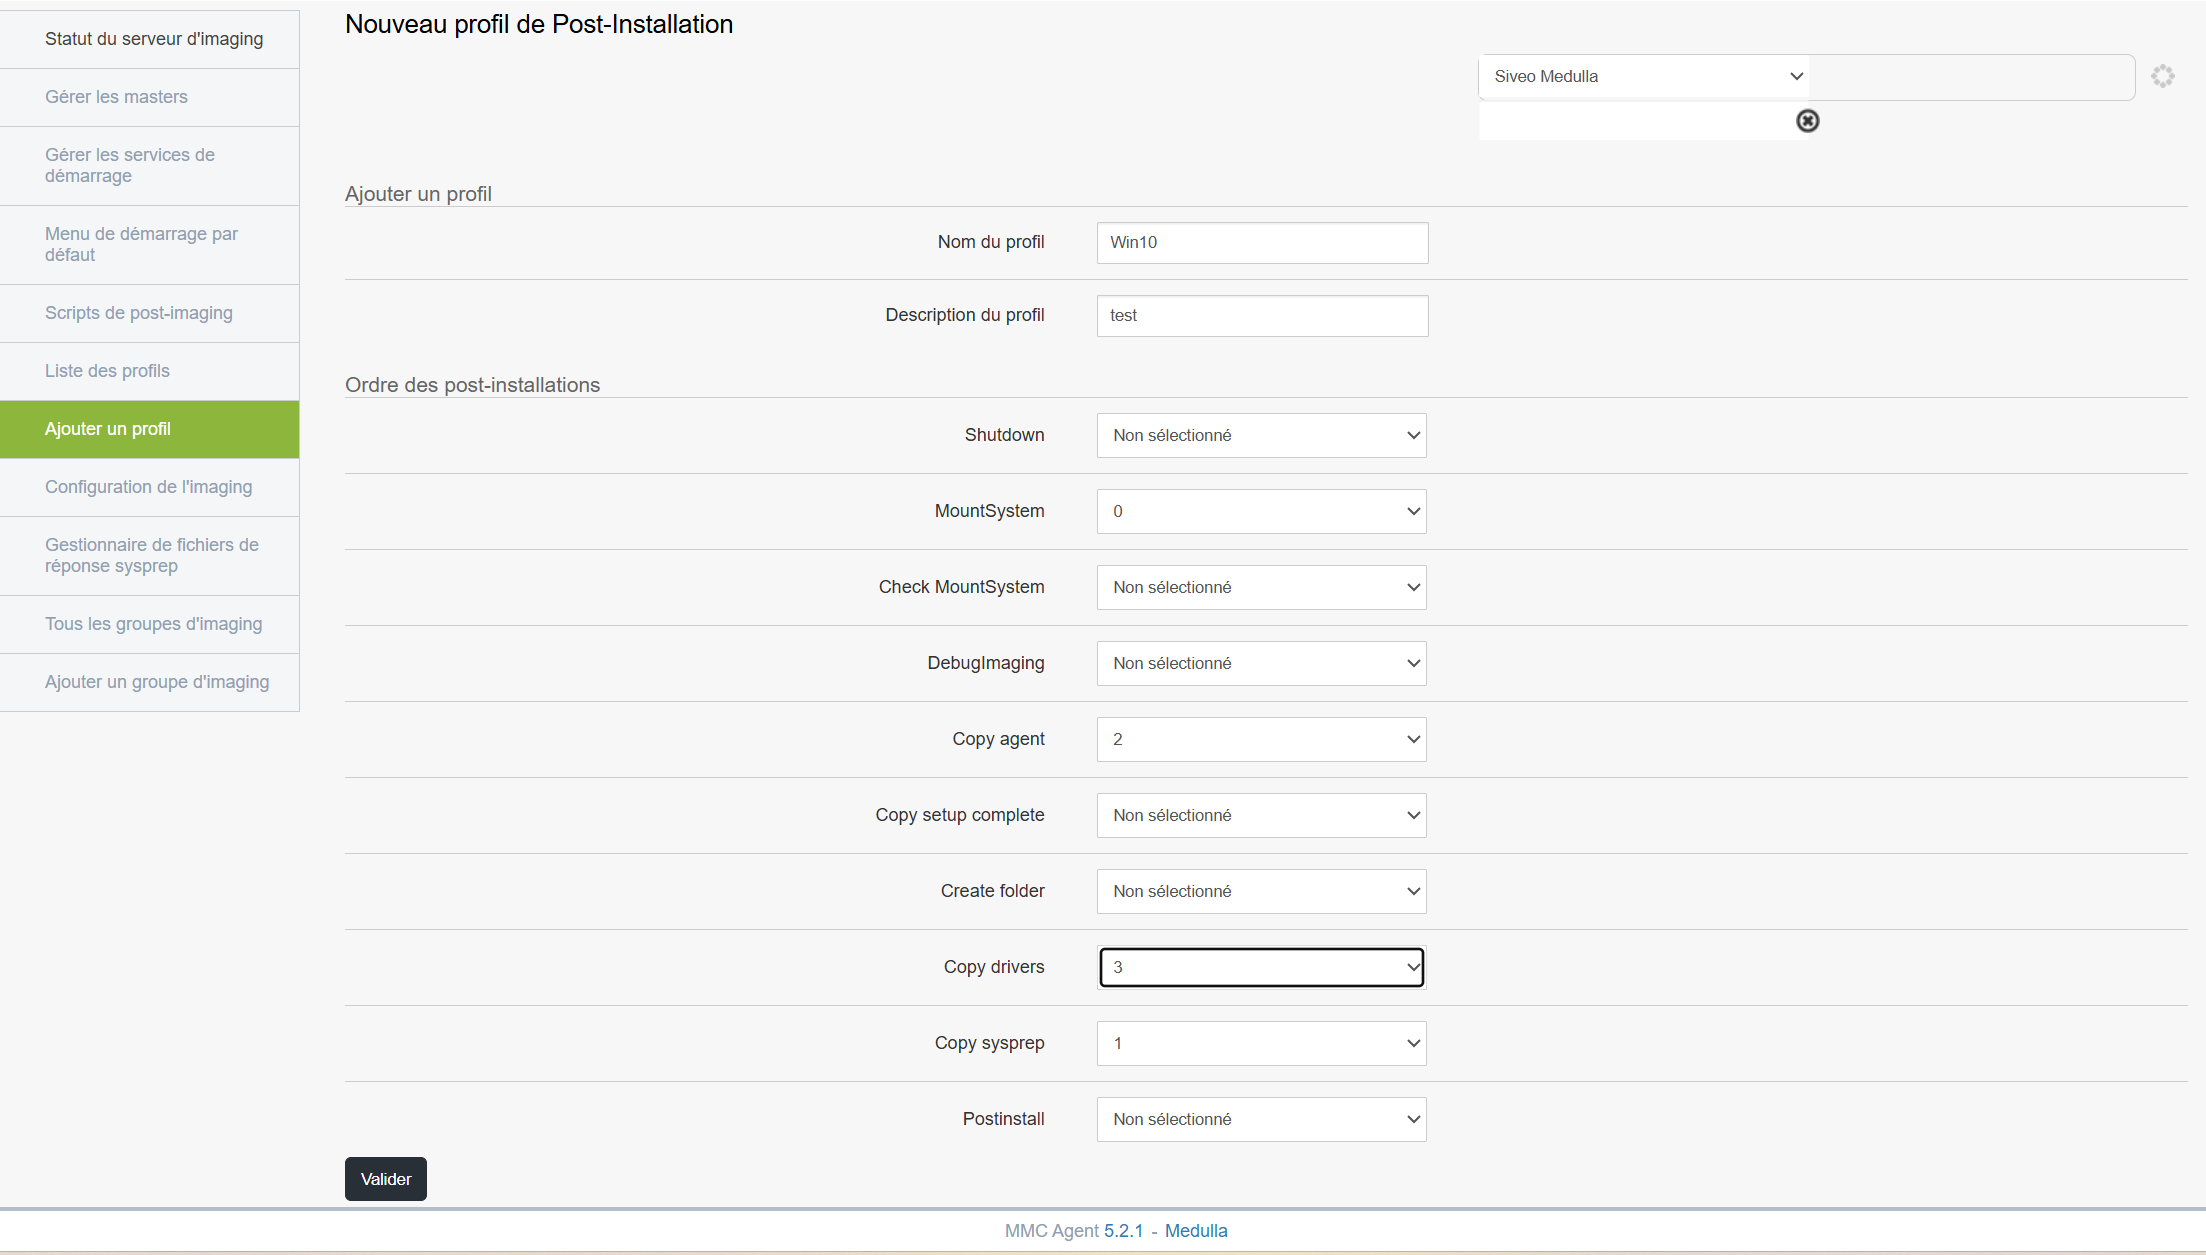
How do I create a profile for a machine and associate it with a master?
Click on Add a Profile.
Fill in the fields:
- Profile Name
- Description
In the Order section, select the post-installations you want to associate with the profile and arrange them in the order of execution from 0 to 10 (0 being the first step and 10 the last).
Click Save once you are finished.
Once the profile is validated, follow the steps below depending on how you want to associate your profile:
Associate a master with a profile on a machine:
In the Computers tab, click the left-hand menu: All GLPI Computers.
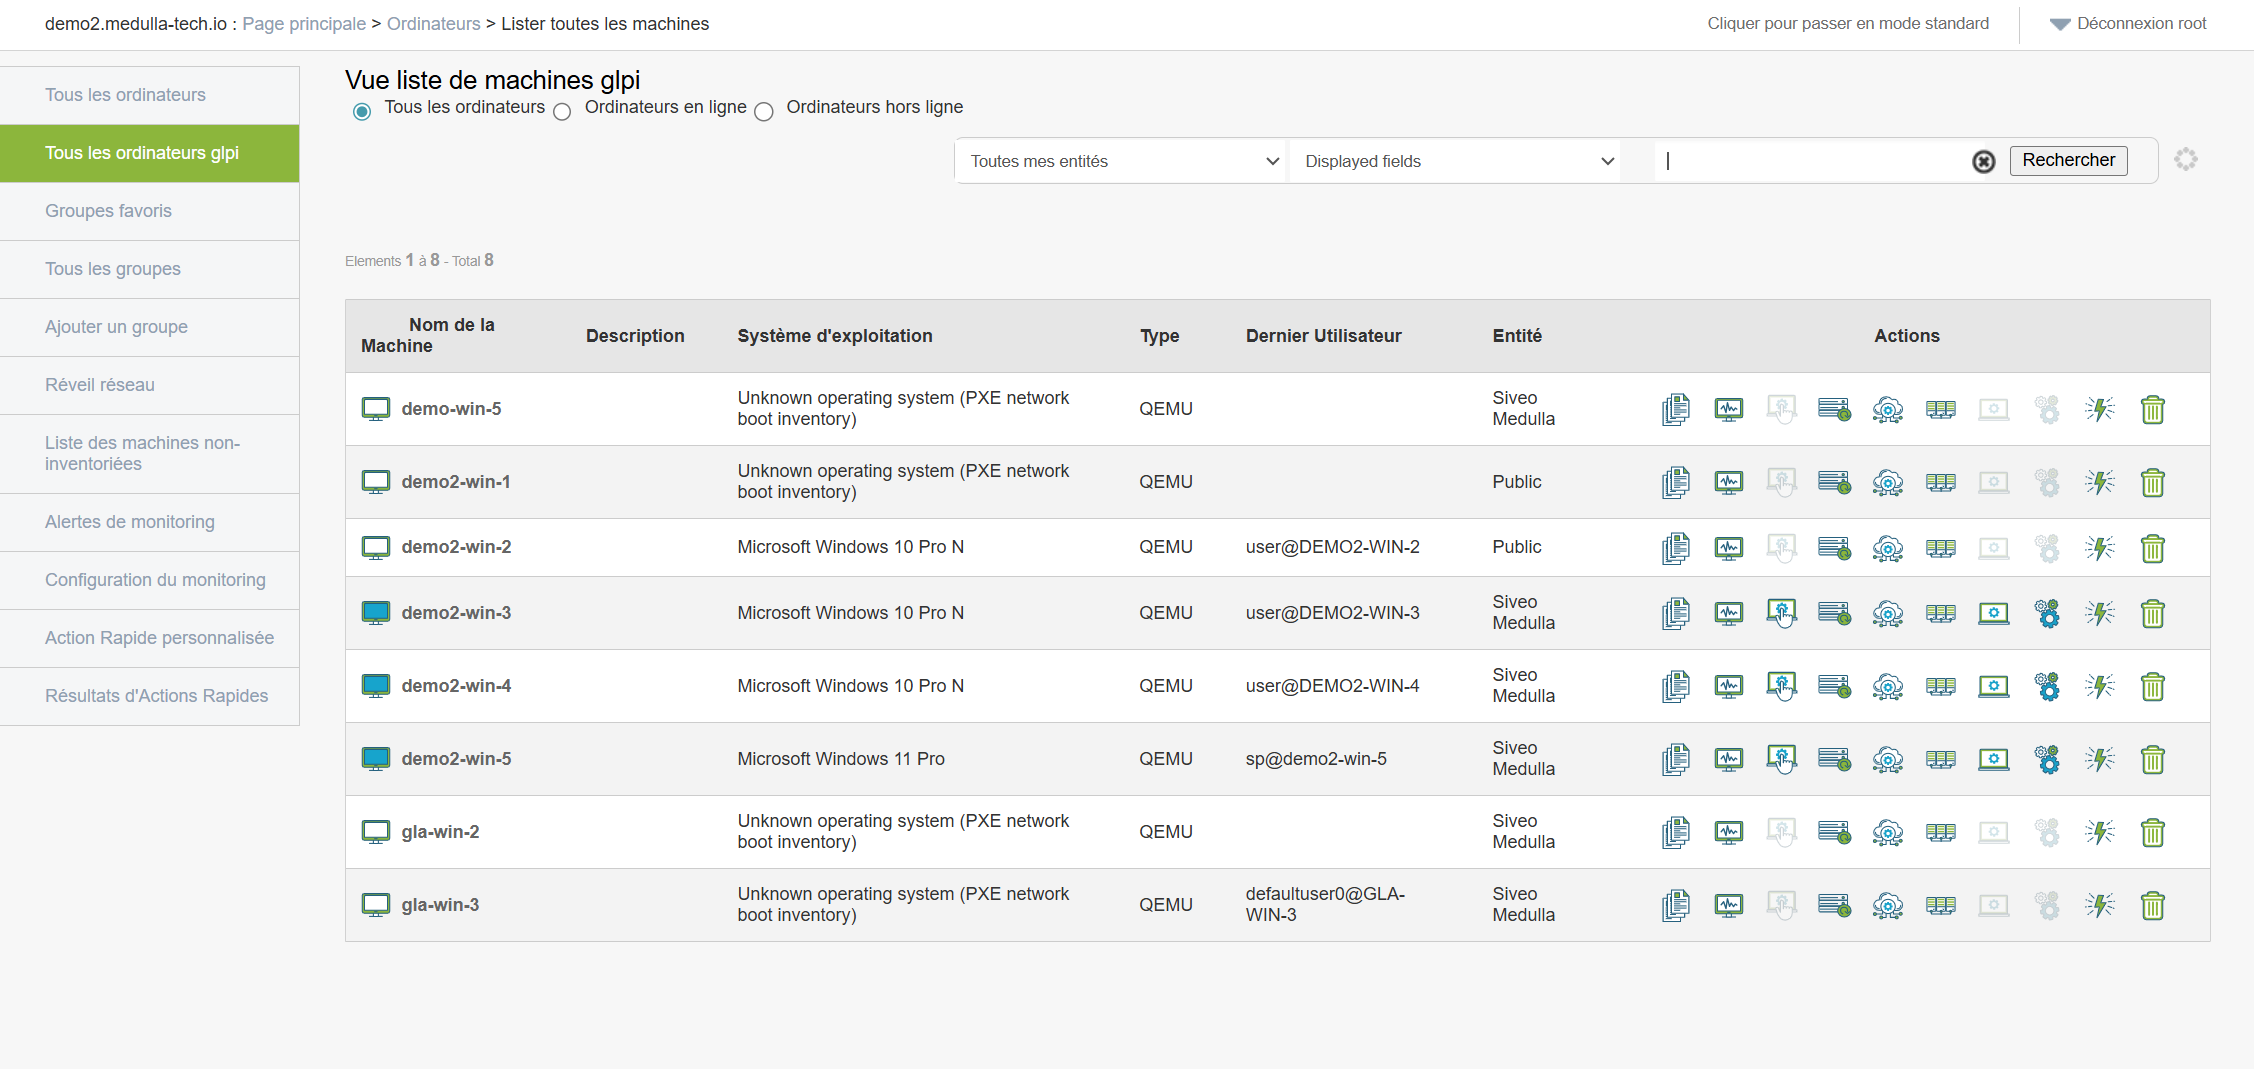
Select your machine and click the Imaging button: 
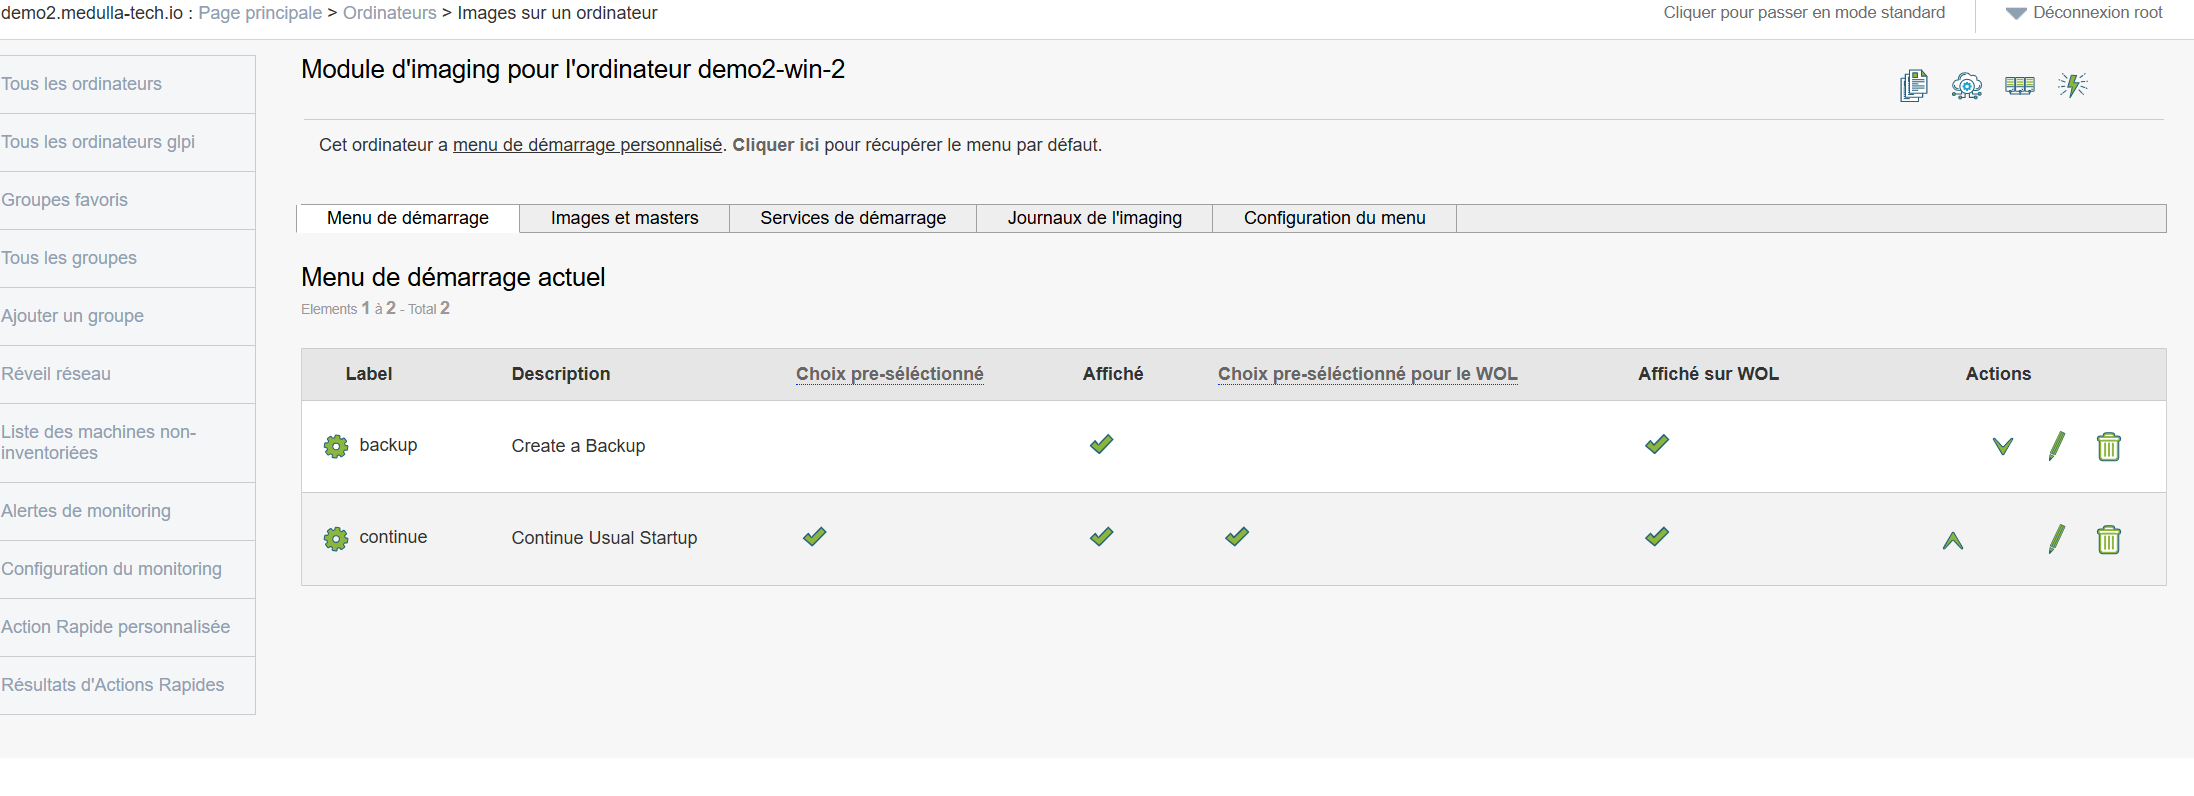
In the interface above, we have no master associated with the machine. To associate a master and a profile with this machine, follow the steps below: click on Image and Masters
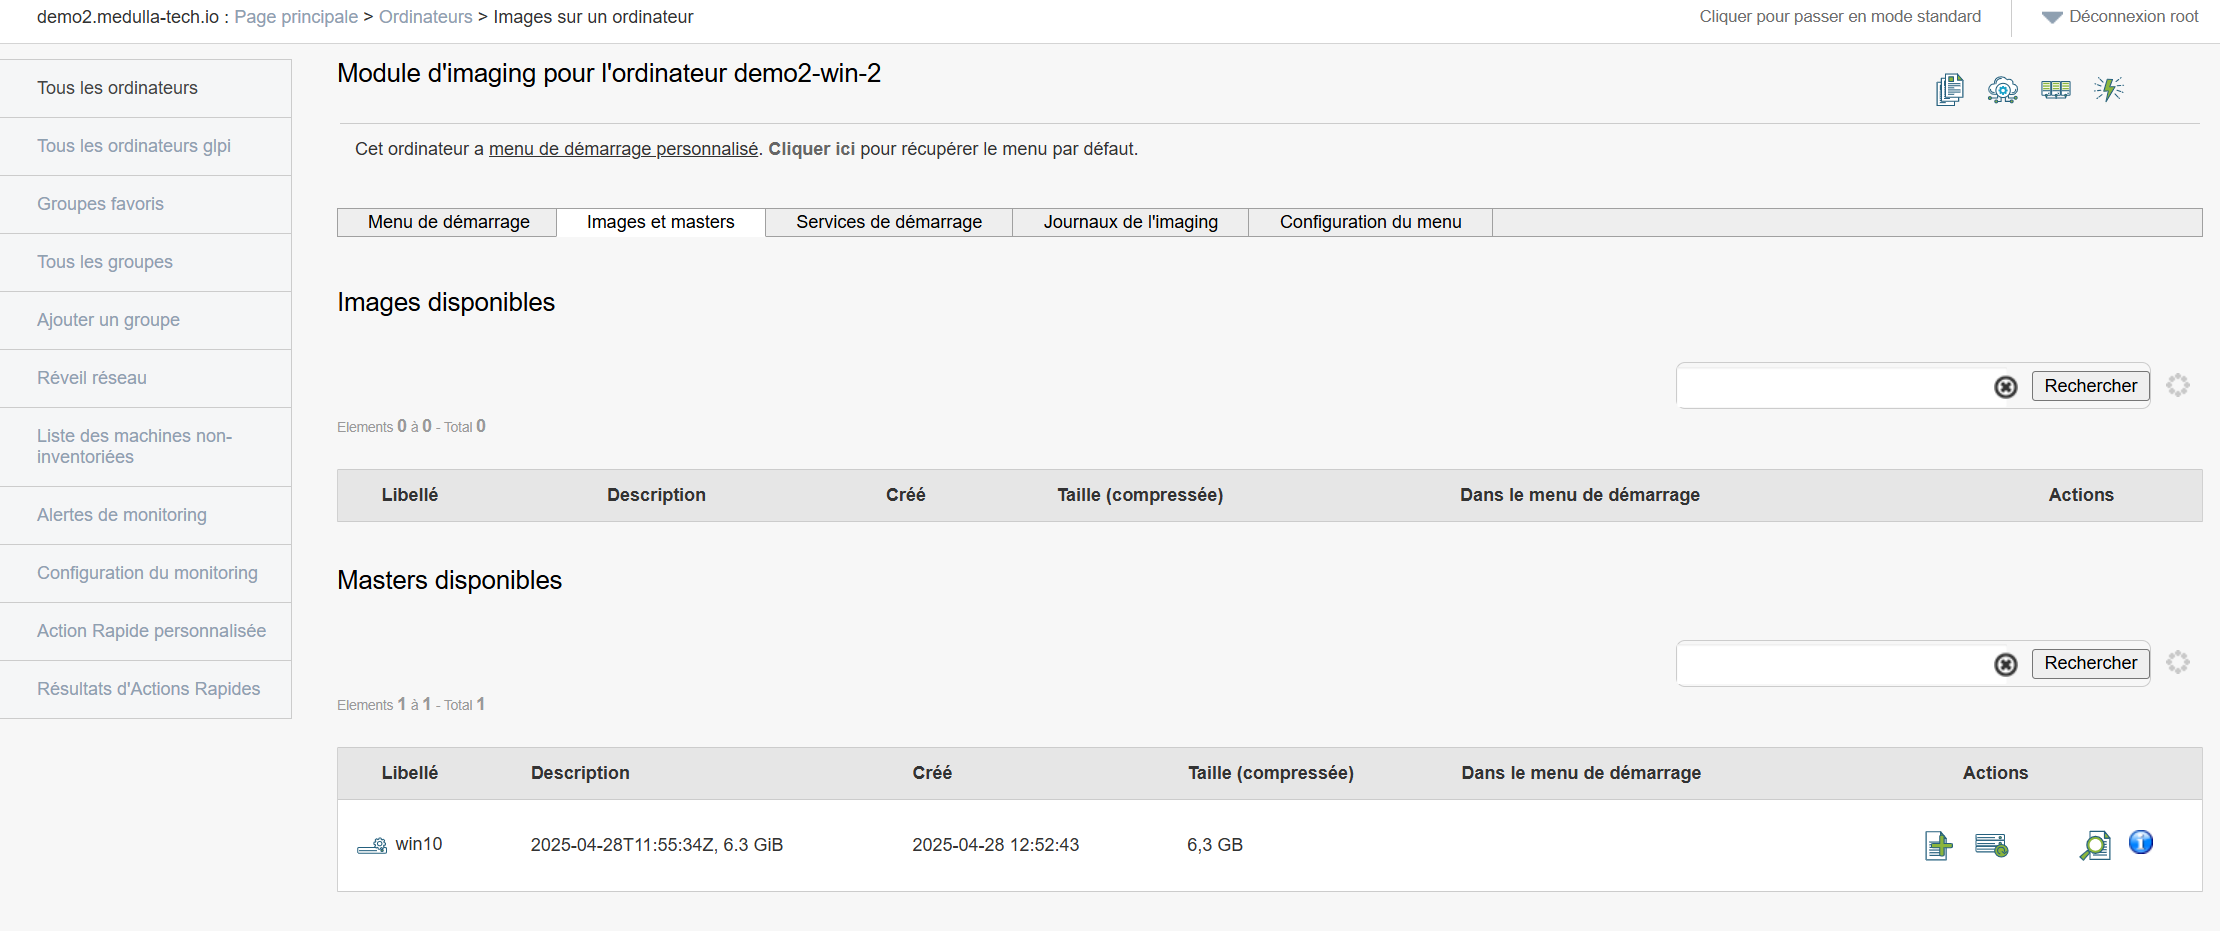
In the Available Masters section, click the Next button on the line of the master you want to select: 
A pop-up will appear as shown in the example below:
You can make your selection and click Confirm.
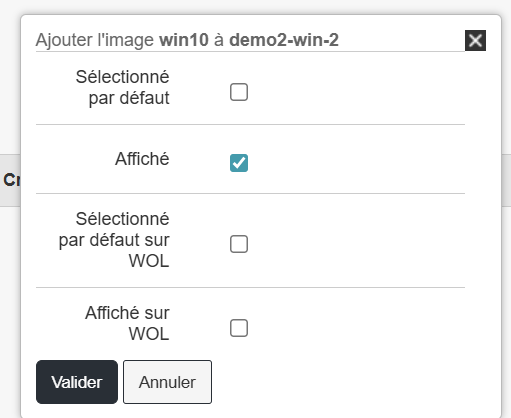
After that, the row changes and displays a small green checkmark in the " Added to Startup Menu" field:

Return to the Startup Menu tab;
Click the "Edit" button for the master you just added: 
Check the profile you want to associate with the master for this machine: In my example, I selected the OfficeProfile.
Then click "Confirm."
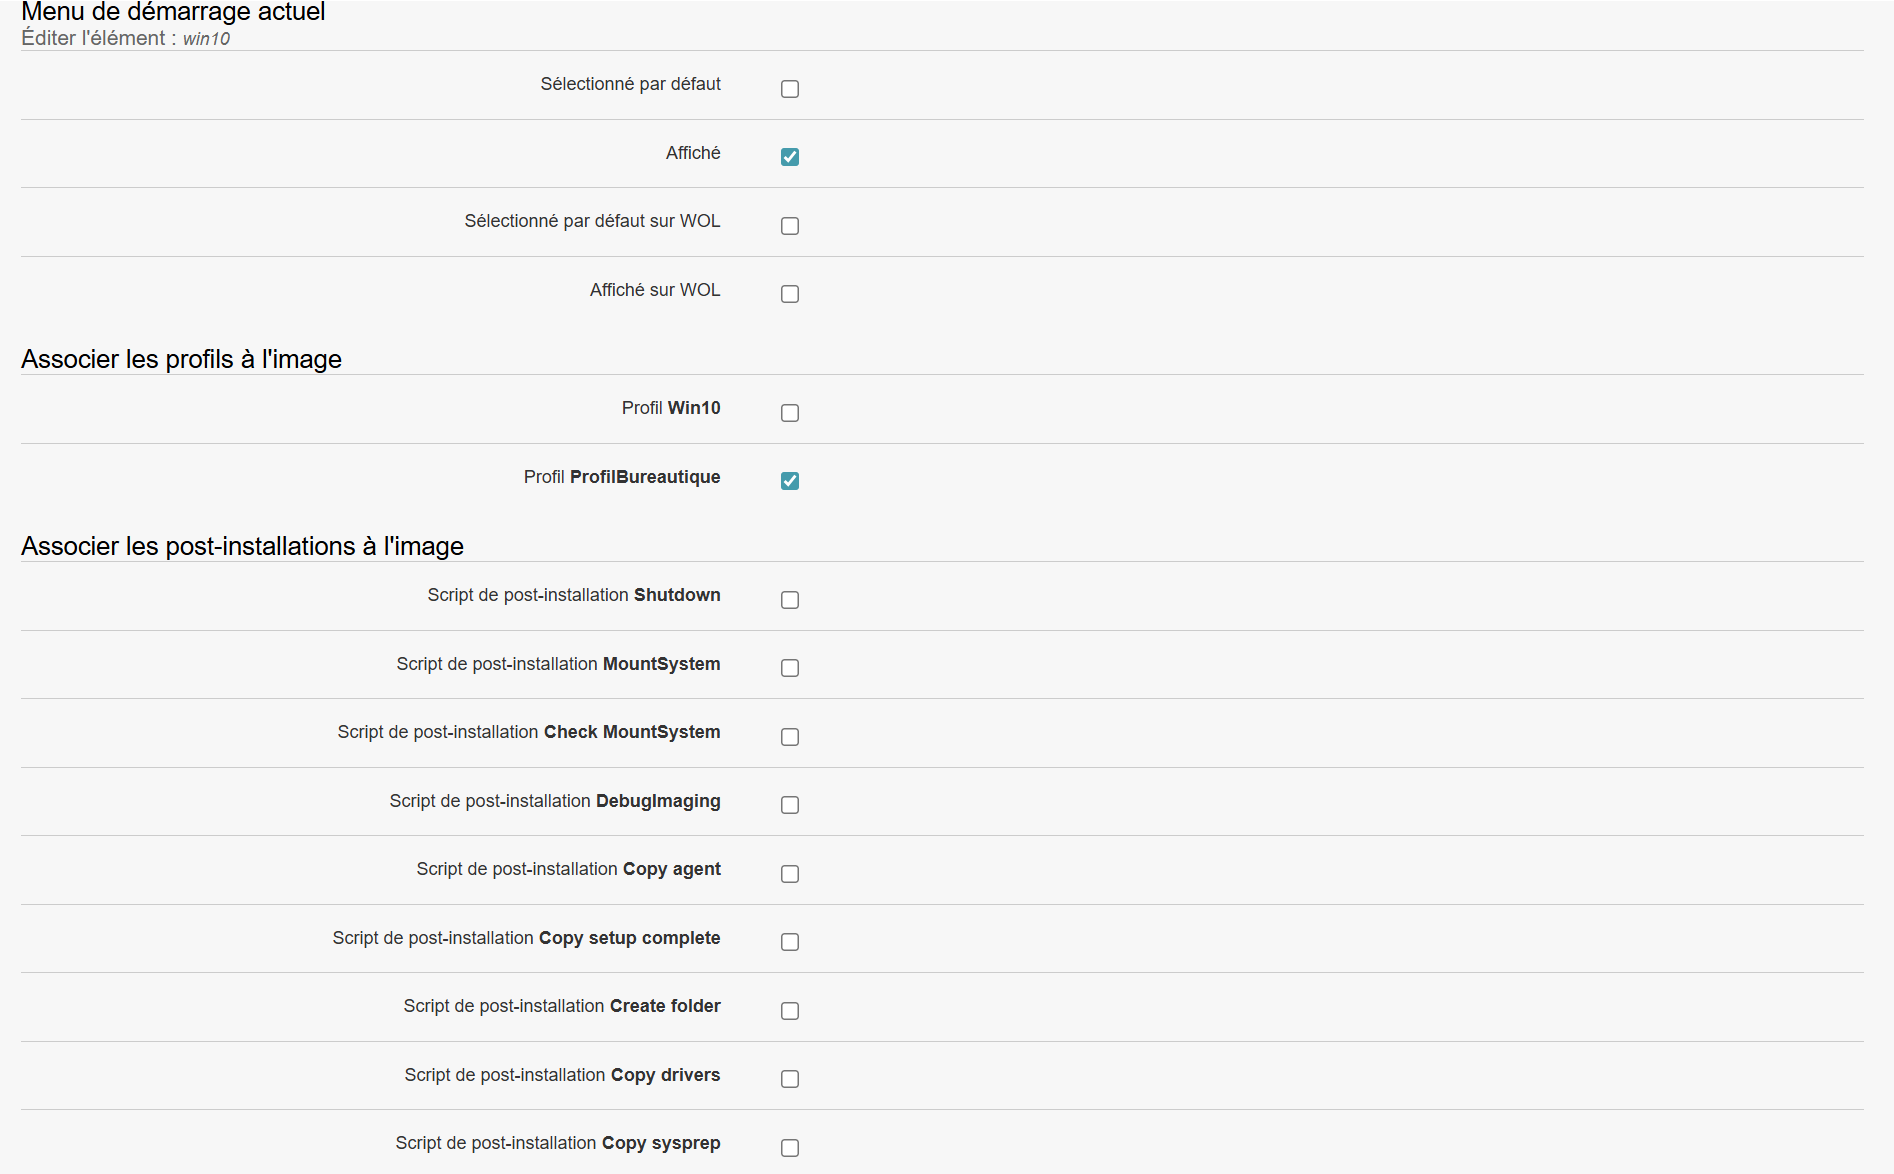
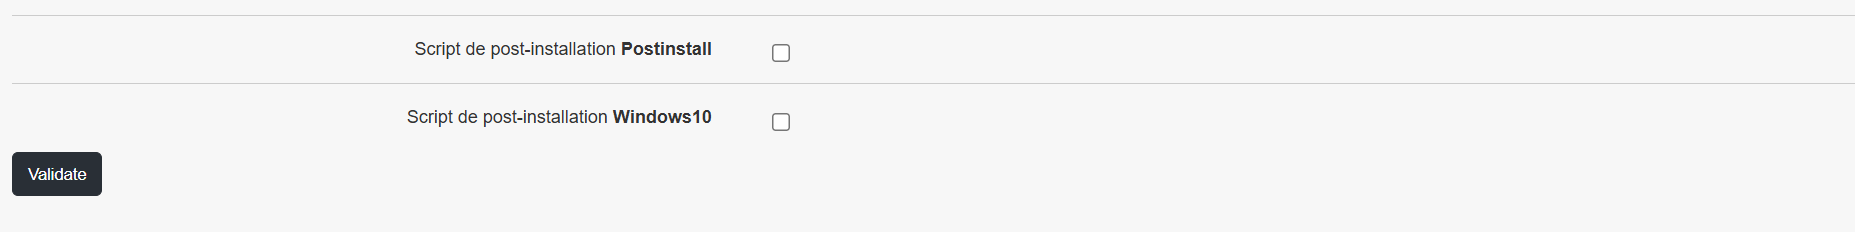
The master is now associated with one or more post-installations.
Next, boot your machine via PXE, and Medulla will automatically offer the master with the associated profile.
You can perform the same steps on an imaging group or via the default boot menu of the imaging server.
Add a profile
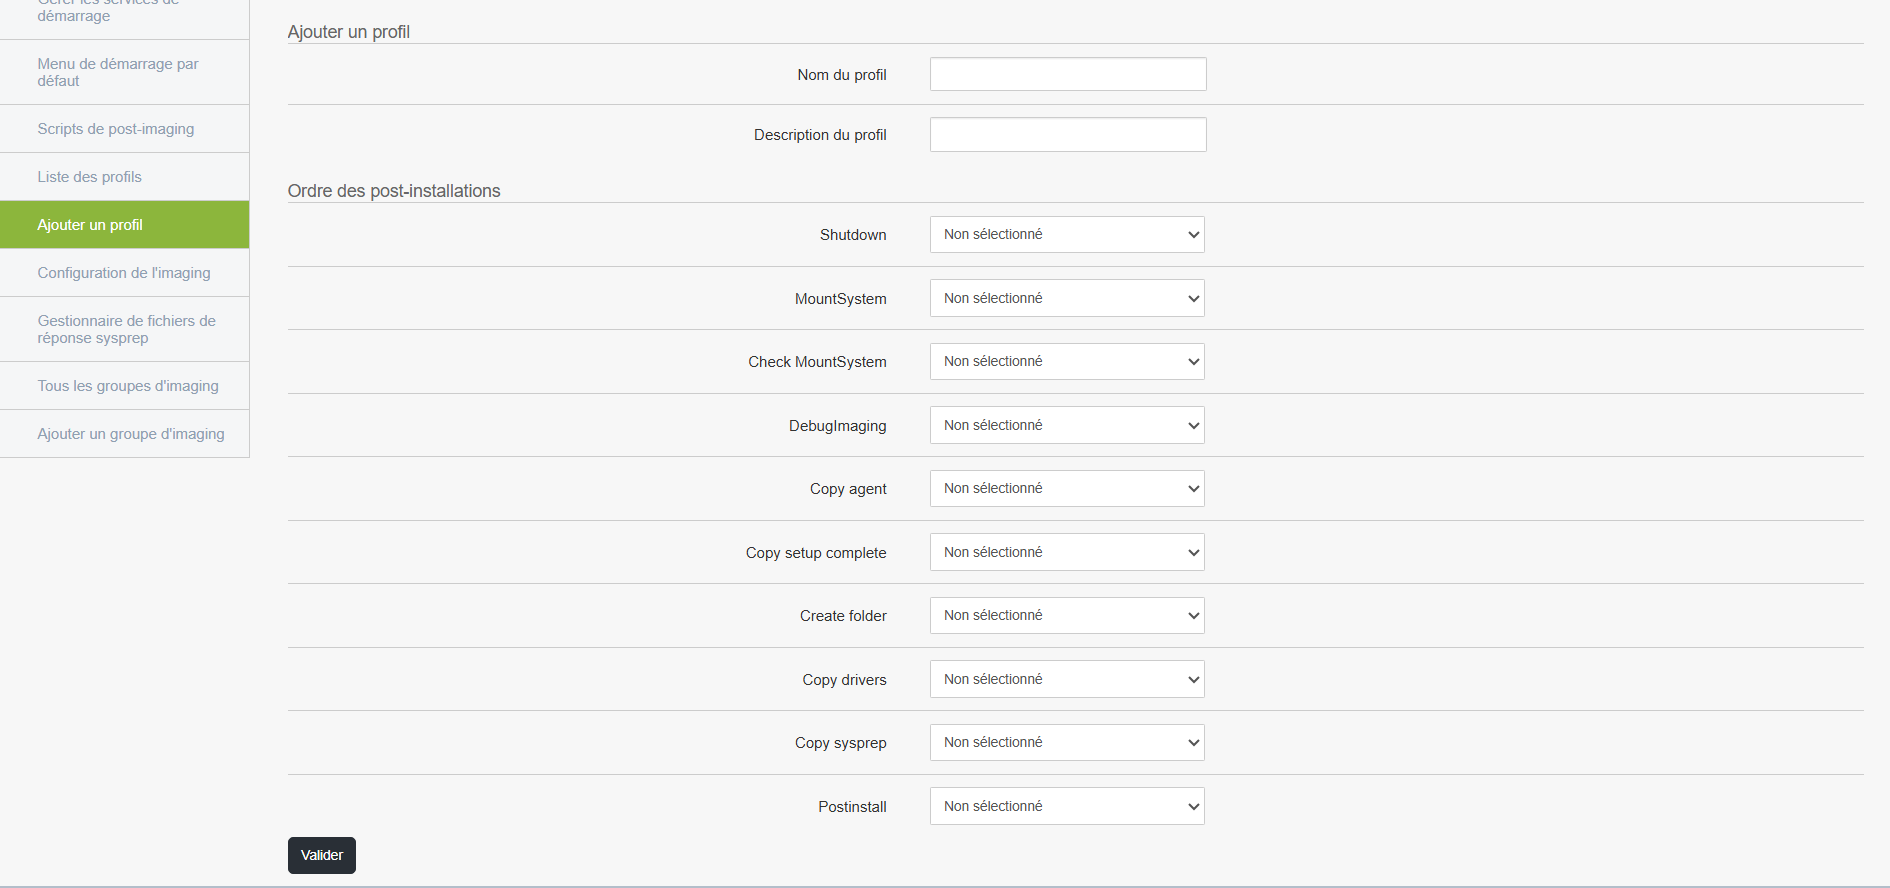
A profile allows you to associate post-installation actions with a master and to add this profile to the machine’s boot menu when booting the machine via PXE.
Accessing and editing a profile
From the management interface, you can:
- Add a new profile
- Edit an existing profile
- Delete a profile if necessary
List of available post-installation actions
Here are the actions that can be configured in the desired order.
All are disabled by default; you must select them manually if you wish to apply them:
-
Shutdown: automatically shuts down the machine once all steps are complete.
-
MountSystem: mounts the system partitions, useful for accessing certain files before deployment is complete.
-
Check MountSystem: Verifies that the system has been successfully mounted.
-
DebugImaging: Enables a diagnostic mode to analyze the imaging process (primarily used by technicians).
-
Copy agent: Copies the Medulla agent to the computer, required for remote management.
-
Copy setup complete: adds a file or script to run at the end of the installation.
-
Create folder: creates one or more custom folders on the computer.
-
Copy drivers: Copies the necessary drivers to the target machine.
-
Copy sysprep: installs files related to Windows system preparation (Sysprep).
-
Postinstall: entry point to run a custom script or command once installation is complete.
Using the profile
-
Create or modify a profile according to the specific needs of your organization or the target computer.
-
Select the desired actions in the appropriate order of execution.
- Associate the profile with a master
- Run this profile when the machine you want to install boots up.
This profile will then be associated with a deployment task, so that the selected steps are automatically applied after installation.
List of profiles
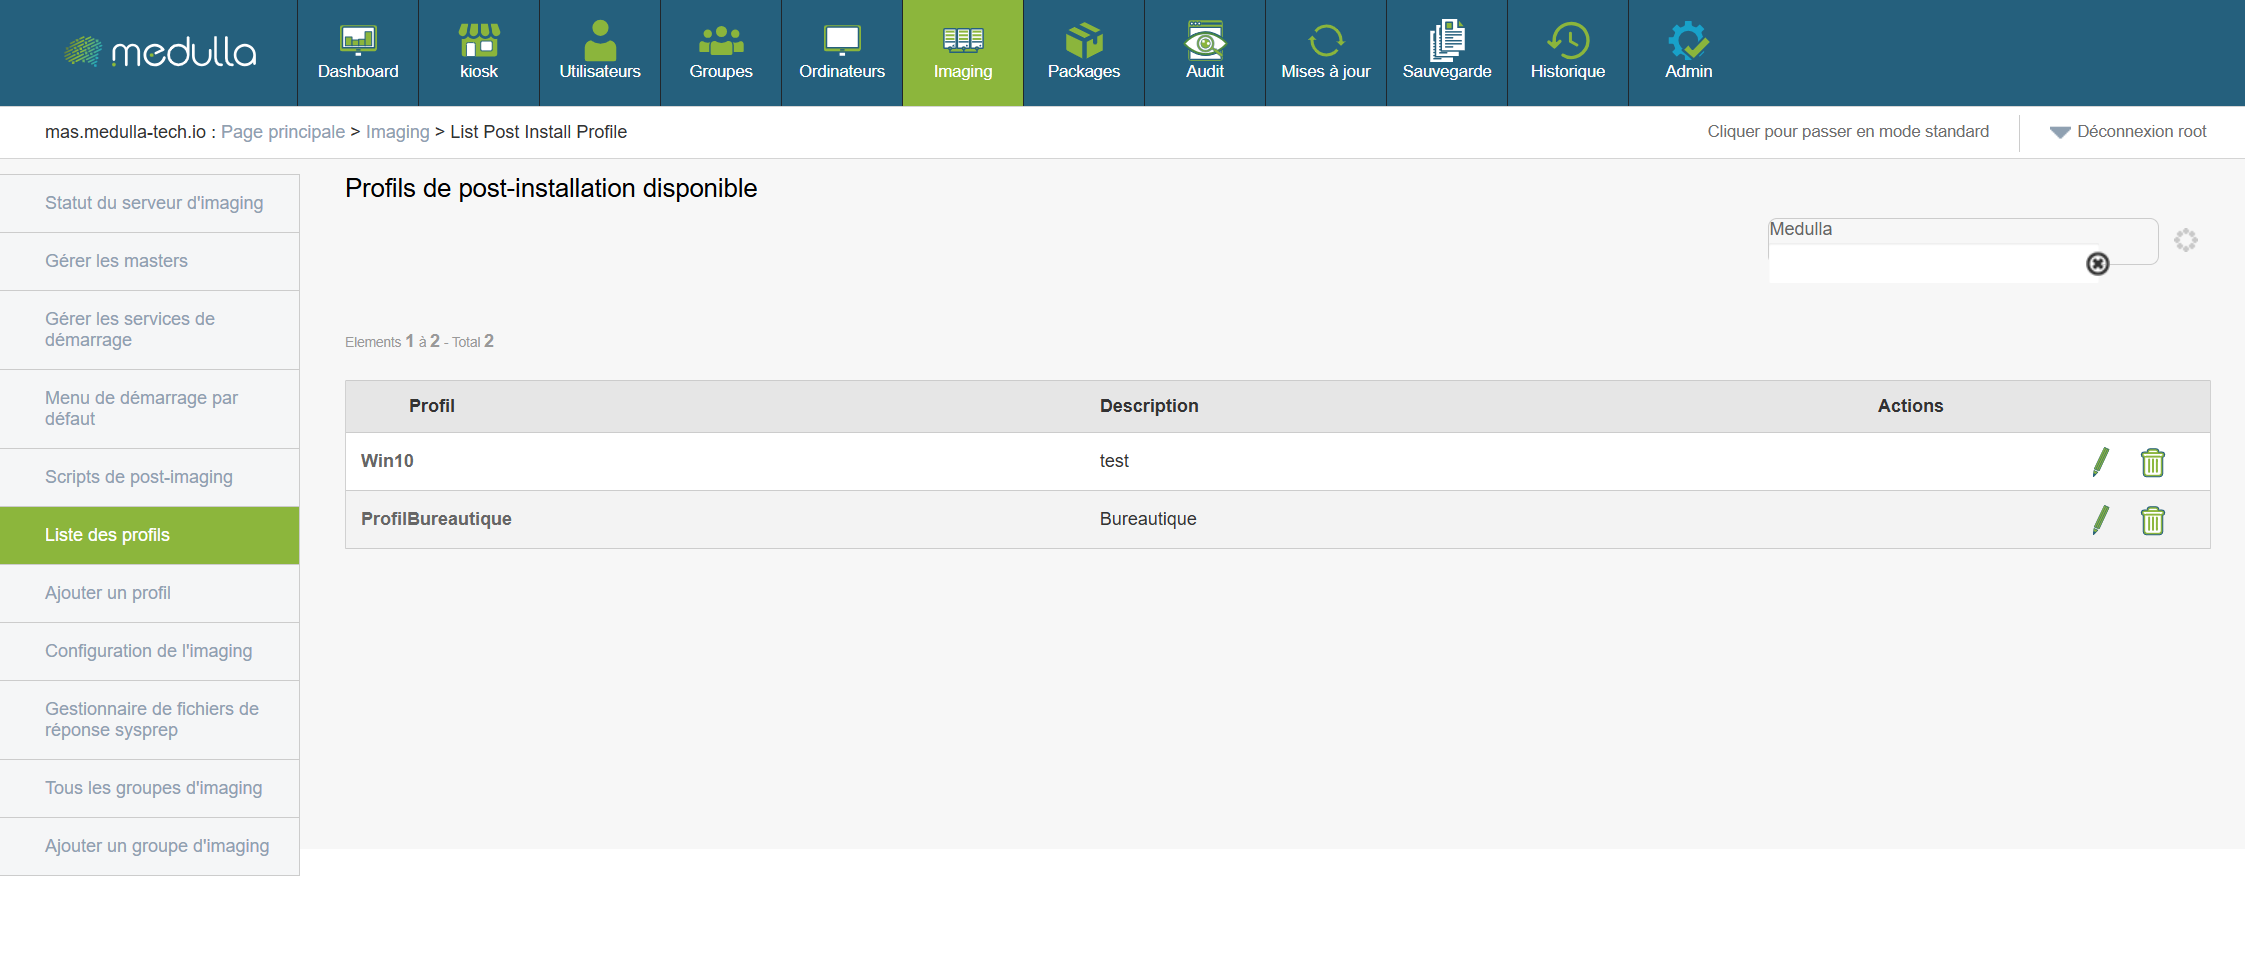
Displays all user profiles created for imaging.
Central area displaying profiles
- Name
- Status (Active/Inactive)
- Available actions: Edit, Delete
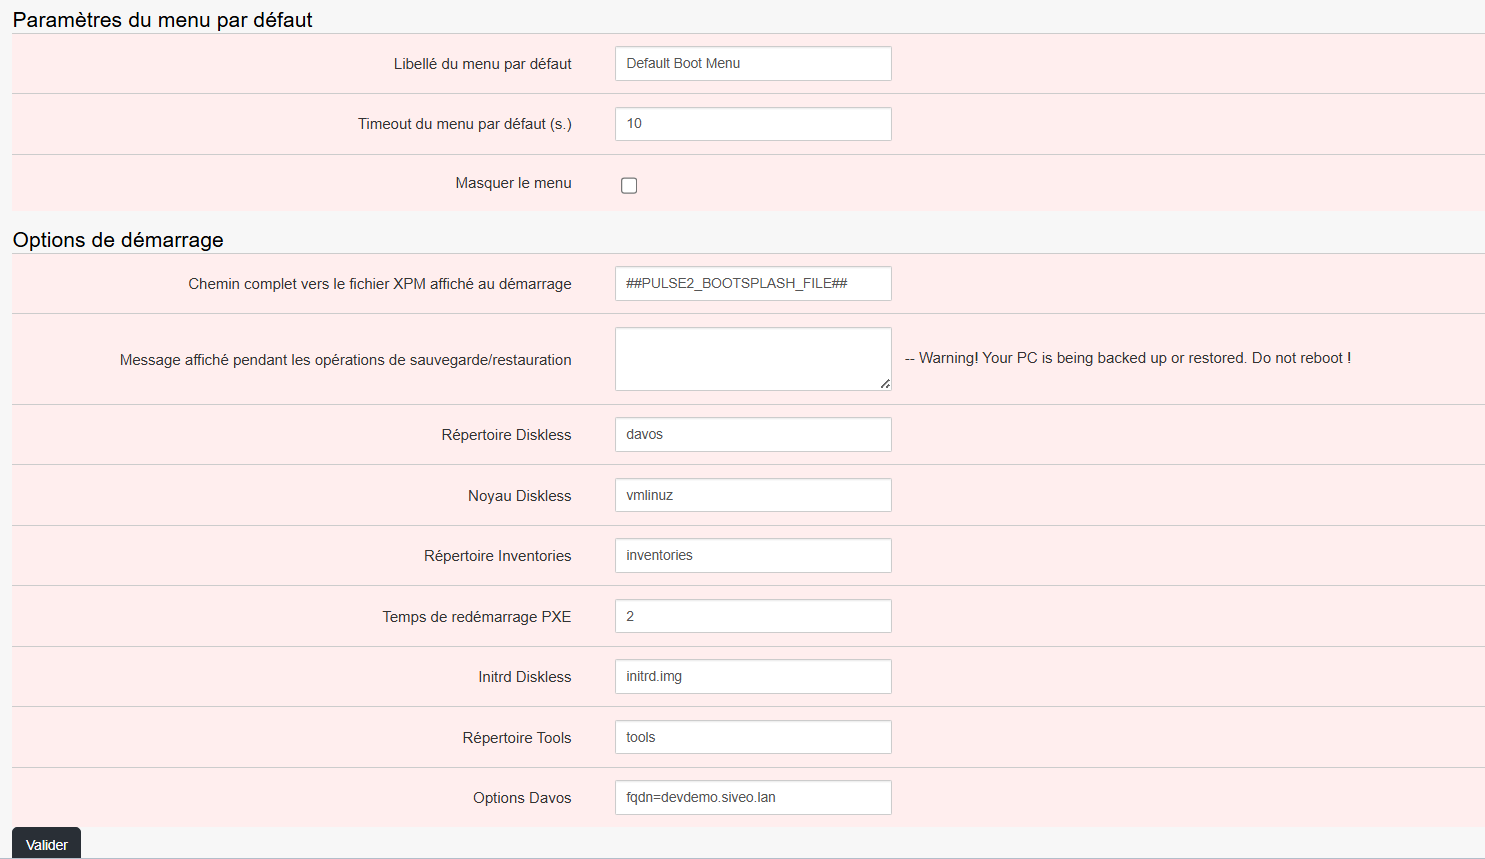
Imaging Configuration
Allows you to adjust the global settings of the imaging environment (e.g., servers used, policies, etc.)
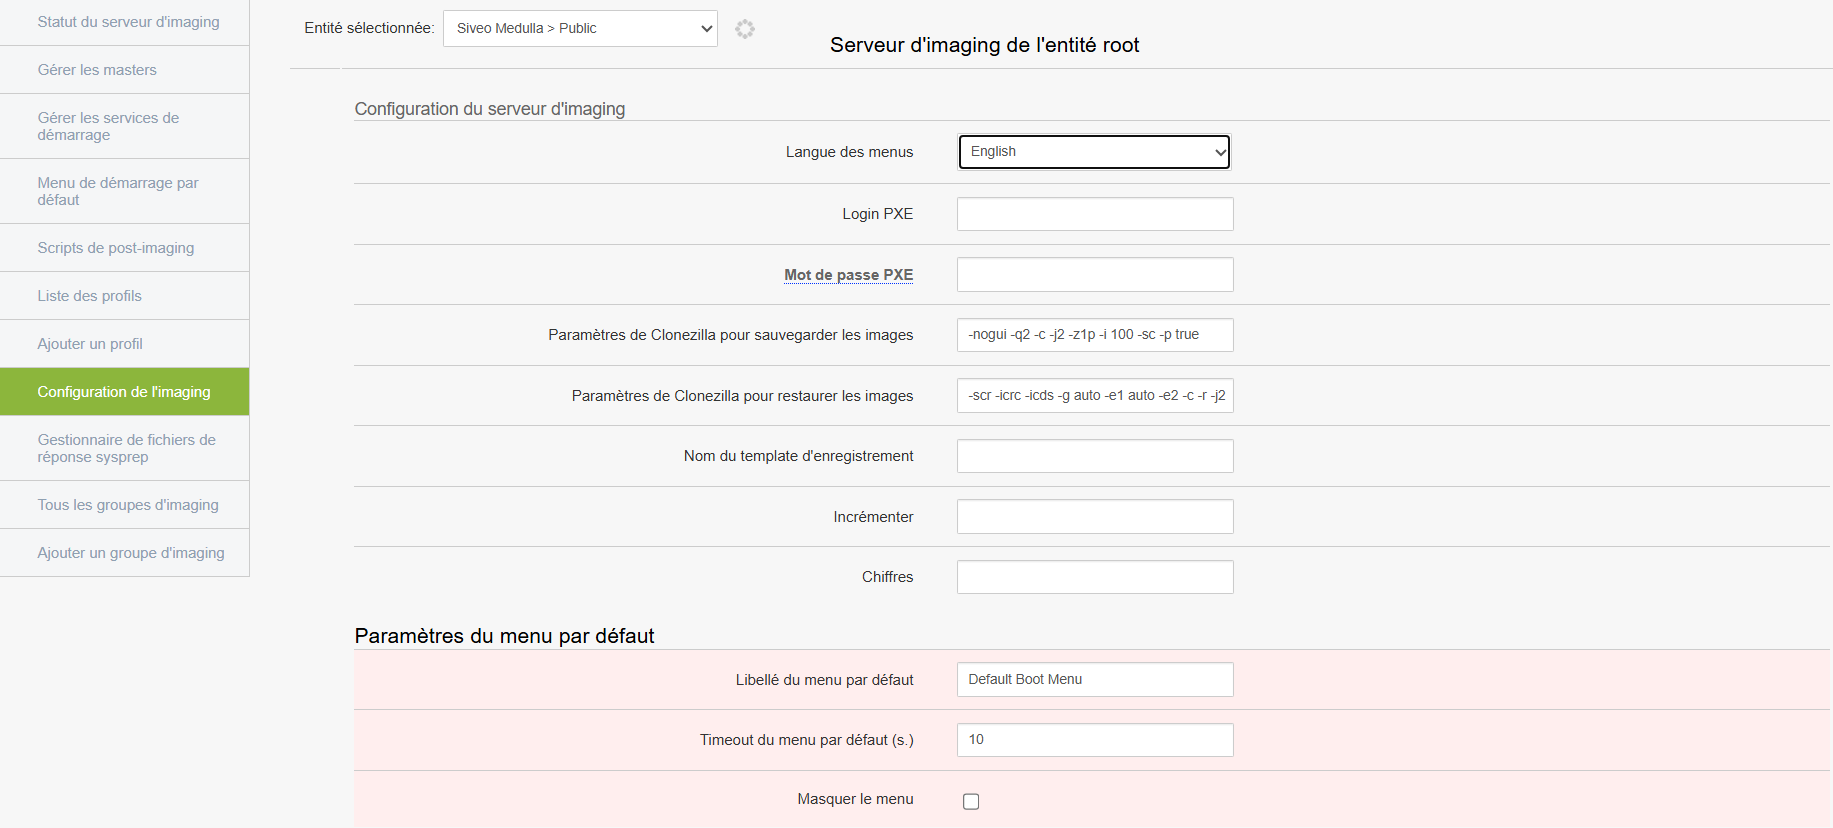
Modify the necessary settings
Warning: this section can affect the entire environment → intended for experienced administrators only.
Sysprep Response File Manager
Allows you to manage the response files used during automated Windows installation.
At the top of the page, you can select the OS, the version, and whether sysprep should take OEM into account:
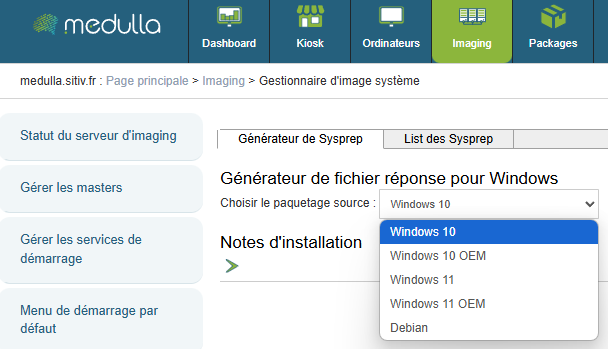
Then fill in the necessary information.
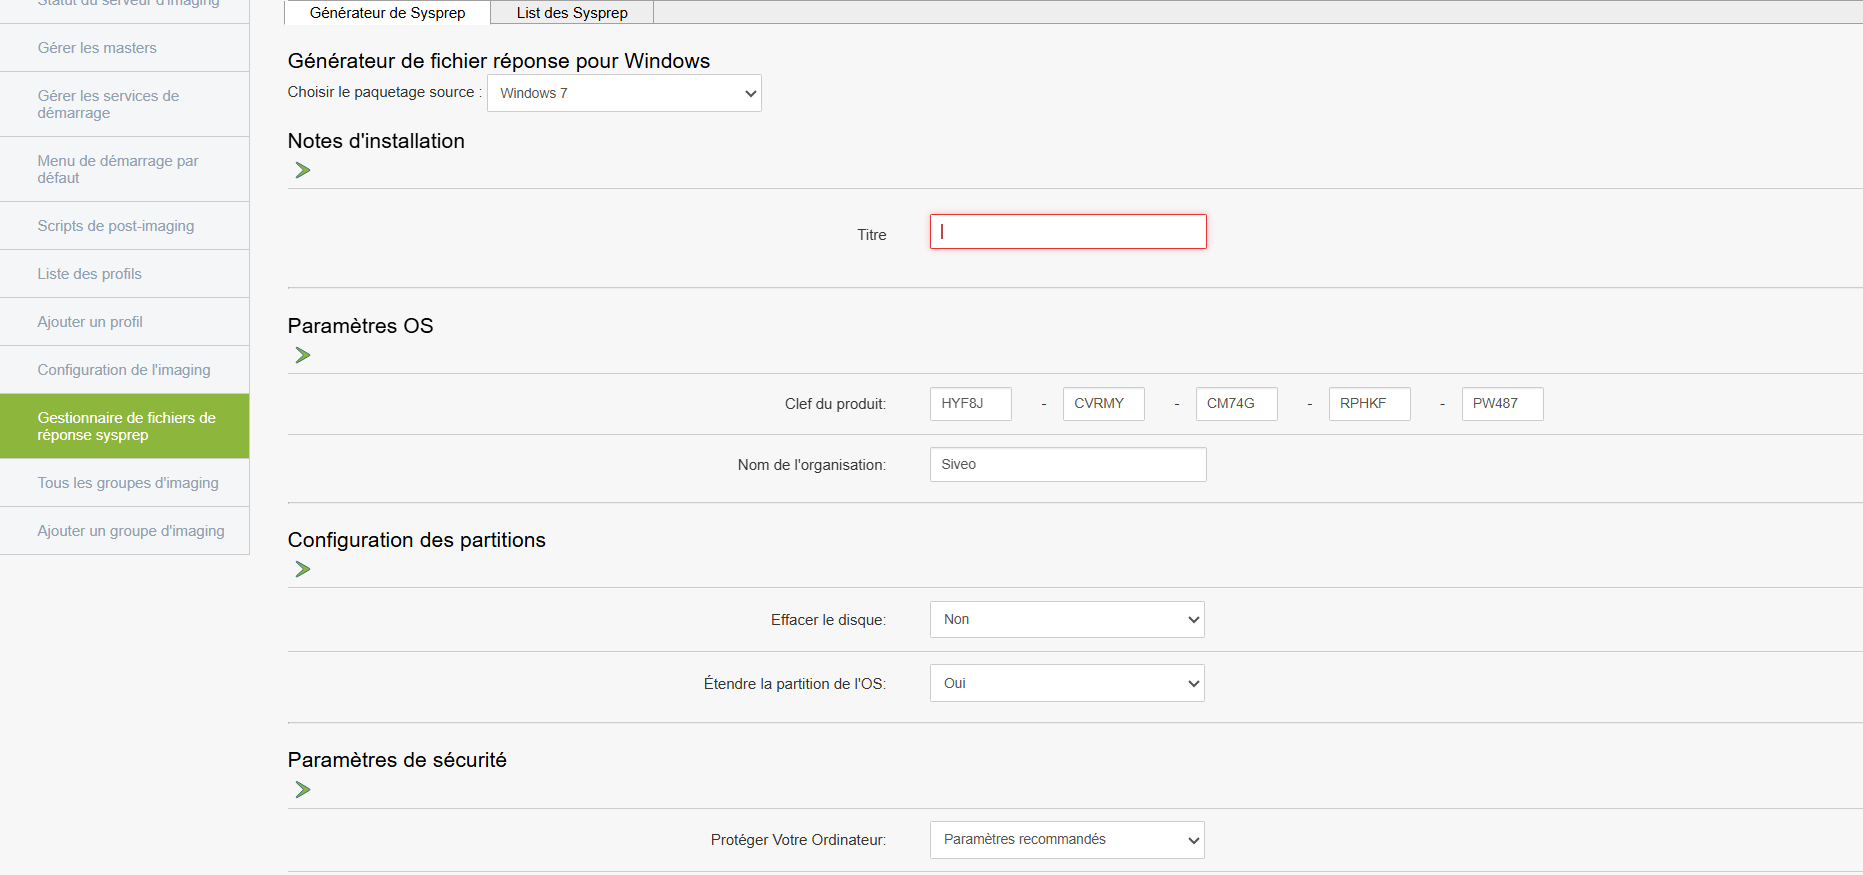
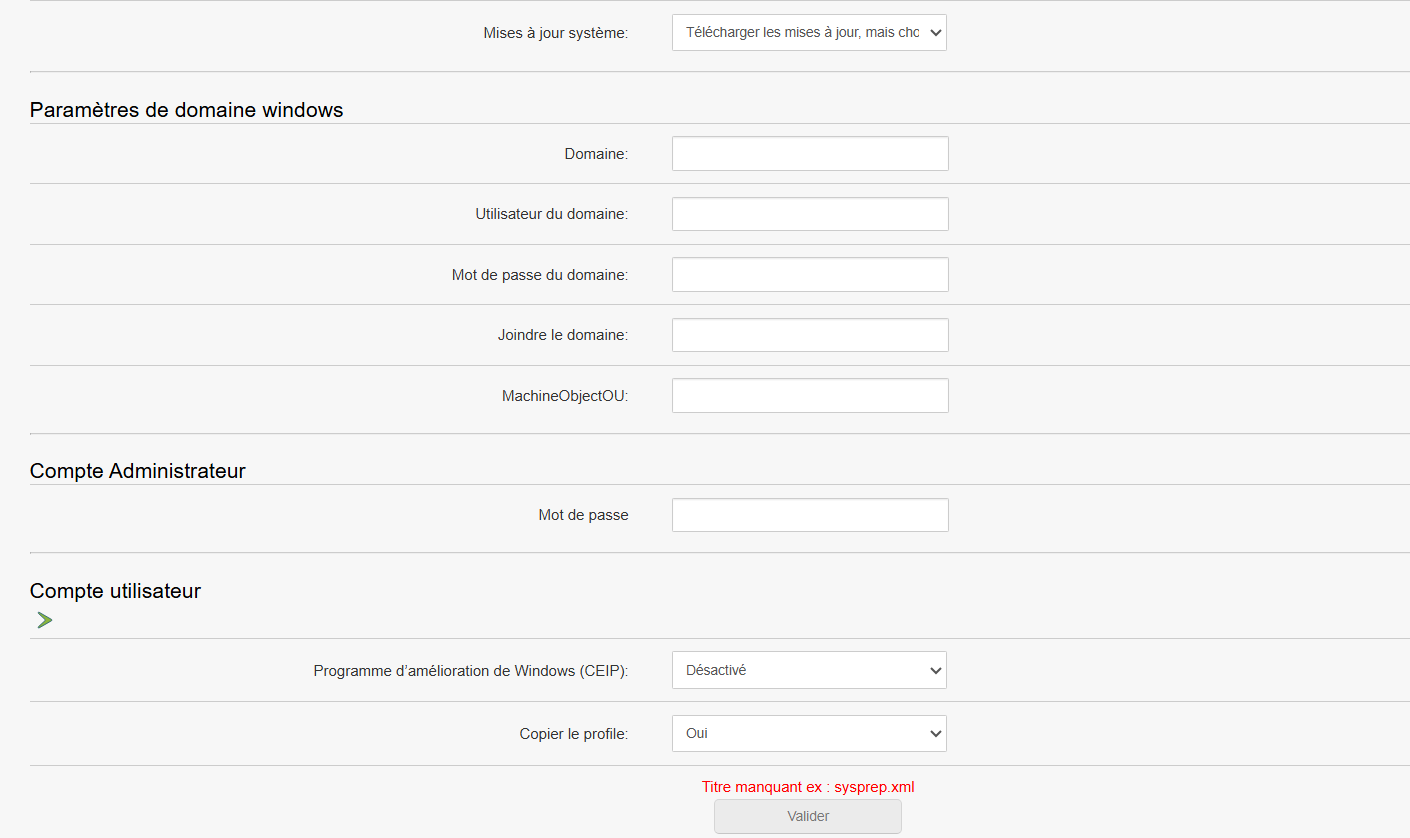
To use it
These files contain silent installation settings (machine name, language, product key, etc.)
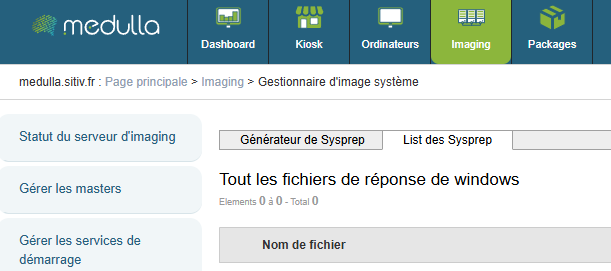
At the top of the page, you will find the list of Sysprep files:
Imaging groups
Displays all existing imaging groups.
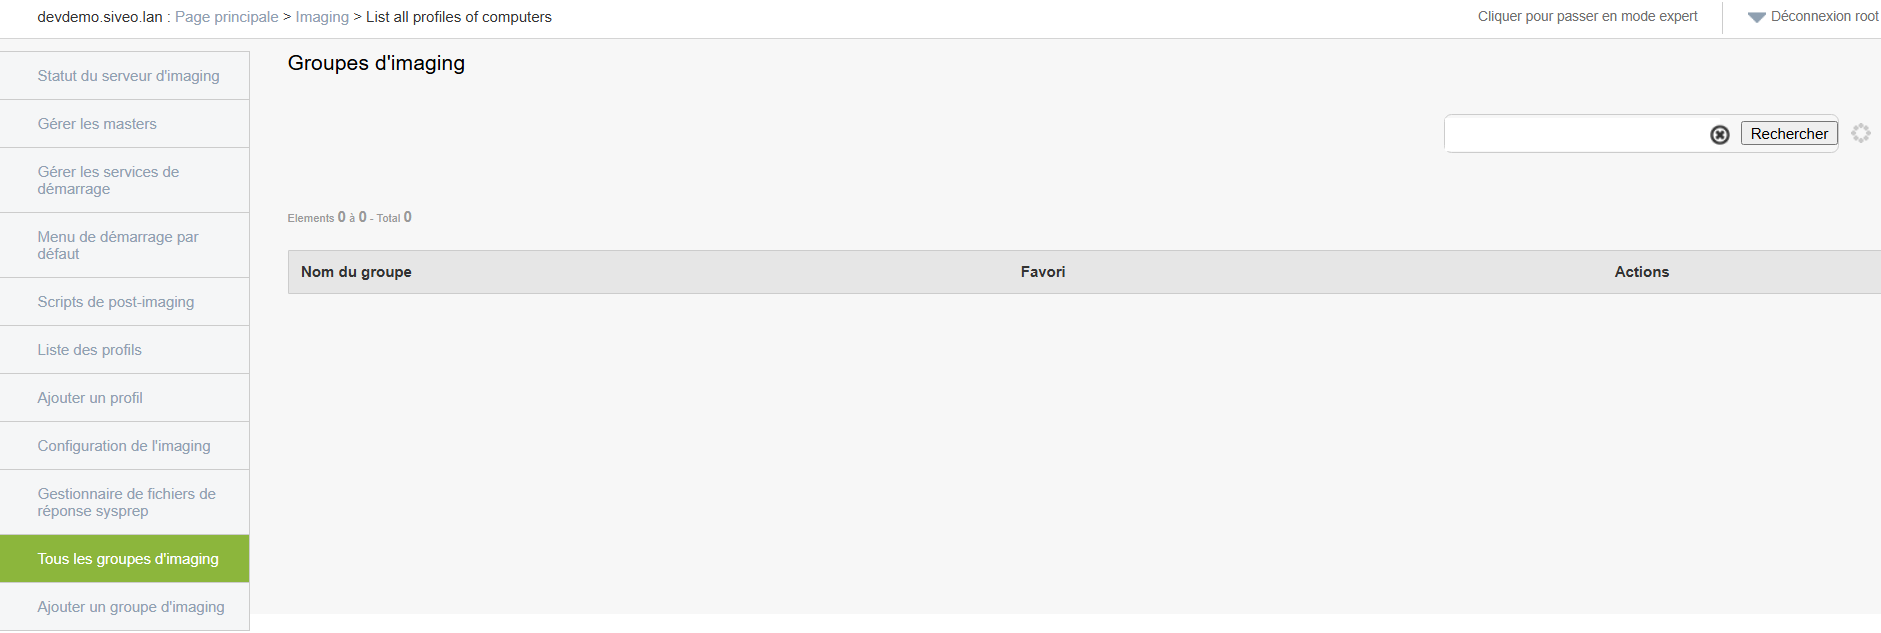
-
Each group contains a specific configuration linked to a deployment type (for example: classrooms, specific IT equipment, etc.)
-
You can view, edit, or delete them.
Add an imaging group
Create an imaging group to organize your deployments.
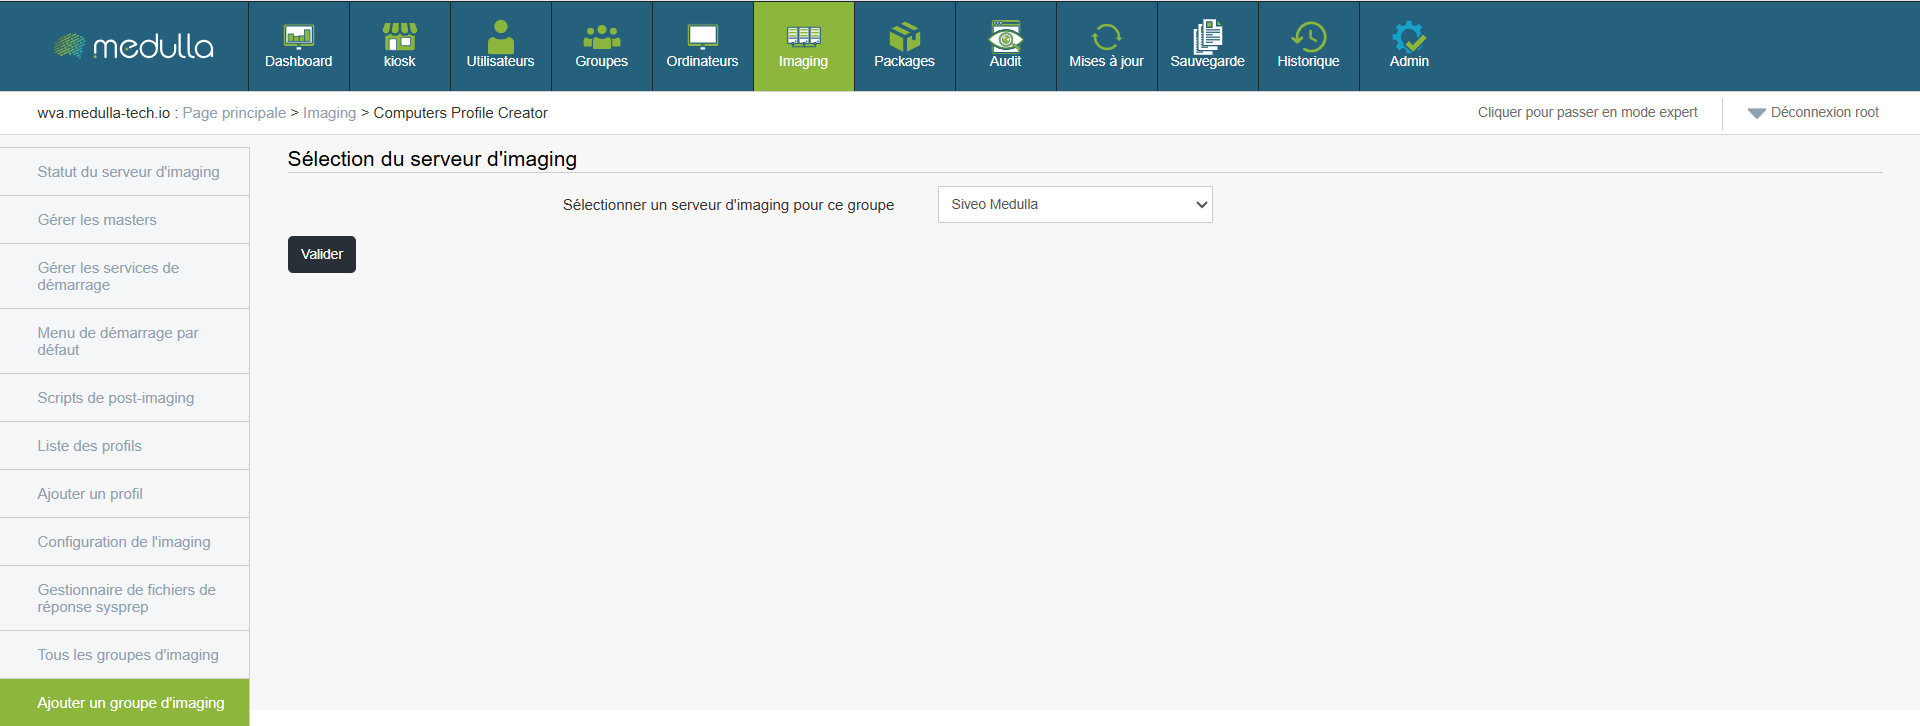
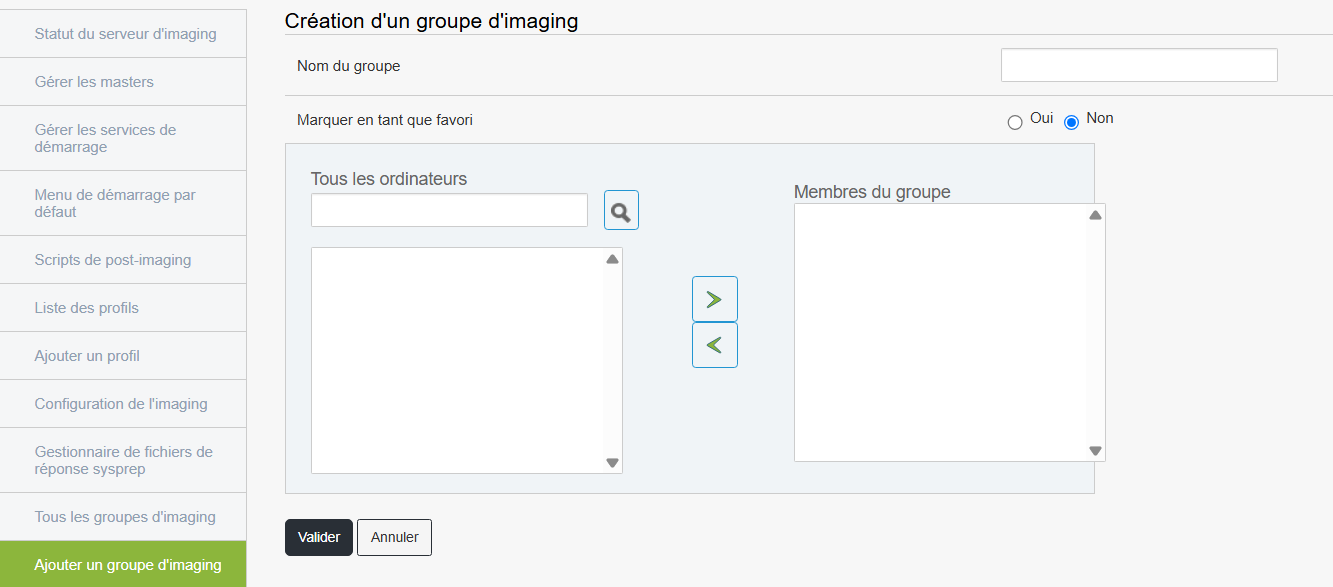
Steps
This group will then appear in the list of available groups.
Chapter 8: Packages
List of available packages
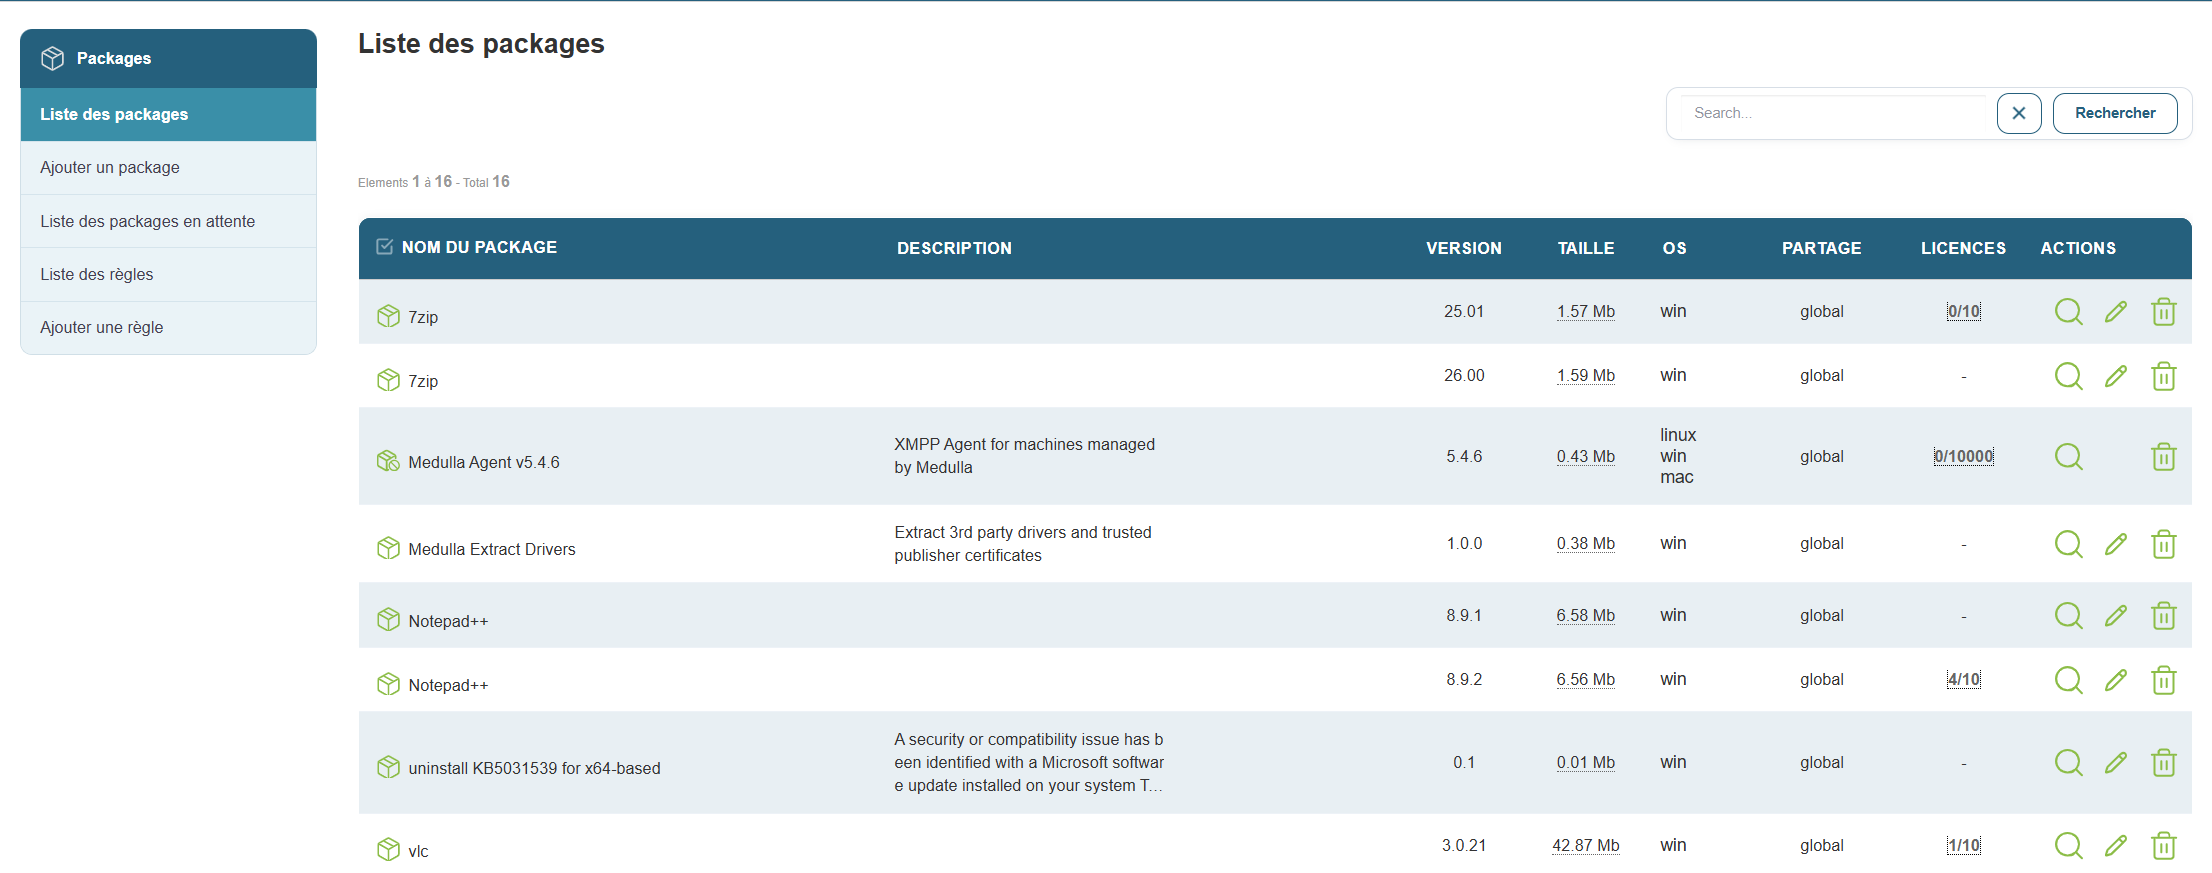
Package deployment allows you to install, uninstall, or perform specific actions on multiple remote workstations in a centralized and automated manner. It is a key feature for managing an IT infrastructure, offering speed, consistency, and precise tracking.
This section displays all packages ready for use in deployments.
Access
Displayed content
Each line in the list displays
- The package name
- A description
- The type of action (installation, uninstallation, script)
- The version
- The associated permissions
Available functions
- Search by keyword
- Sort the list by alphabetical order, date, or version
This allows for quick and organized browsing of available deployment tools.
Add a new package
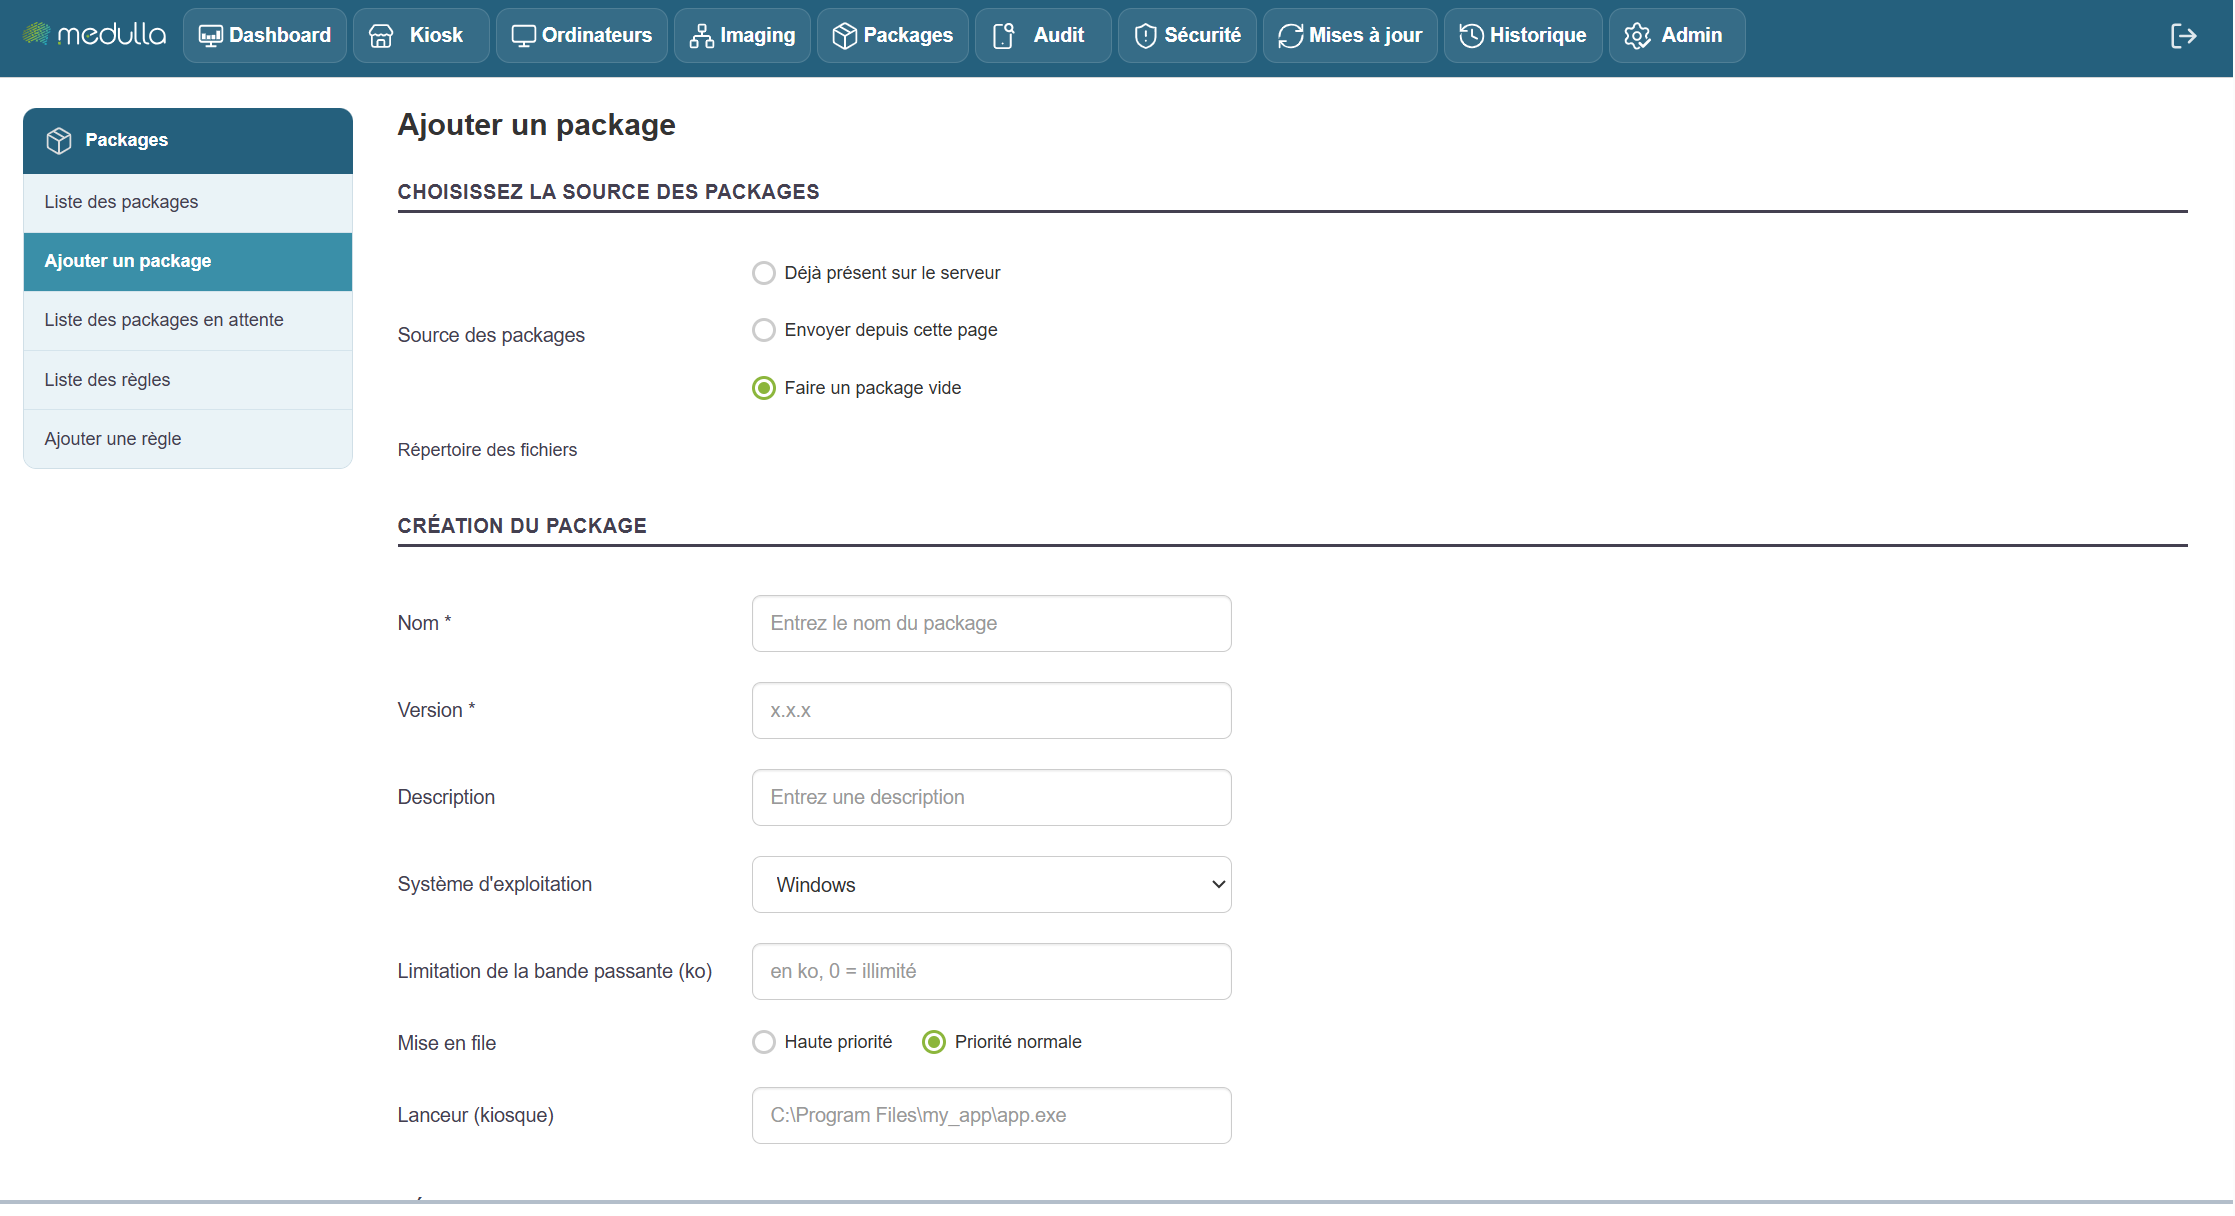
Creating a package involves defining an action (installation, uninstallation, script, etc.) that will be deployed to one or more workstations. The creation form allows you to precisely configure the package’s behavior and its execution options.
Next, select the source of the files to be used in the package. Four options are available:
-
Already present on the server
Use files previously uploaded to the server. -
Upload from this page
Import the installation files directly from your computer. -
Create an empty package
Create a package with no initial content, to be filled in later. -
File directory
Use a shared directory containing the files to be deployed.
General information to provide
Sharing
SelectGlobal Packages to make the package visible across the entire platform, for all Entities.
Name
Give the package a descriptive name, for example: Install_Chrome
Special characters and accented characters are not allowed.
Version
Enter a version number, for example: 1.0.0.
Description
Briefly summarize the purpose of the package.
Operating System
Select the target OS, for example:Windows.
Define the technical deployment details
Transfer method
Generally, use pushrsync (recommended).
- pushrsync: The server pushes the package to the workstation via Rsync.
- pullrsync: The machine retrieves the package from the server via Rsync.
- pulldirect: The machine retrieves the package from the server.
Bandwidth Limitation
Optional value to limit the transfer speed, e.g., 500Queuing
Queuing
Choose between High PriorityorNormal Priority, depending on the urgency of the deployment.
The execution order (from the queue) of deployments is determined based on the priority selected when the package was created.
Launcher (Kiosk)
Specify the path to the executable file that should be launched after installation (e.g.,C:\Program Files\my_app\app.exe).
Only required for Kiosk mode, to run the previously installed software via a button available on the Kiosk.
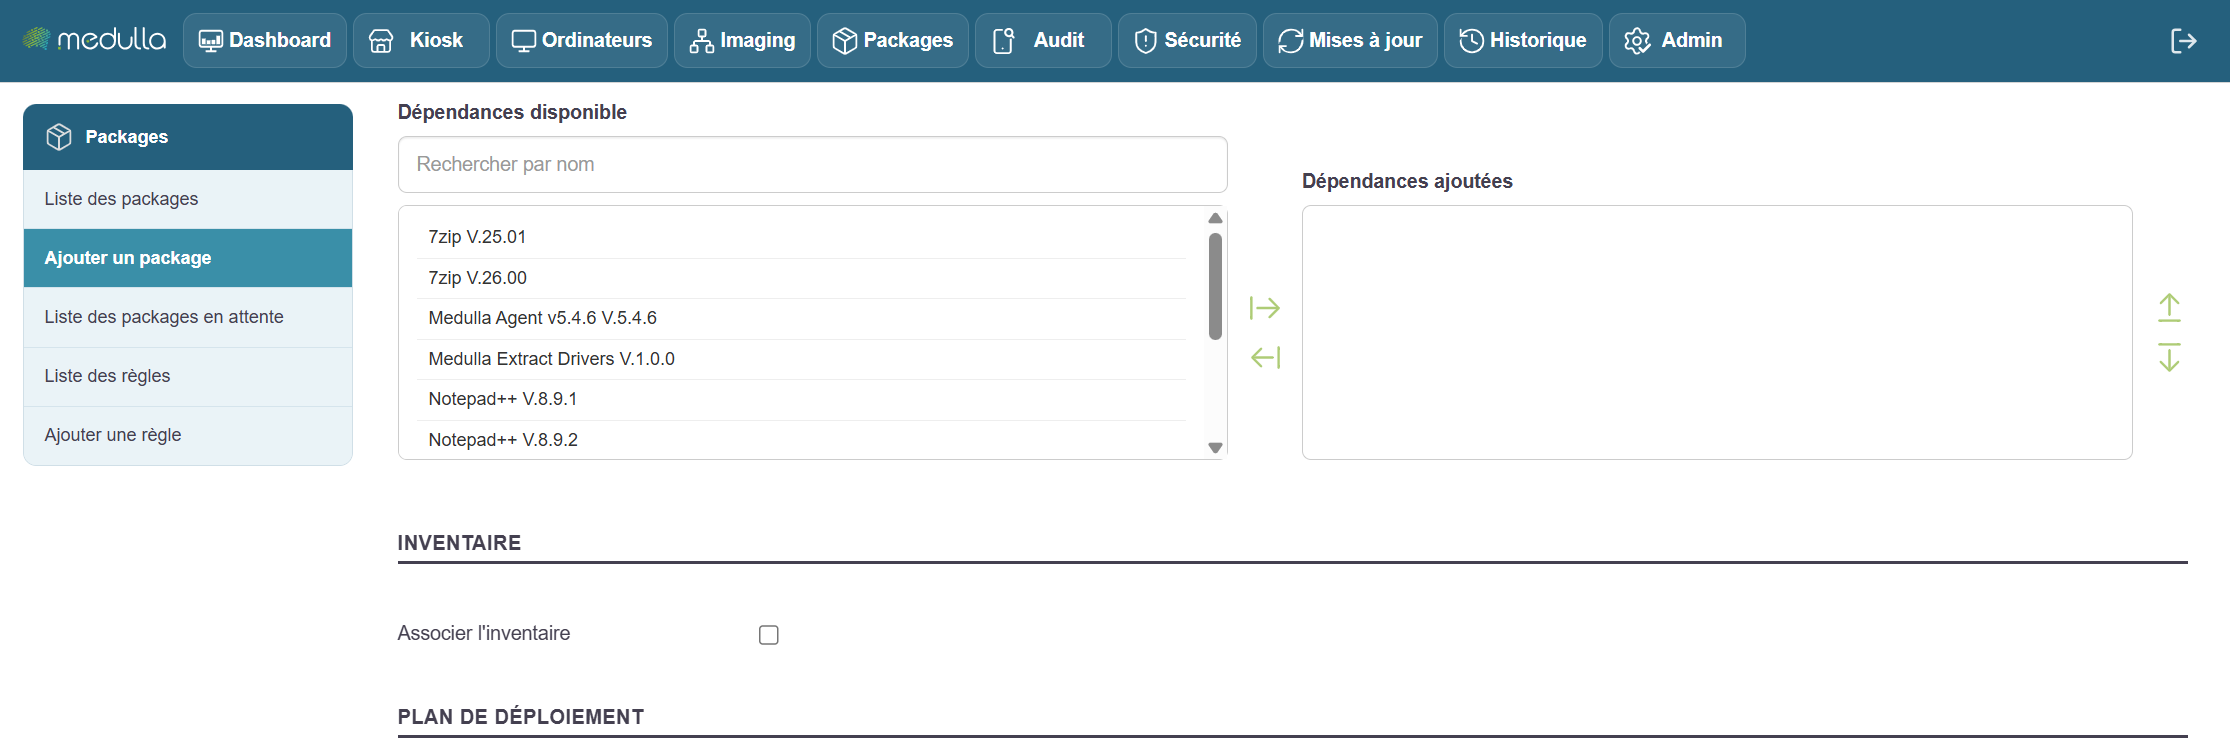
Dependencies
If your application requires other components to function
Search for and add the necessary dependencies from the available list (examples:Extract drivers, Medulla Agent).
The added dependencies will appear in the corresponding section.
Link to inventory
Enable this option to allow tracking of the package after installation via the GLPI inventory.
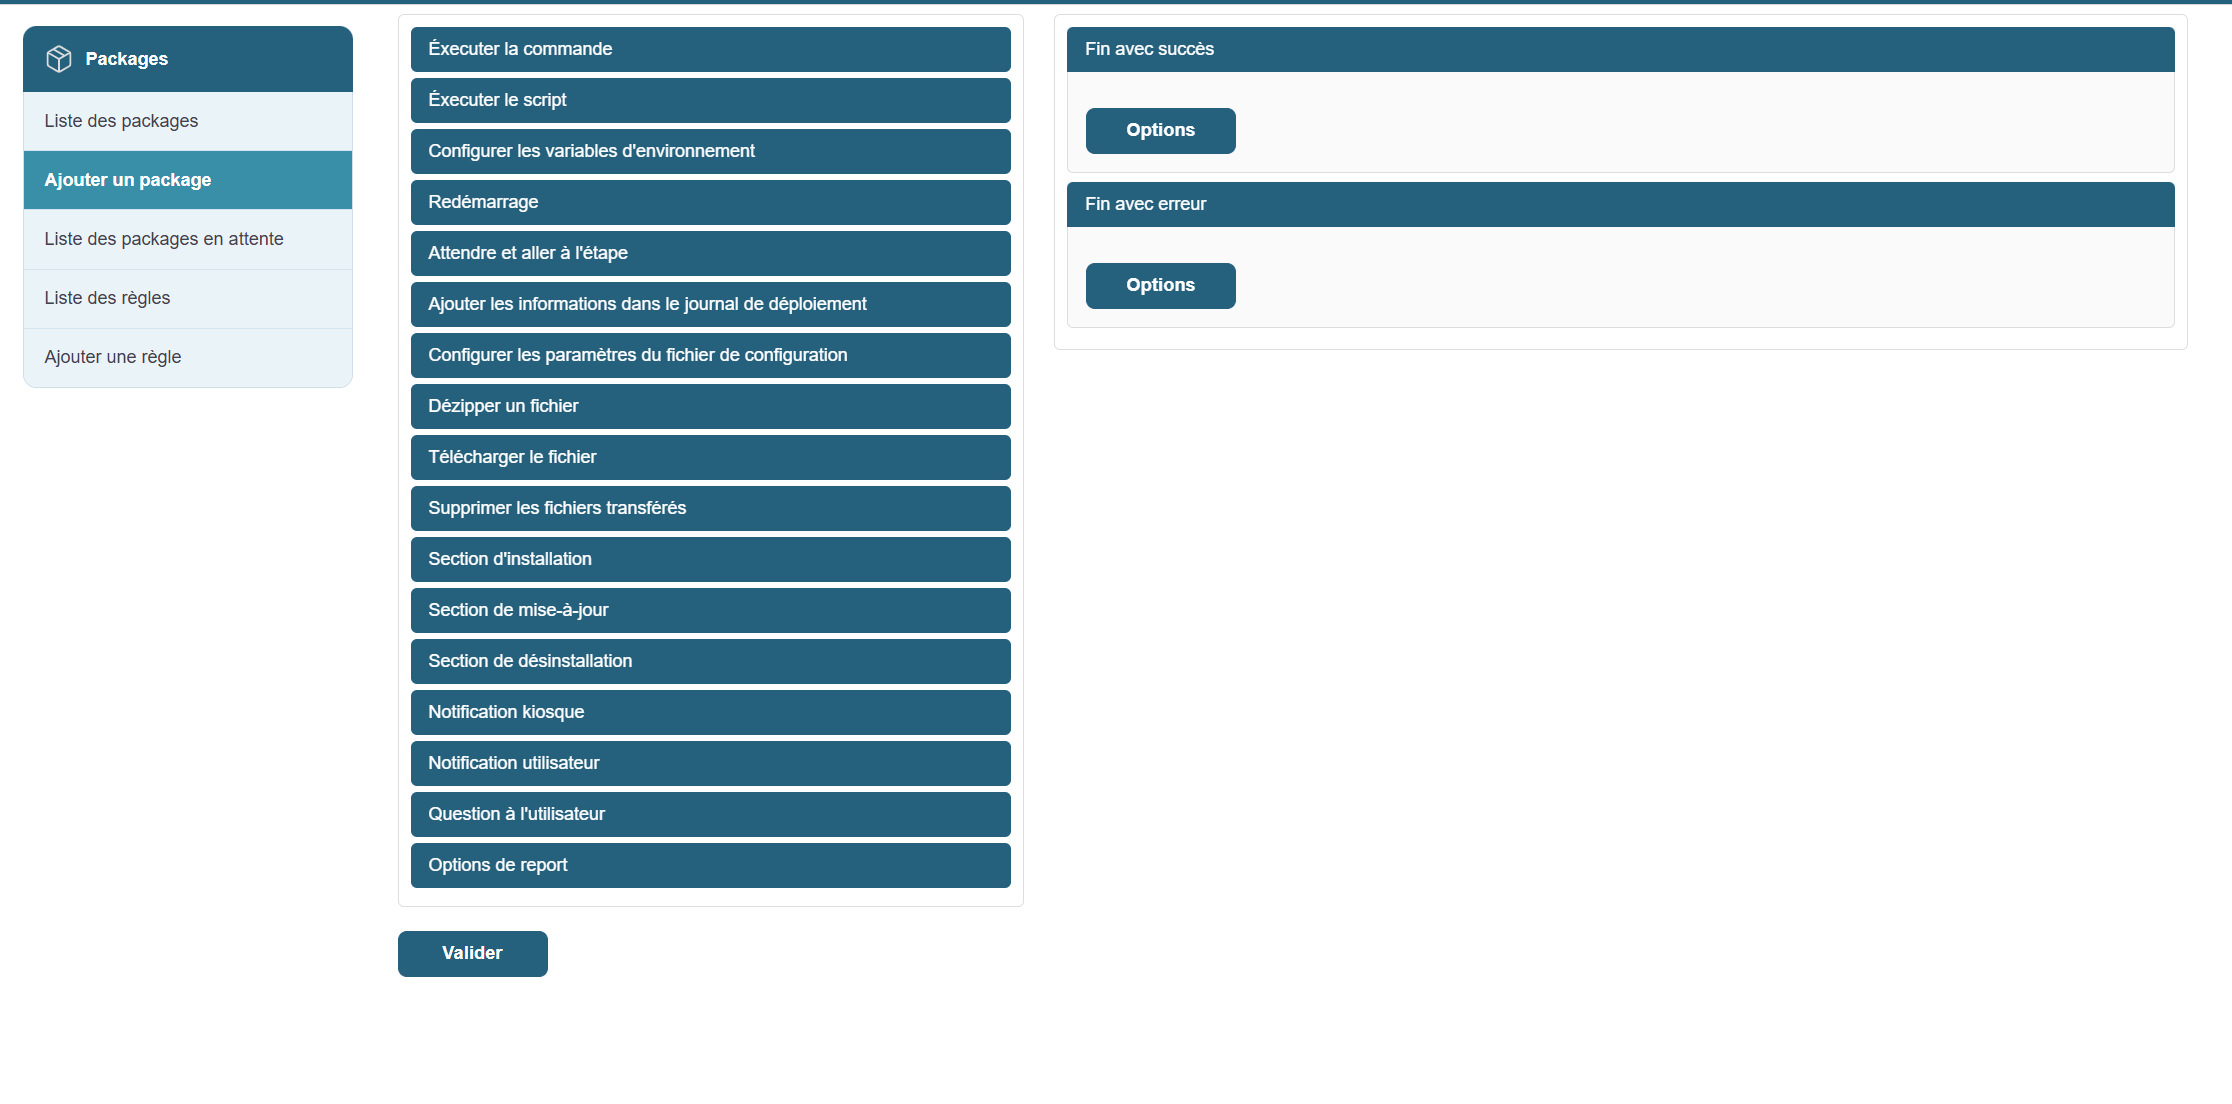
You can add custom actions to the package, depending on your needs:
-
Run a command or script (When adding a file to the "Package Source" package, our wizard automatically adds the correct command to run the setup file, allowing for silent installation of the application)
-
Configure environment variables
-
Restart the workstation after installation
-
Wait and proceed to the next step
-
Add information to the deployment log
-
Modify or configure a settings file
-
Extract, download, or delete files
The package may include several steps depending on its lifecycle
-
Installation section: for the initial installation
-
Update section: when upgrading to a new version
-
Uninstallation section: to remove the program
To interact with the end user
-
Kiosk notification: Displays information in the user area
-
User notification: Message displayed on the screen
-
User prompt: Conditional interaction (e.g., choosing a time)
-
Postponement options: Allows you to postpone the installation
Define the package’s behavior at the end of the process
-
Successfully completed
The step can be namedEND_SUCCESS. Allows you to trigger a final action. -
End with error
The step can be namedEND_ERROR. Used to handle deployment errors or failures.
-
Inventory
Option available if a change to the device is detected following deployment. -
Delete the package
Enable this option if the package should be deleted after execution (rarely used in standard deployments).
Once all sections have been configured and verified
Click Add to save the package.
It will then be accessible from the library for use in a deployment rule or to be triggered manually.
Packages on the waiting list
This section allows you to view packages that have been created or added but have not yet been sent to the target devices. It is primarily used to organize, verify, or delete pending actions before they are executed.
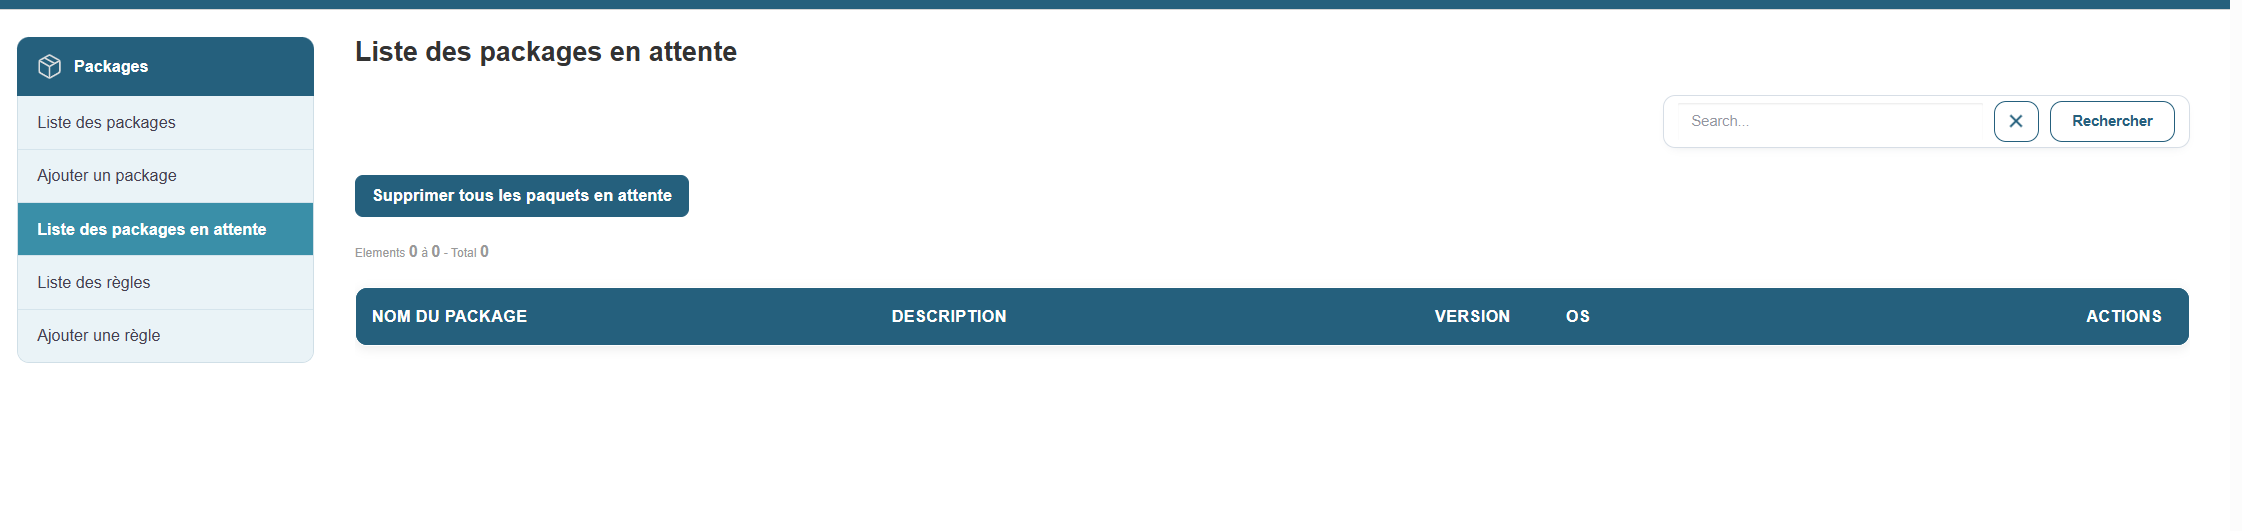
Access:
Section contents:
Once on this page, a list of all packages in the queue is displayed with the following information for each entry:
-
Package name
-
Description
-
Version
-
Target operating system
-
Available actions (to the right of each row)
Available actions:
-
View mirror status: allows you to check the mirror servers available for the package distribution.
-
Remove pending packages: button to remove a specific package from the list.
-
Remove all pending packages: general button at the top of the page to clear the entire queue if necessary.
-
Search for a package: search field to filter the list by name or version.
Note: This page does not allow you to directly initiate a deployment, but it helps you monitor items still in the queue. Deployment is typically performed from a separate dedicated section or via an action triggered by a scenario or rule.
List of deployment rules
Deployment rules allow you to schedule or restrict deployment based on specific criteria (time range, machine type, user group, etc.).
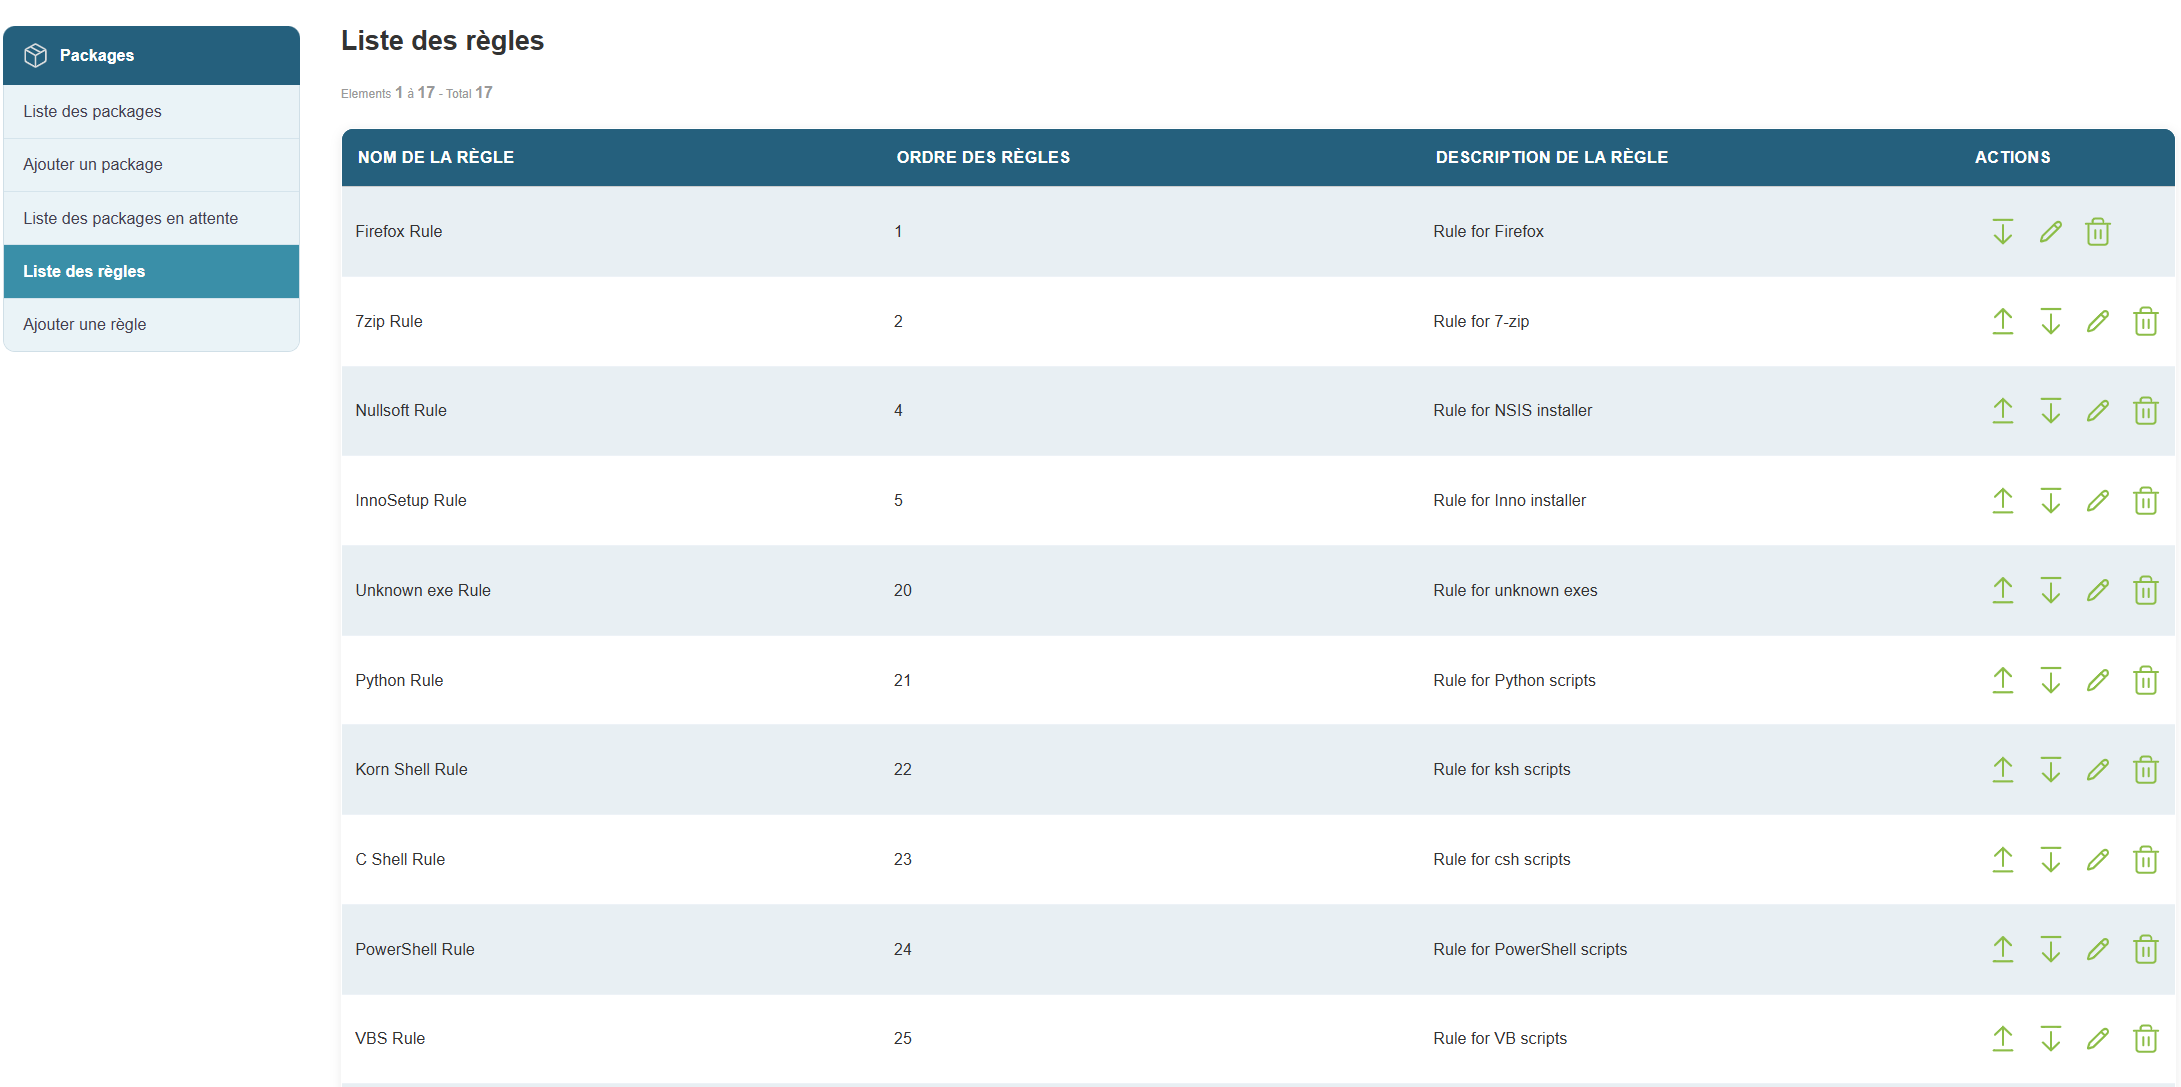
Access:
Available information:
- List of existing rules with their conditions
- Examples of criteria:
- Name
- Order
- Descriptions
- Actions:
- Increase or Decrease the rule's priority
- Edit the rule
- Delete the rule
Add a custom rule
Creating a rule allows you to precisely define when and on which machines a package will be deployed.
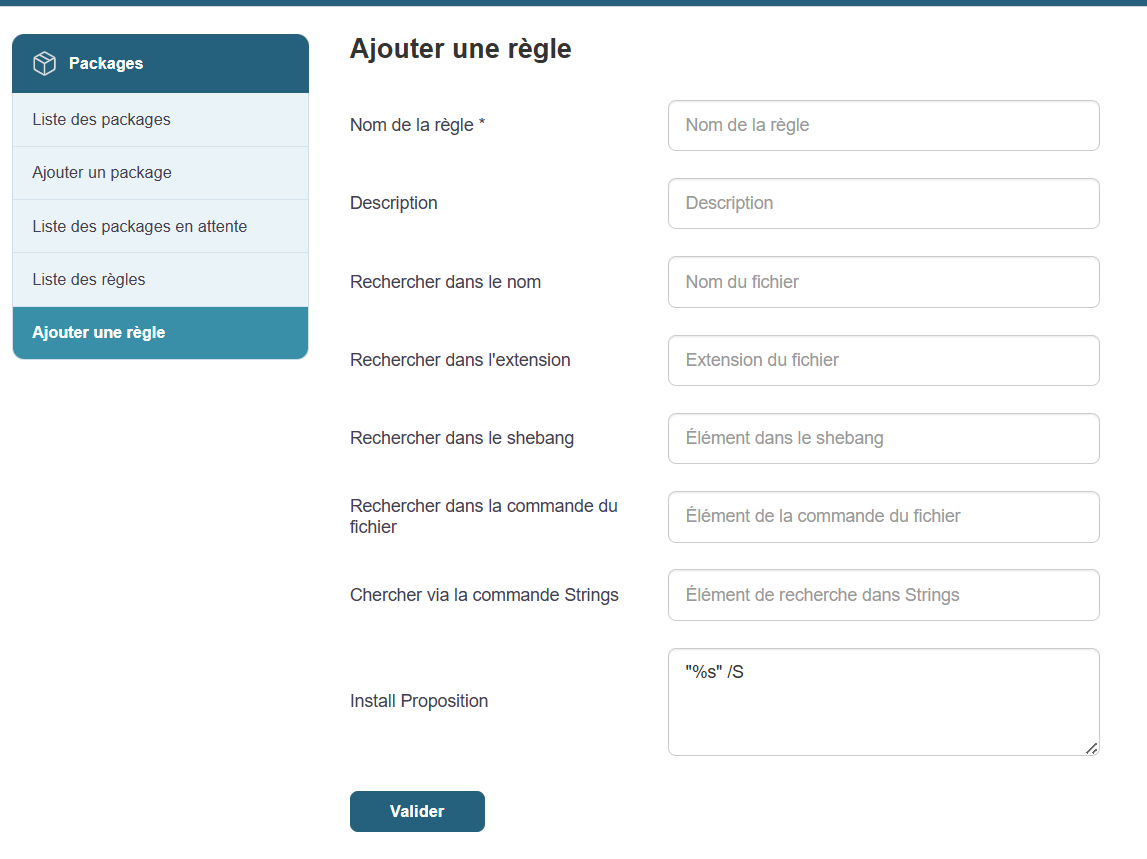
Steps:
The rule is now active and is automatically applied when its conditions are met.
Launch a deployment and monitor its execution
Once your packages and rules are ready, you can begin deployment on the target machines.
Steps:
Real-time tracking:
- Progress is visible from the interface
- Machines report their status: In Progress, Success, Failure
In case of failure:
- Go to the Action Tracking section
- View the detailed error report (examples: machine turned off, permission error)
- Correct if necessary, then restart the action without having to start over
Conclusion
With this feature, you can centralize and automate all your software installations and system actions across your entire fleet. You save time, ensure consistency across workstations, and gain precise control over every deployment performed.
Chapter 9: Audit
Individual and group tasks
The ability to track and understand every action taken is crucial. The management system offers several views to explore past operations in detail, monitor ongoing tasks, identify errors, and collaborate effectively across teams.
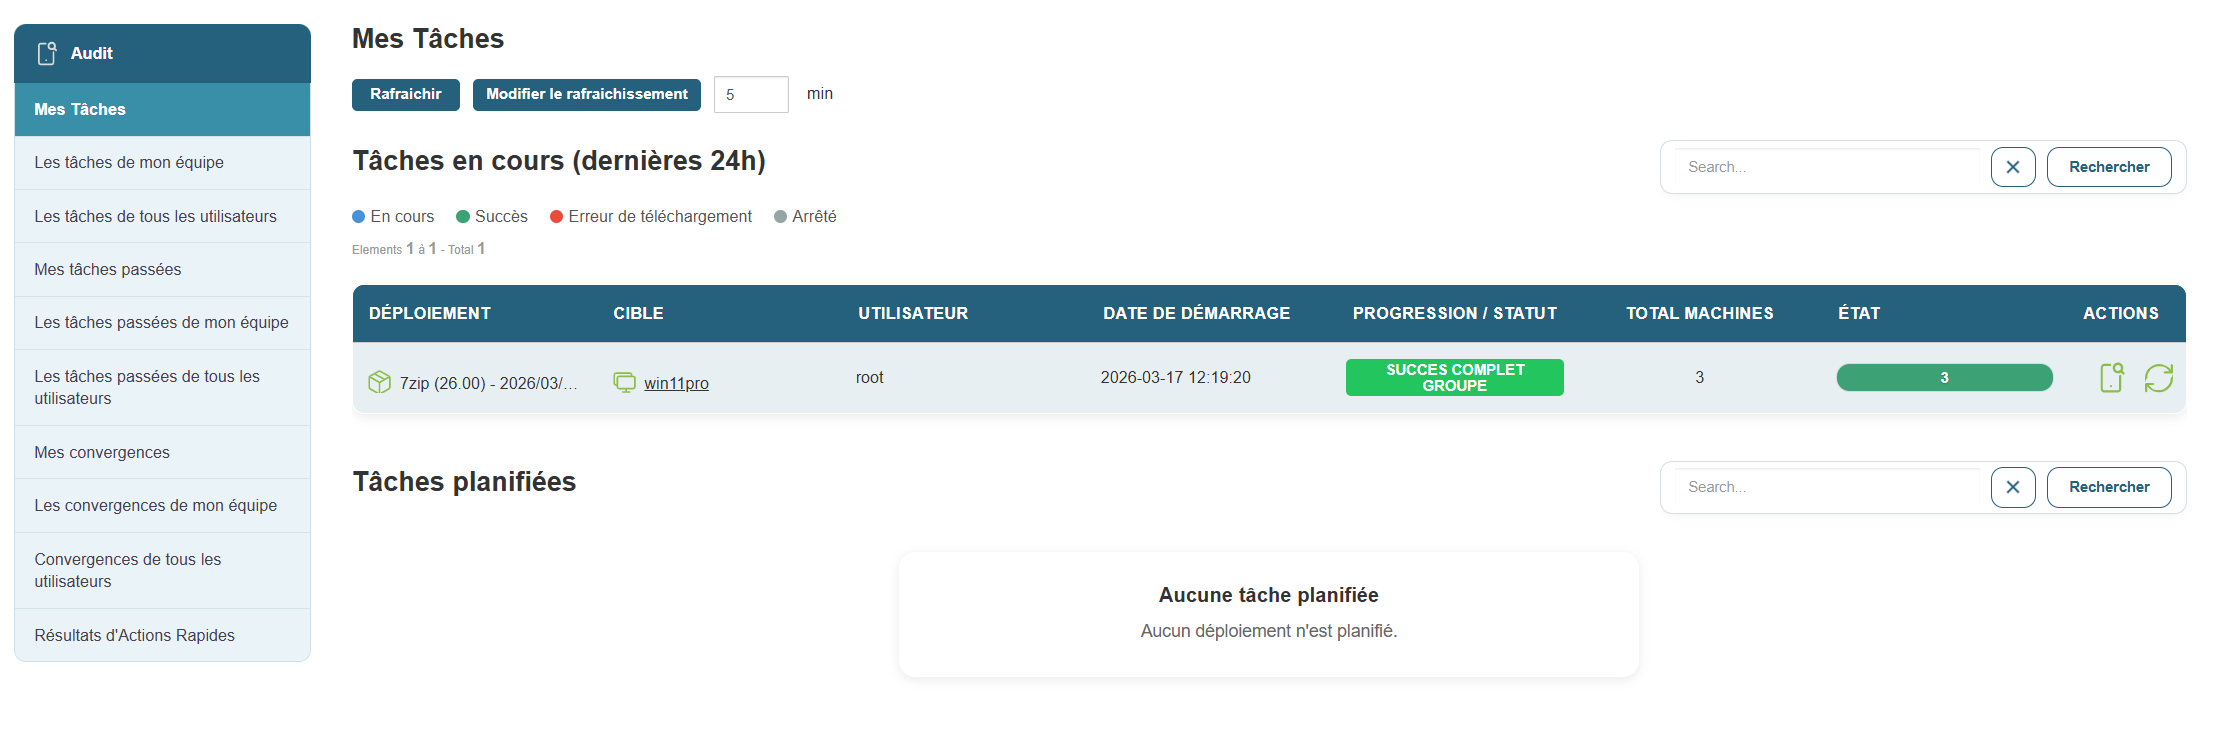
The My Tasks section allows you to view all the actions you have initiated, whether they are in progress or completed.

Access:
View:
-
In-progress tasks: displays deployments in progress over the last 24 hours.
-
Scheduled Tasks: lists actions scheduled for a future date.
-
My past tasks: tracks all your previous actions, along with their results.
Available information:
For each task:
-
Deployment type
-
Target (machine or group)
-
Start date
-
Progress status (success, failure, download error, stopped)
-
User who initiated the action
Filters allow you to search for a task by name or user.
Task monitoring isn’t limited to your personal activity. With team views, you can track your colleagues’ operations, identify commonalities, and avoid duplication.
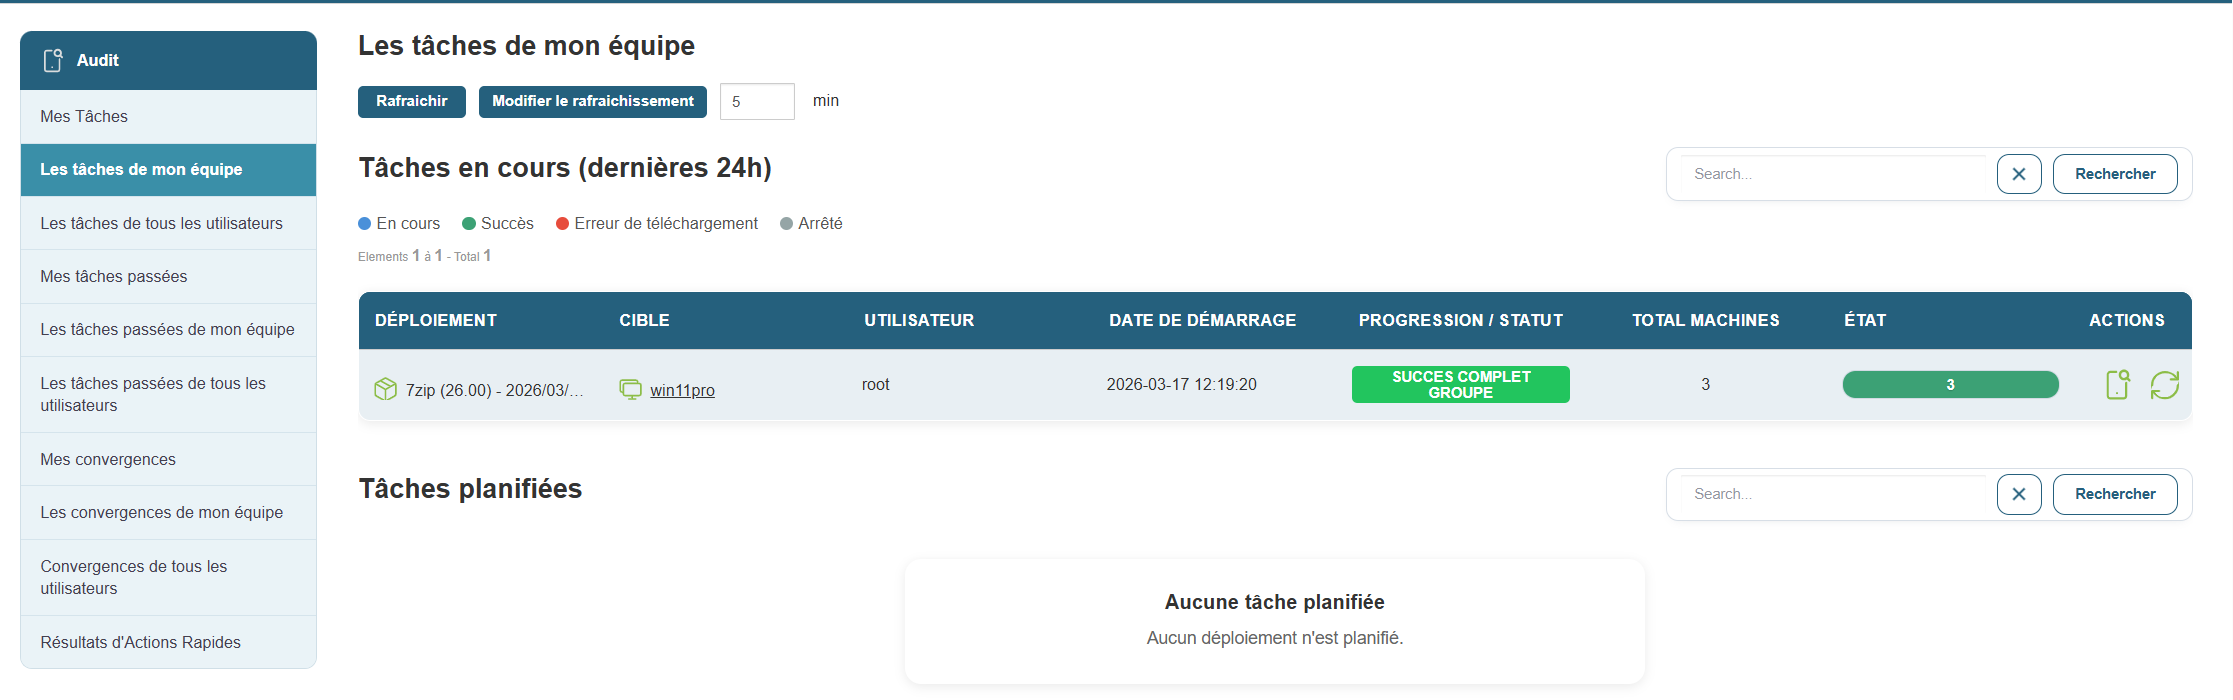
Access:
Available sections:
-
My team's past tasks: comprehensive history of actions initiated by your team.
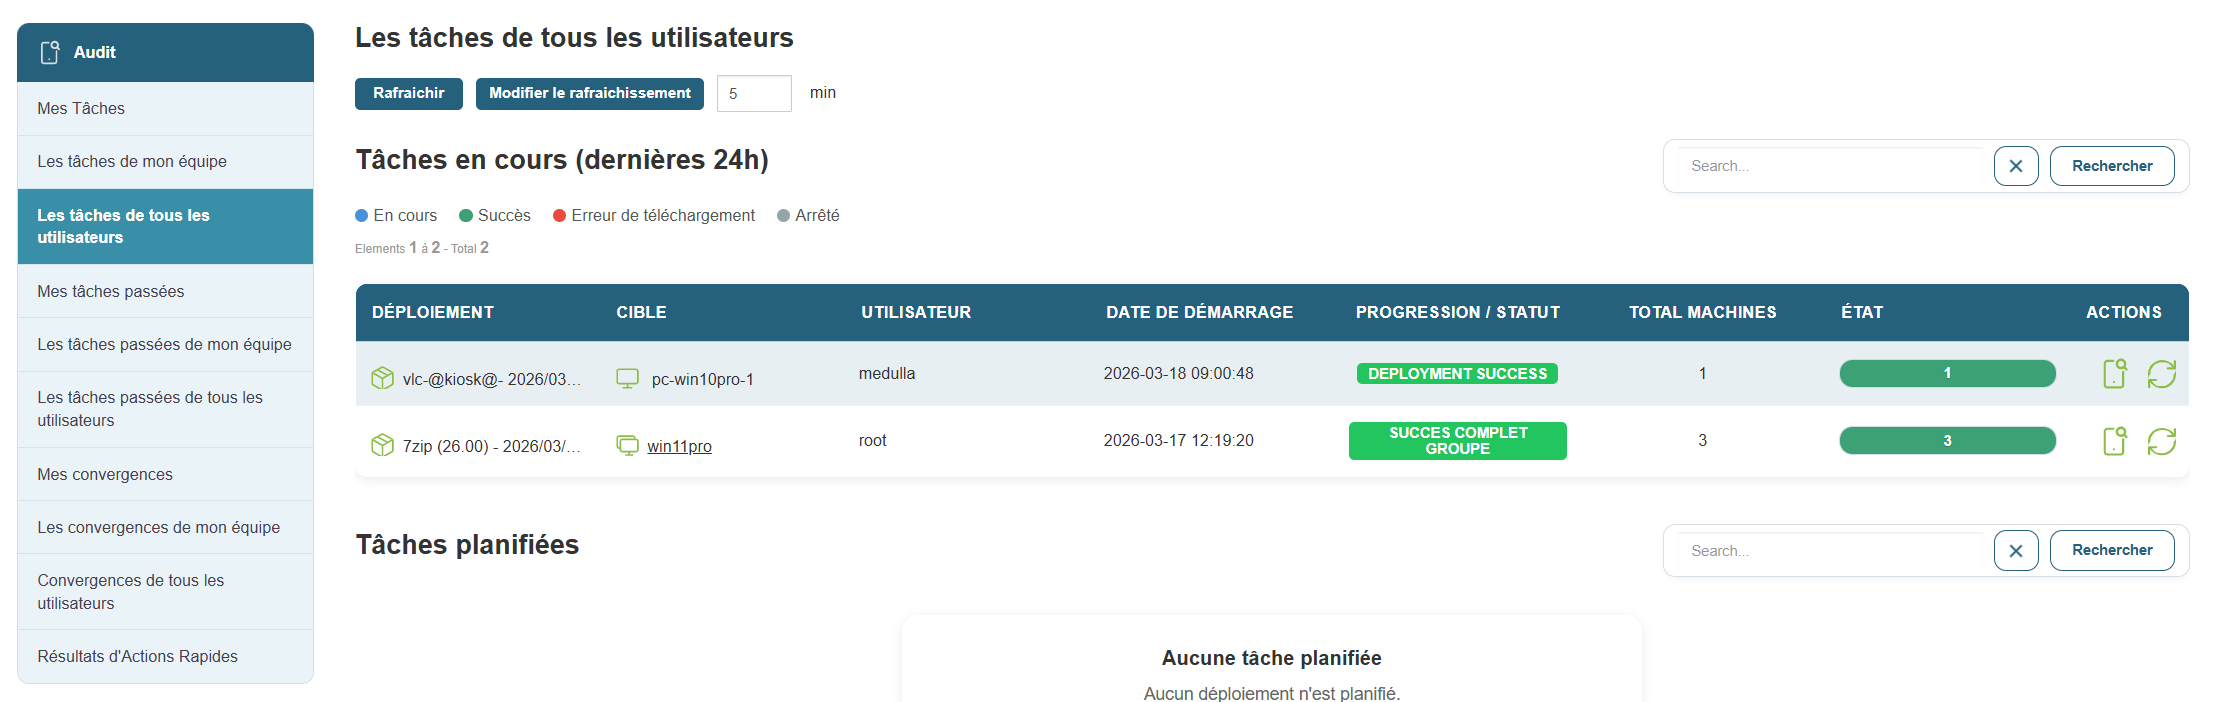
-
Past tasks of all users: comprehensive view of all recorded operations.
-
Convergences:
-
My Convergences: tasks affecting multiple machines or groups at once that you have initiated.
-
Convergences formy team or all users: collective view of major operations.
-
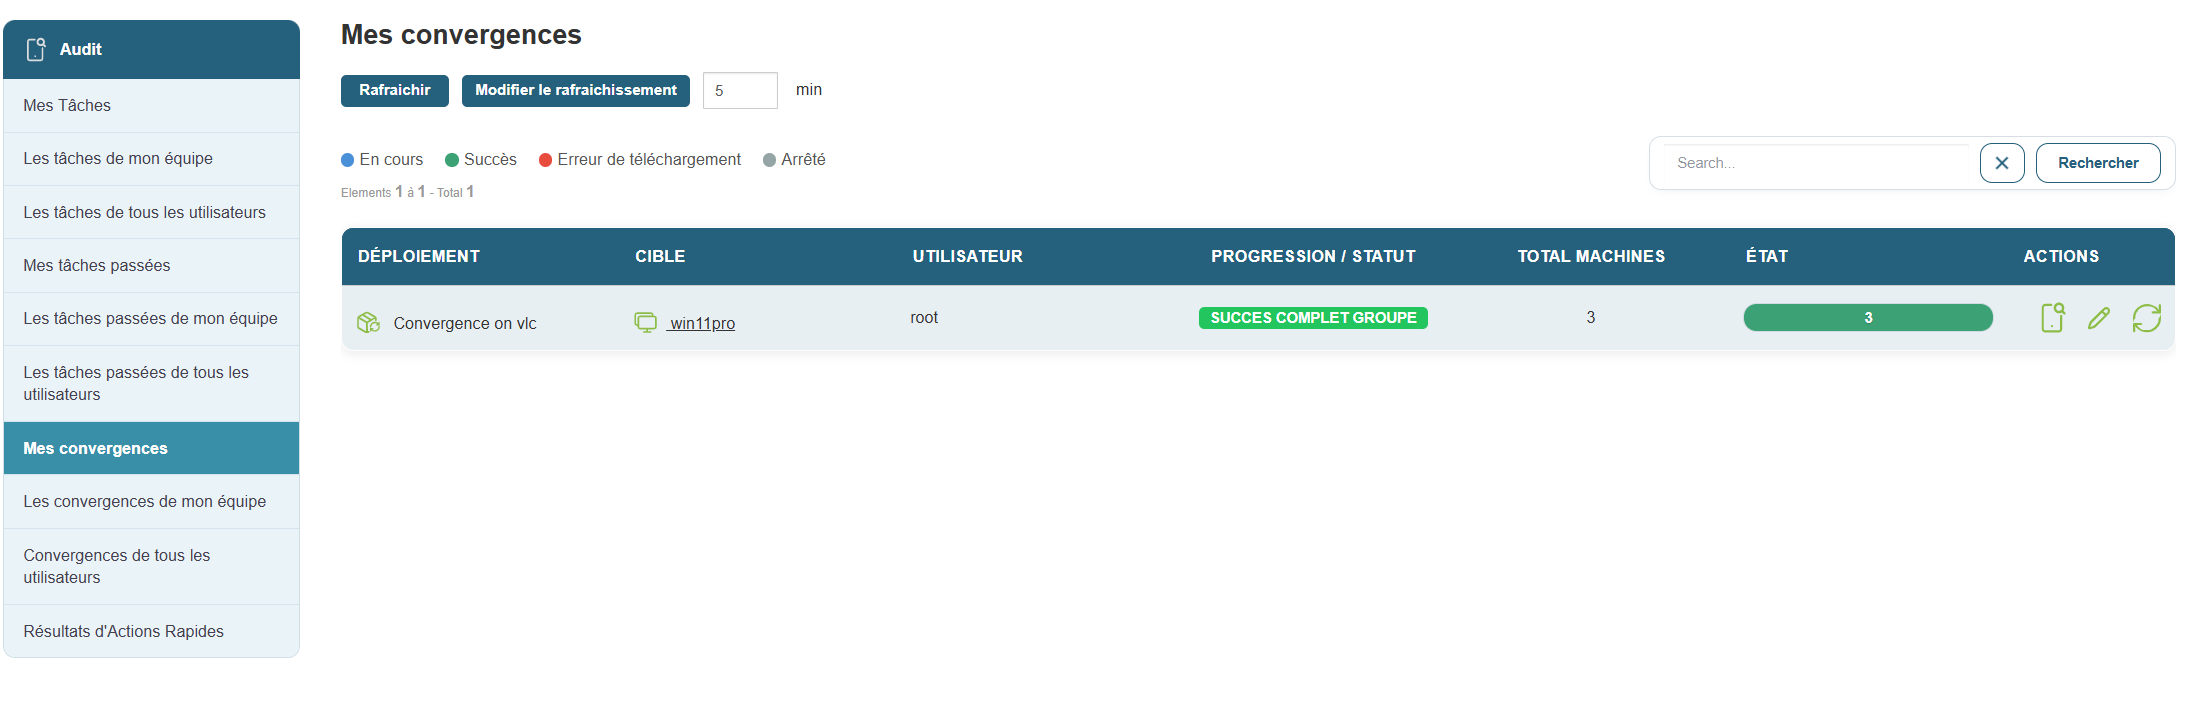
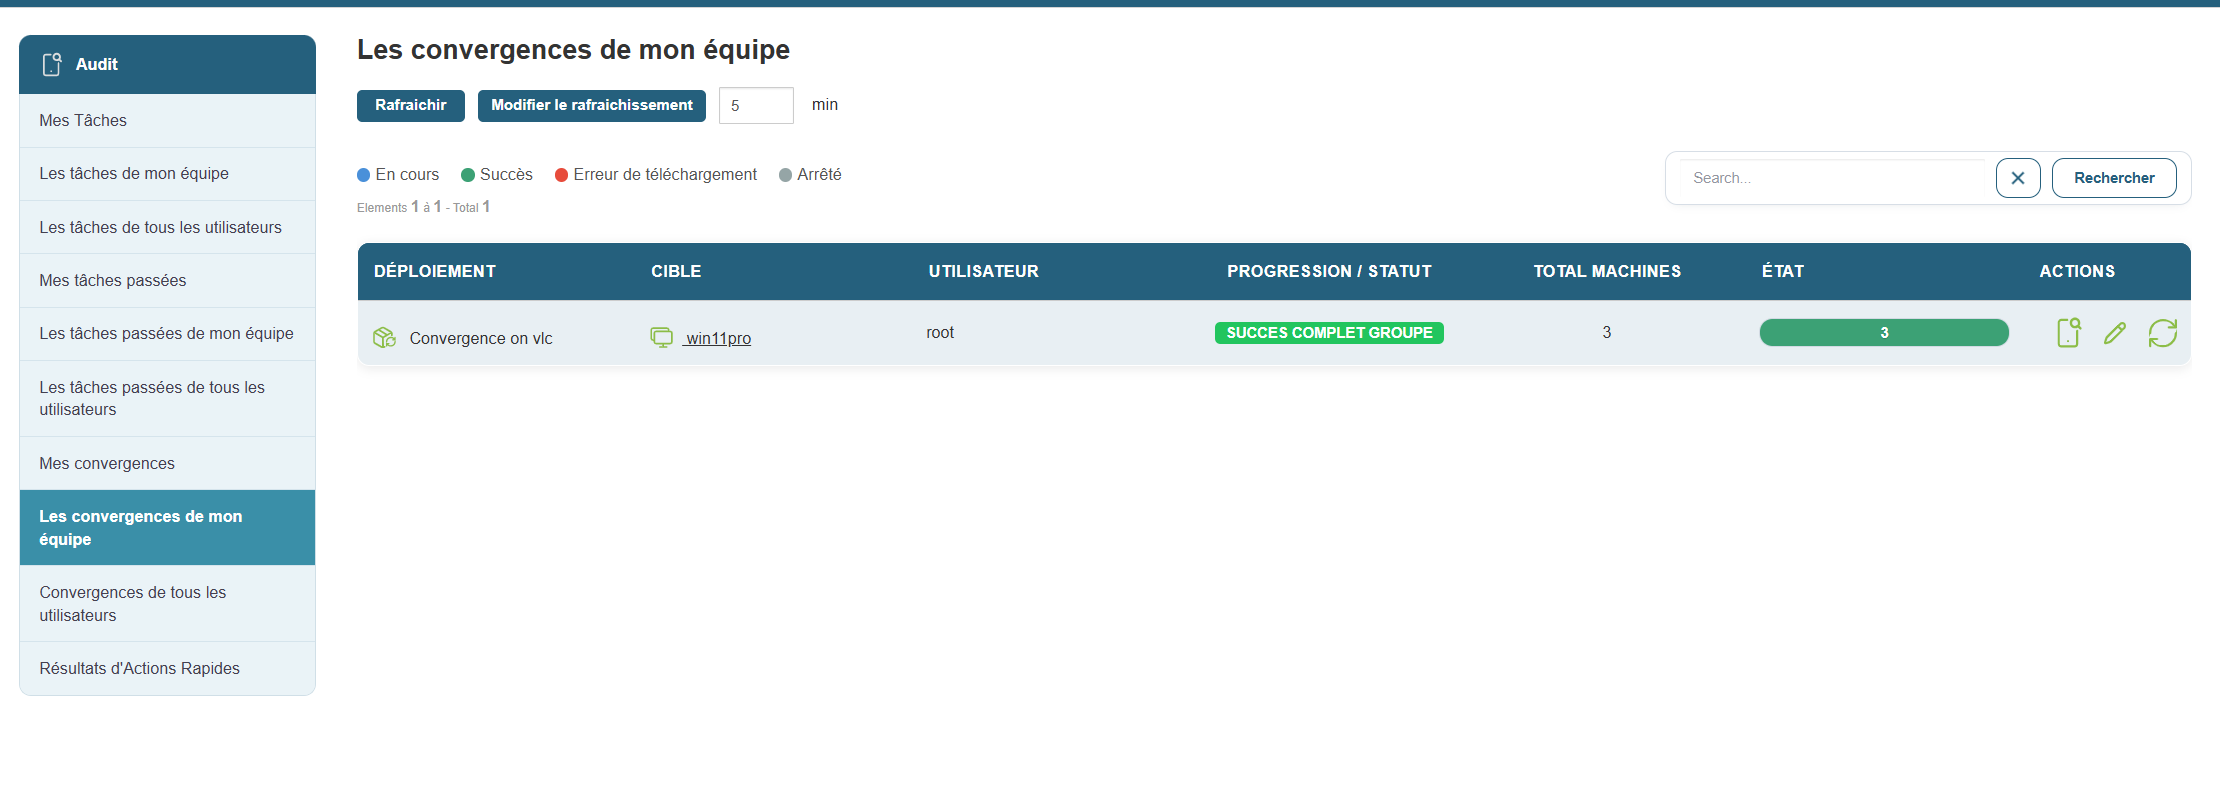
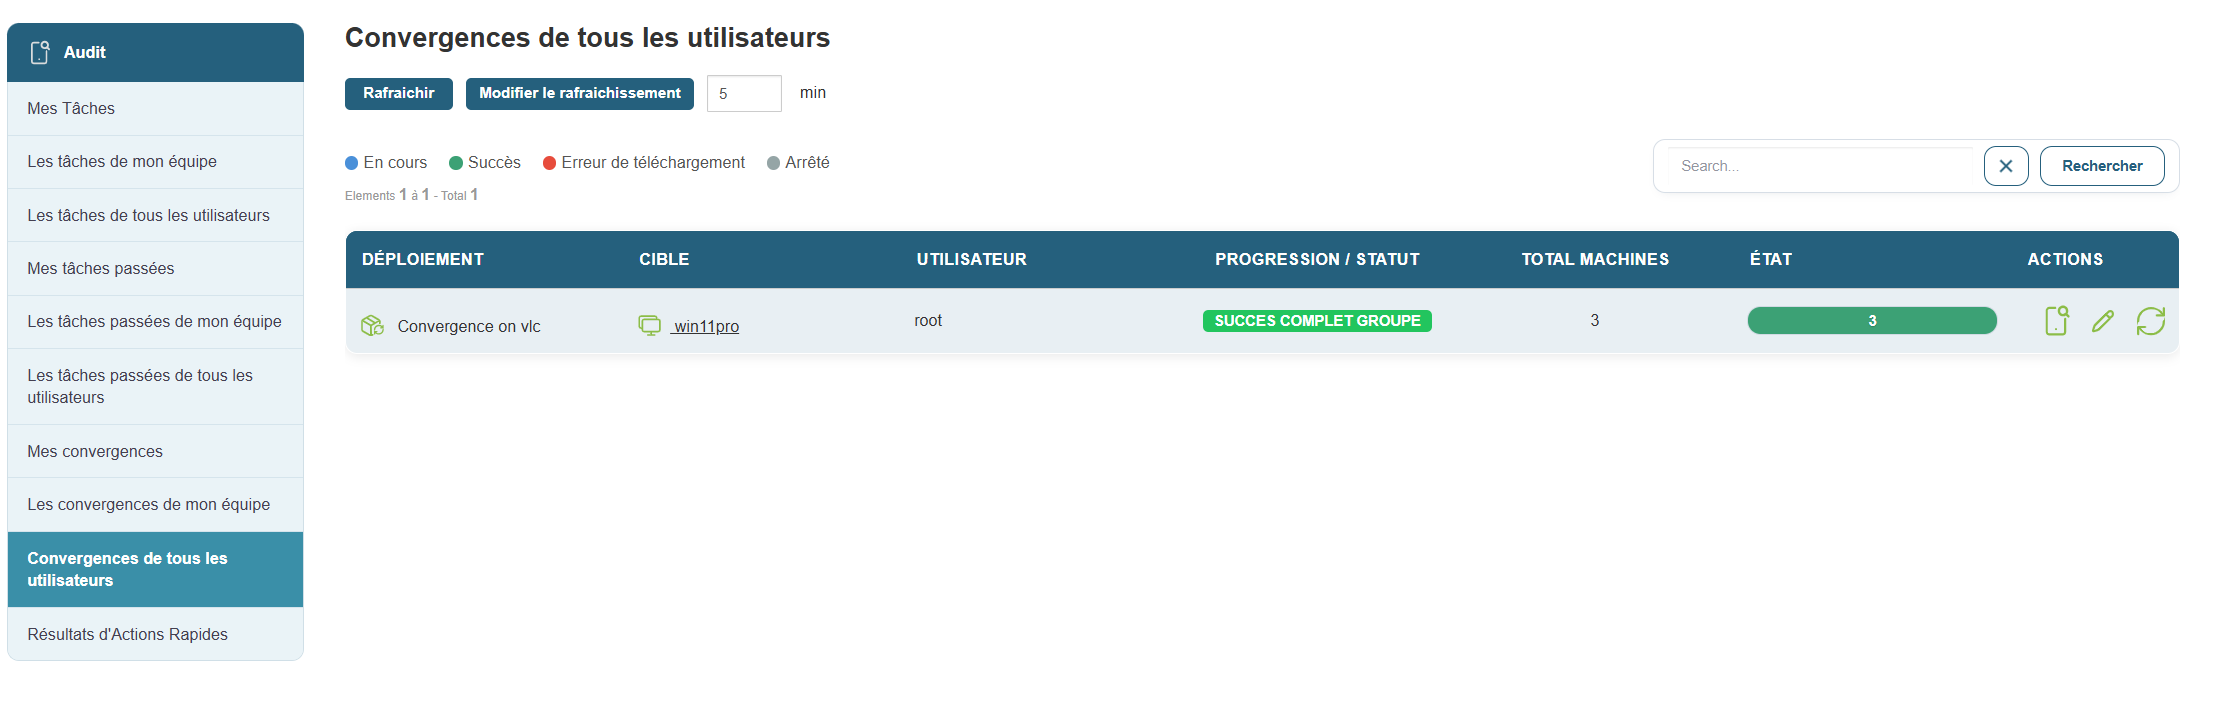
This information allows you to cross-reference intervention data, identify recurring or critical operations, and act consistently within your department.
Task Analysis
For each listed task, you can access acomplete description that includes:
-
The total number of machines affected
-
The progress rate (successes, errors, stopped transfers)
-
Download or permission errors
-
The associated execution log
This data is essential for:
-
Diagnosing incidents
-
Justify an intervention
-
Verify deployment compliance
-
Documenting processes for audit purposes
To access these details, simply click the 
A Refresh button (with a configurable interval, default 5 minutes) keeps the view constantly updated.

This facilitates active management by allowing you to:
-
Respond quickly in the event of a failure or blockage
-
Identify tasks that are taking an unusually long time
-
Follow a precise schedule in real time
The audit and task management interface is a true retrospective and collaborative dashboard. It allows you to understand what was done, by whom, on which machine, and with what results. This traceability is essential for strengthening security, improving internal procedures, and ensuring reliable and controlled administration of your IT environment.
Group Deployment Analysis:
When you open the group deployment, you’ll see an interface that displays the pie charts from the home screen.
You can then click on each pie chart segment to create a group based on the error type.
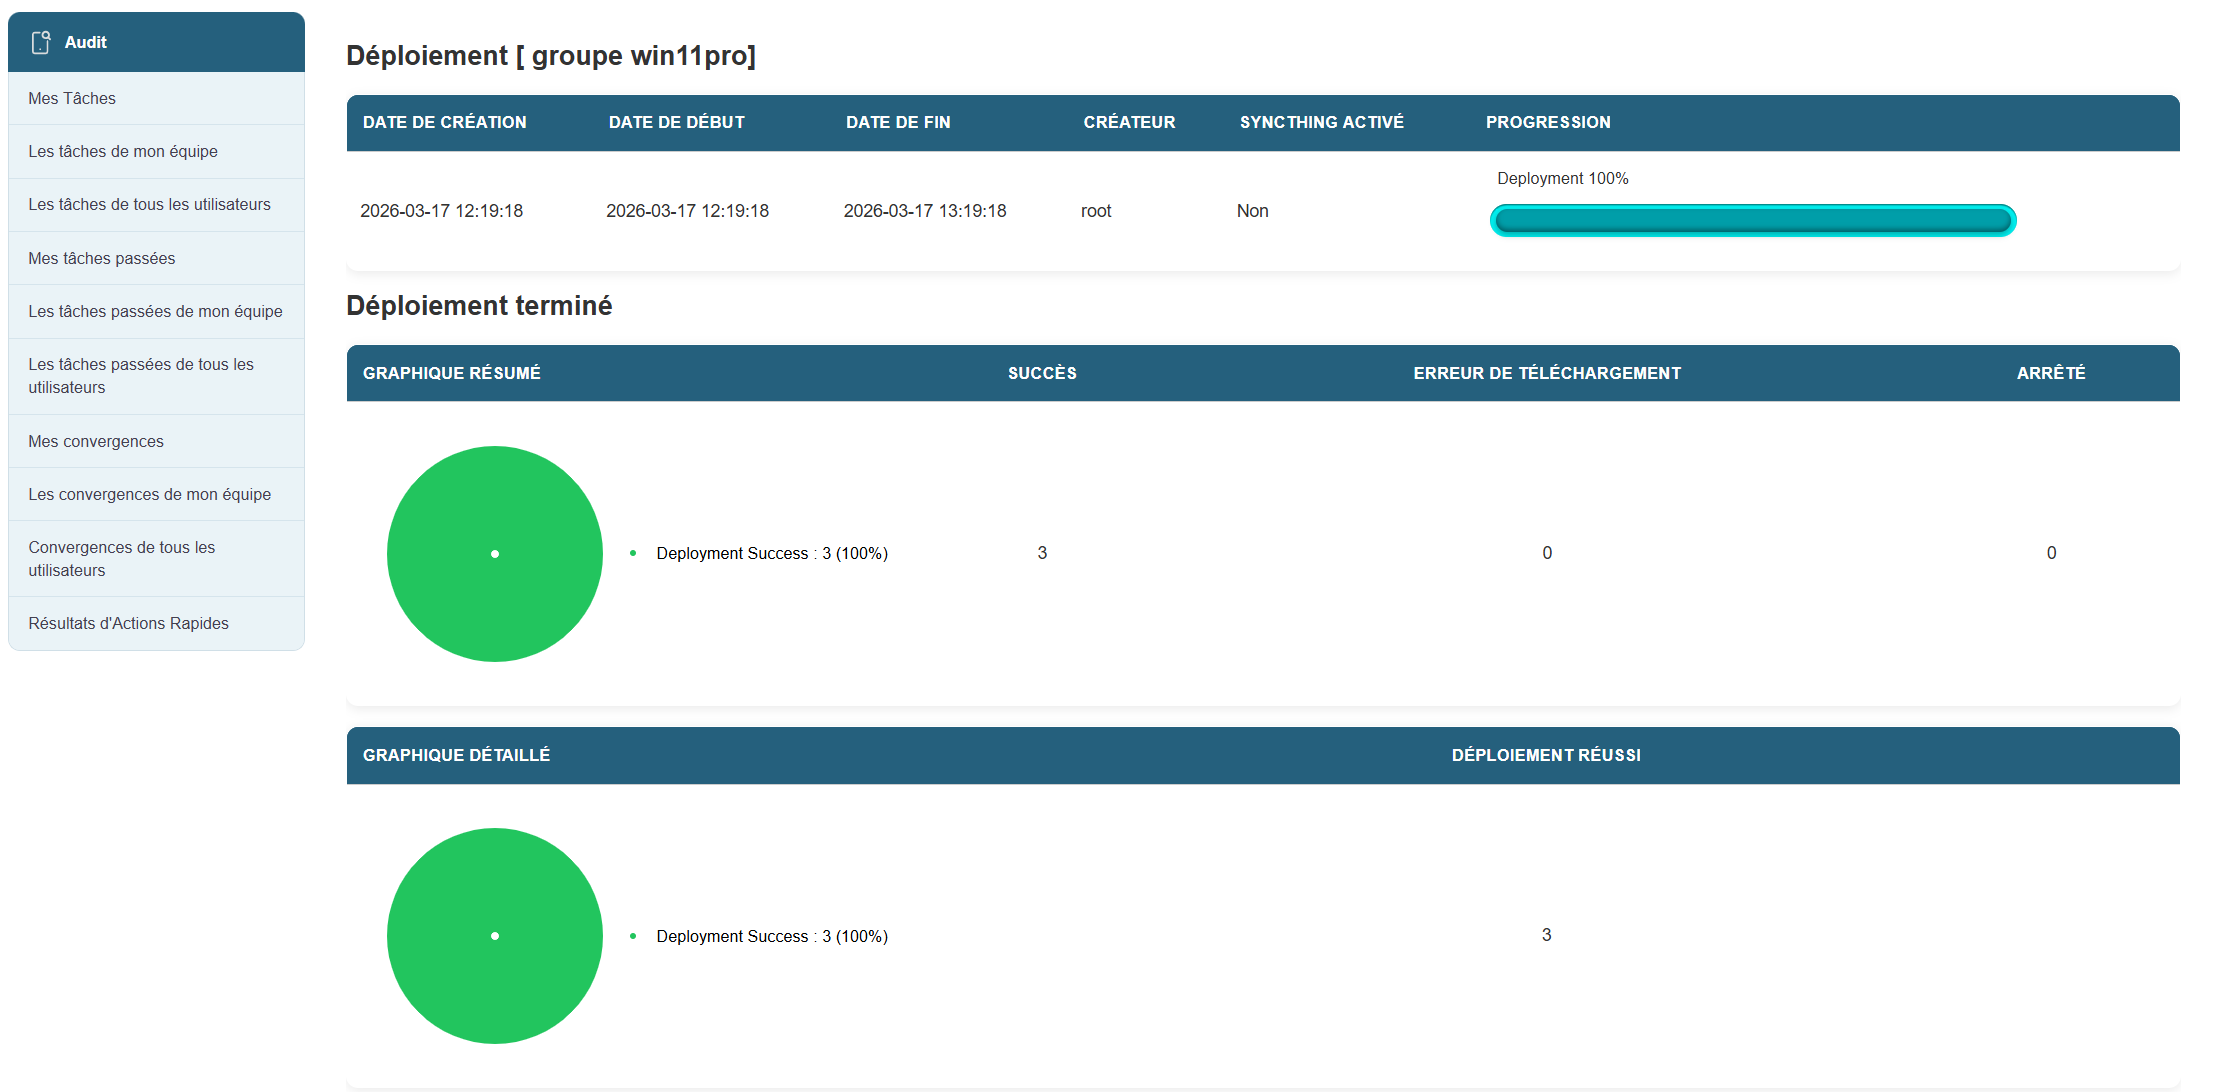
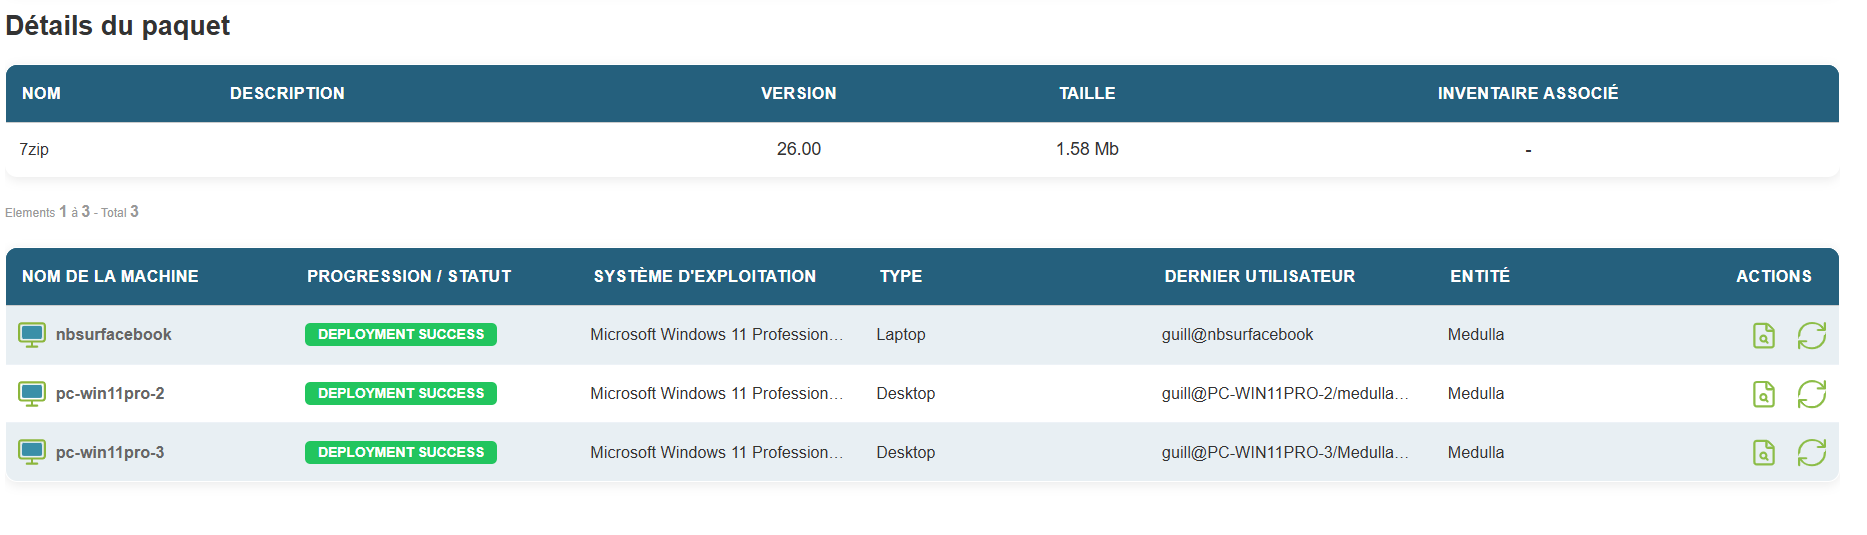
In the second section of the page, you’ll see details of the machines included in the group, along with summary information and two buttons that allow you to:
- view deployment details for the individual machine
- to restart the deployment if it failed.
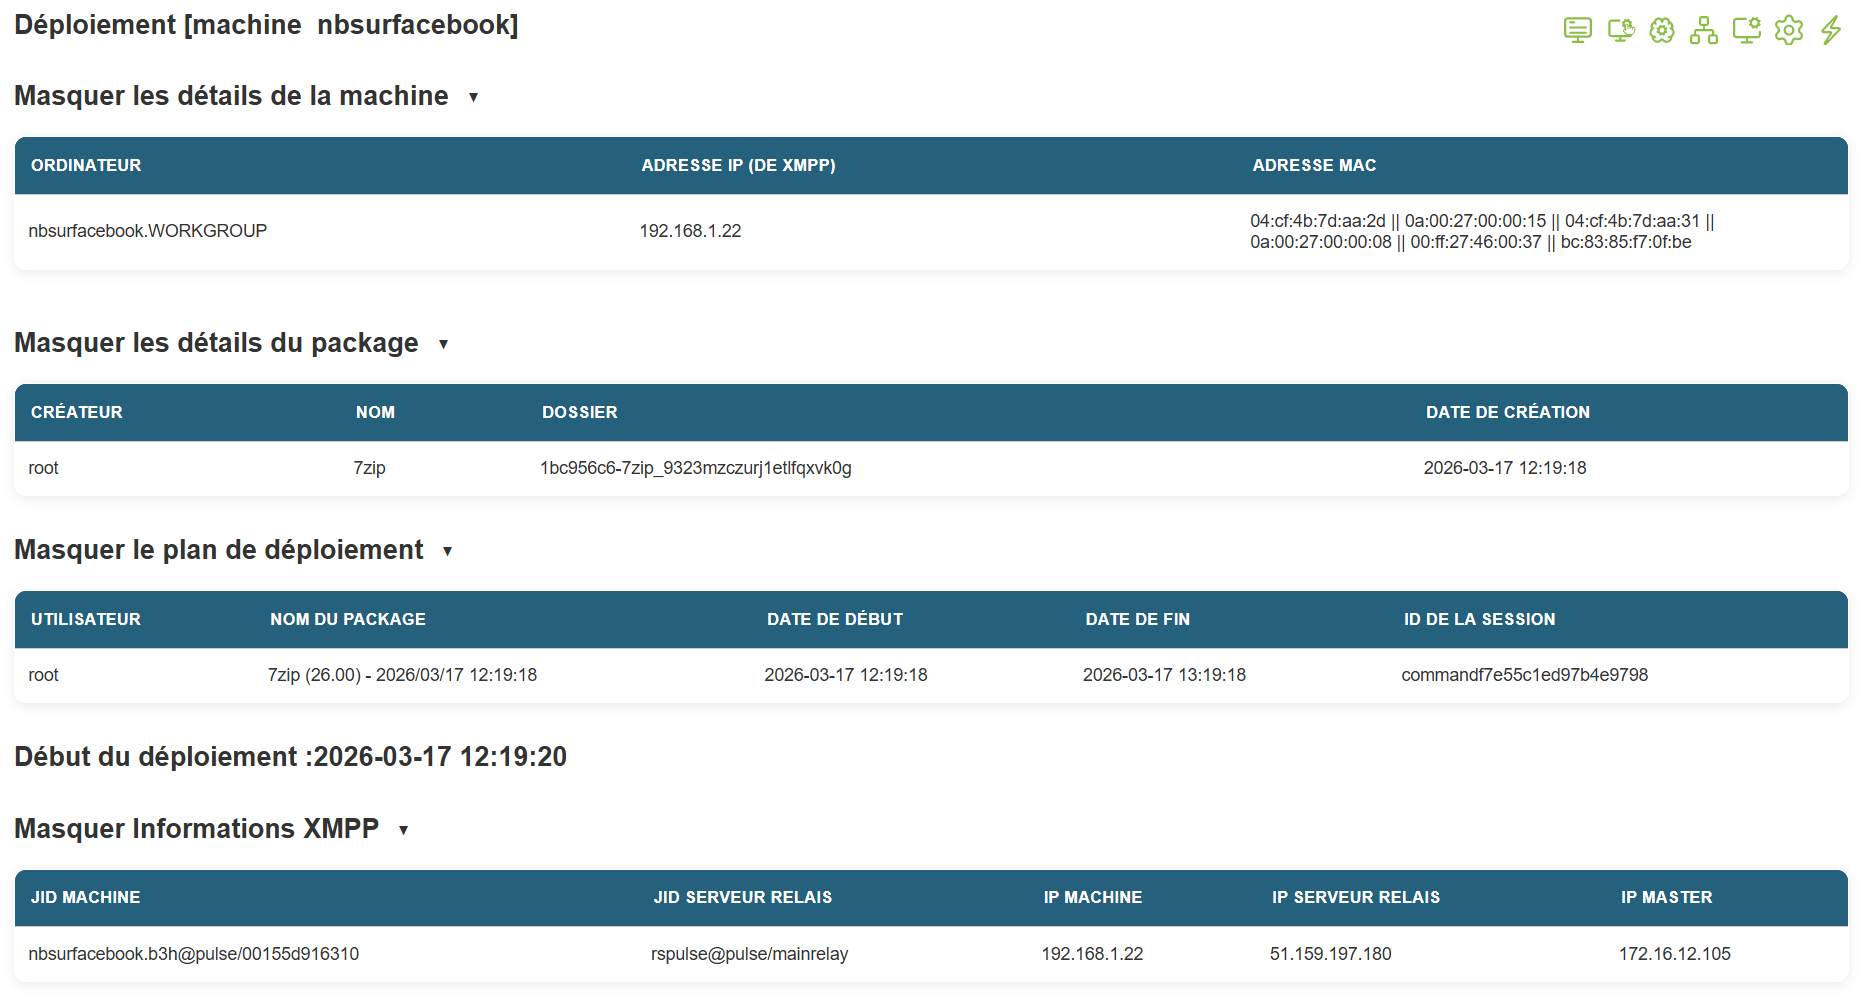
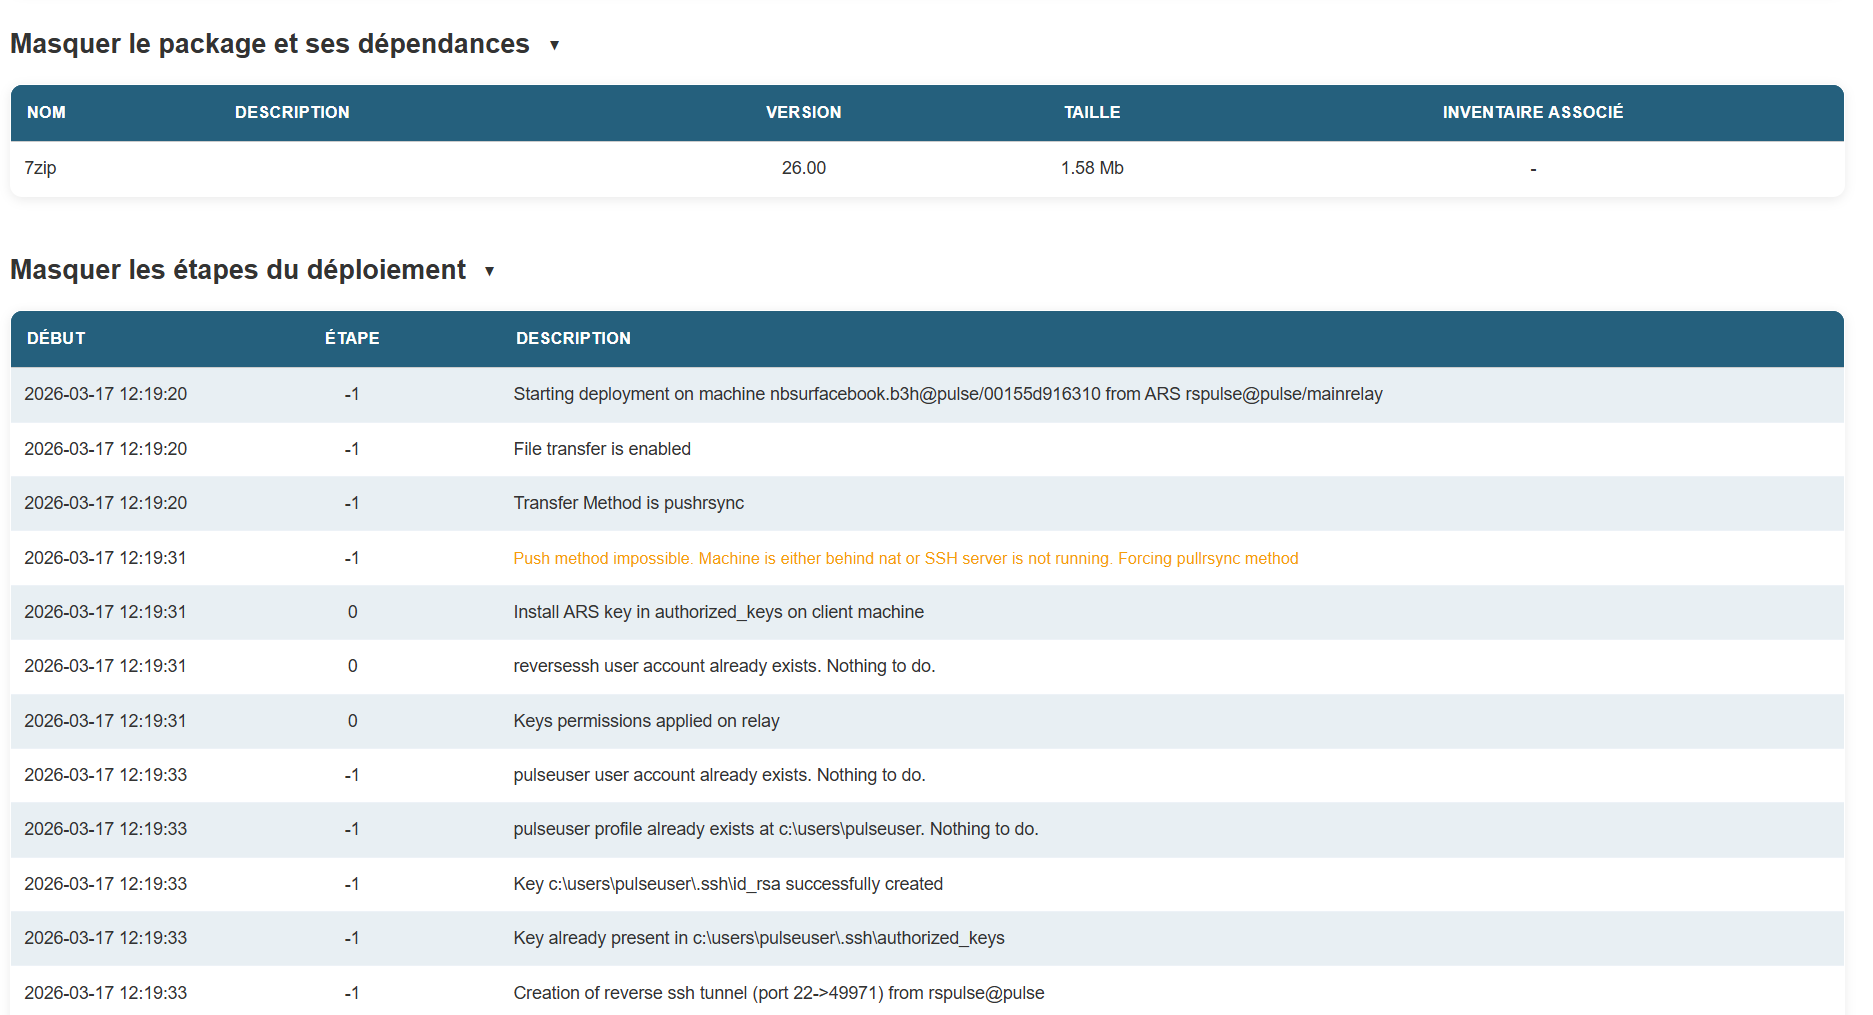
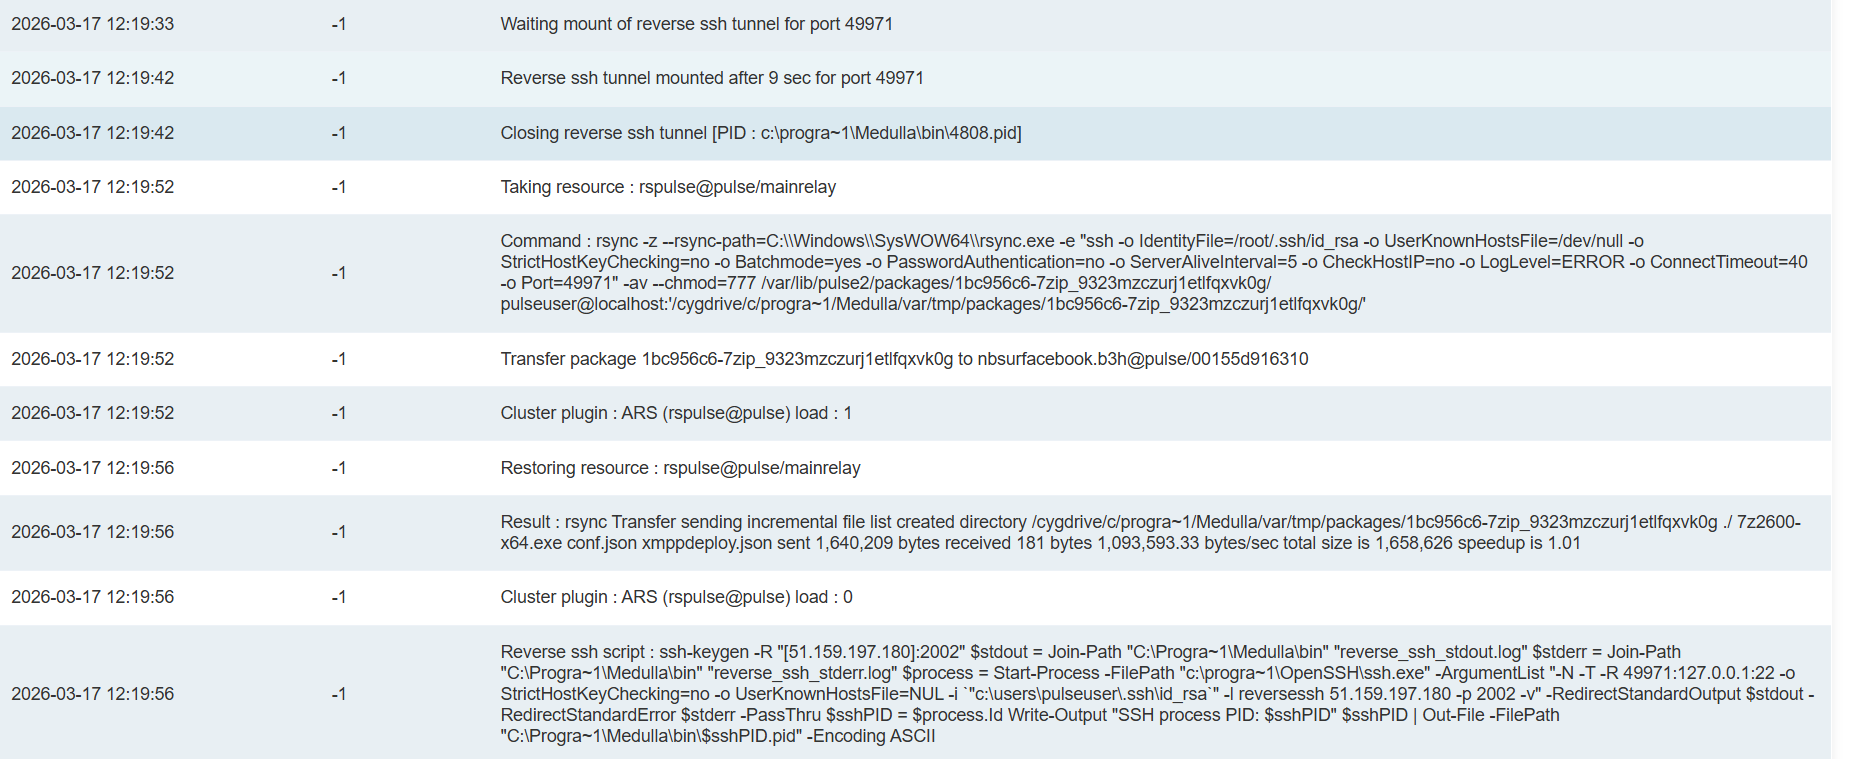
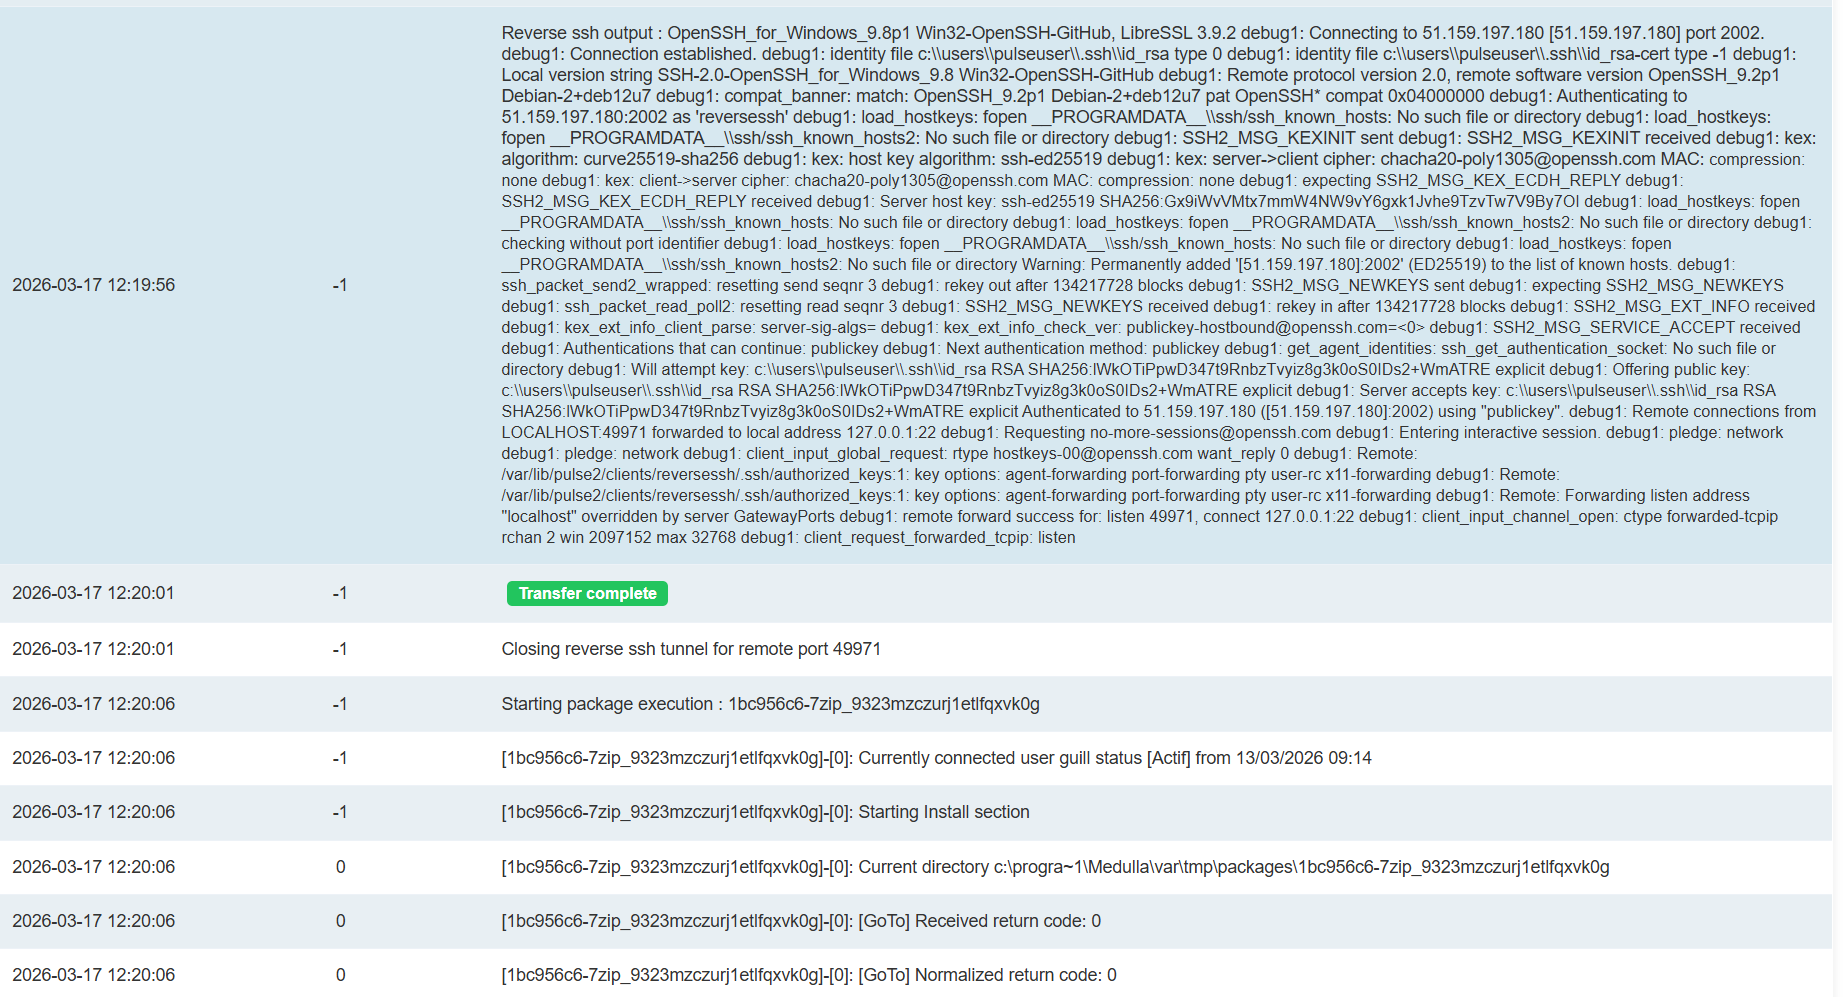
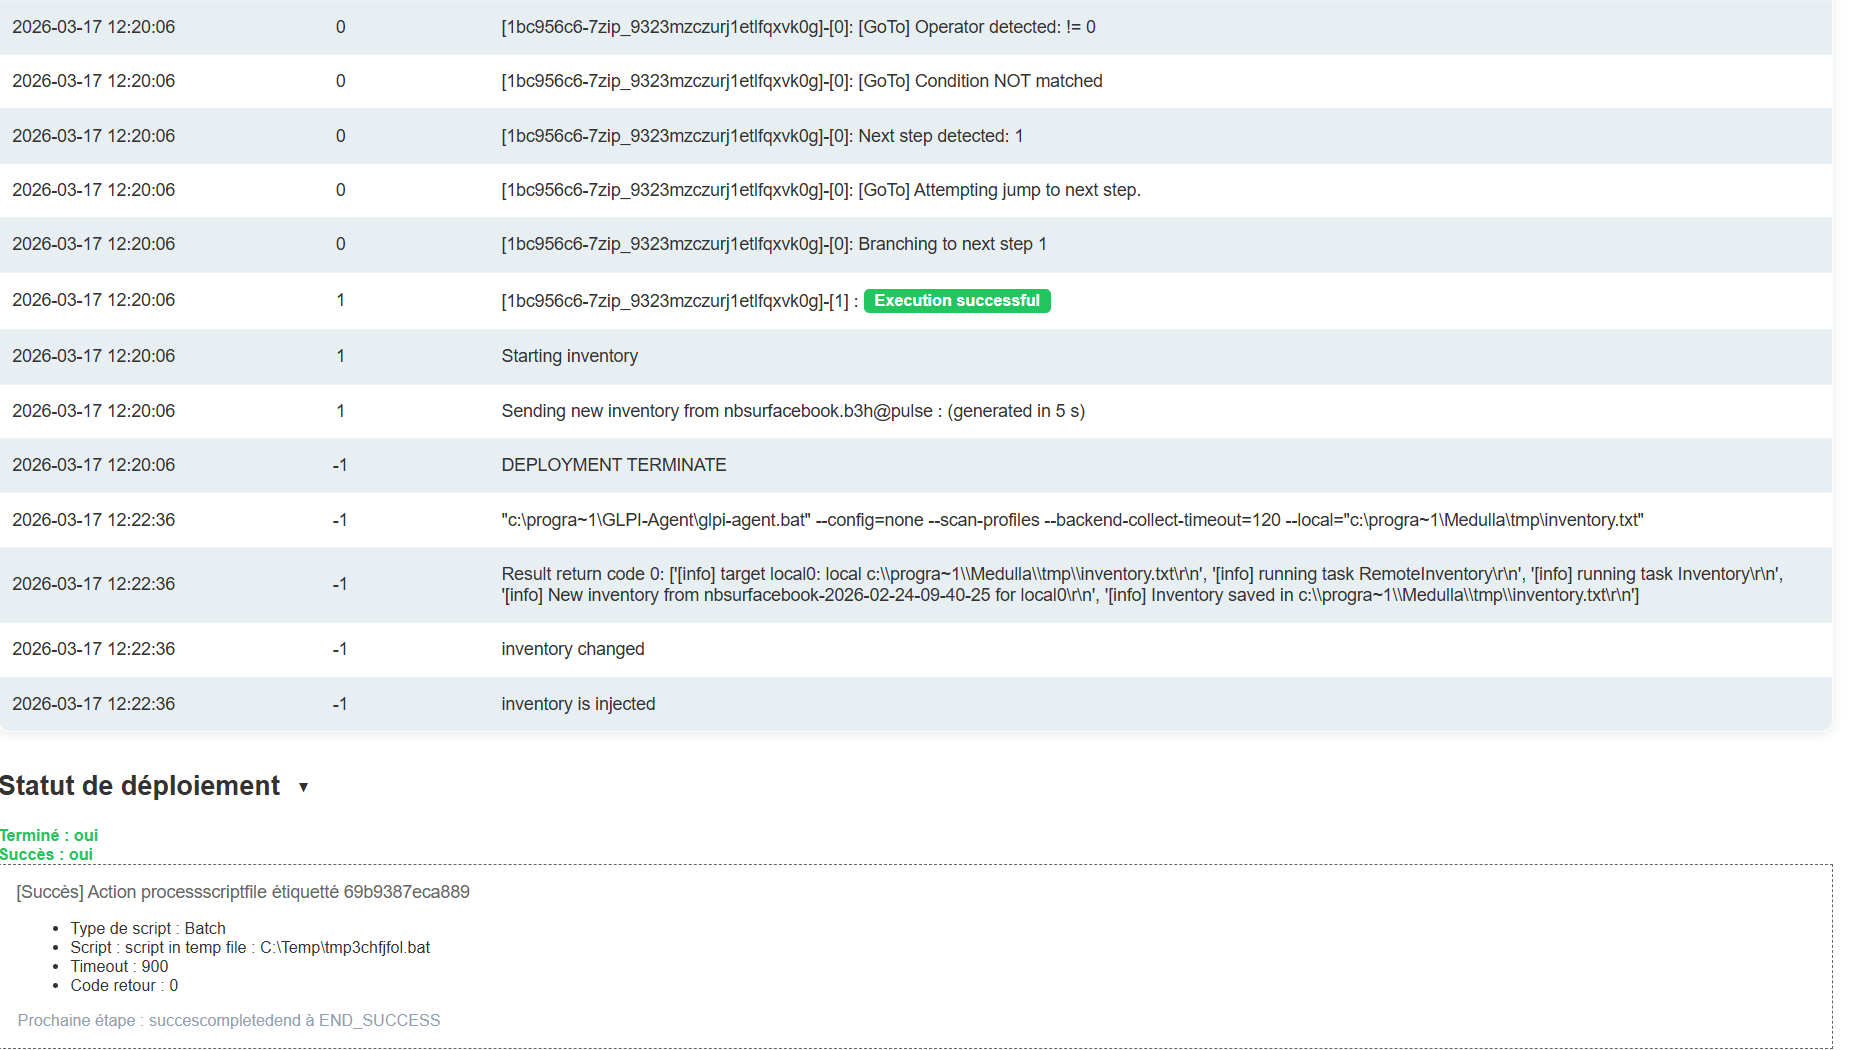
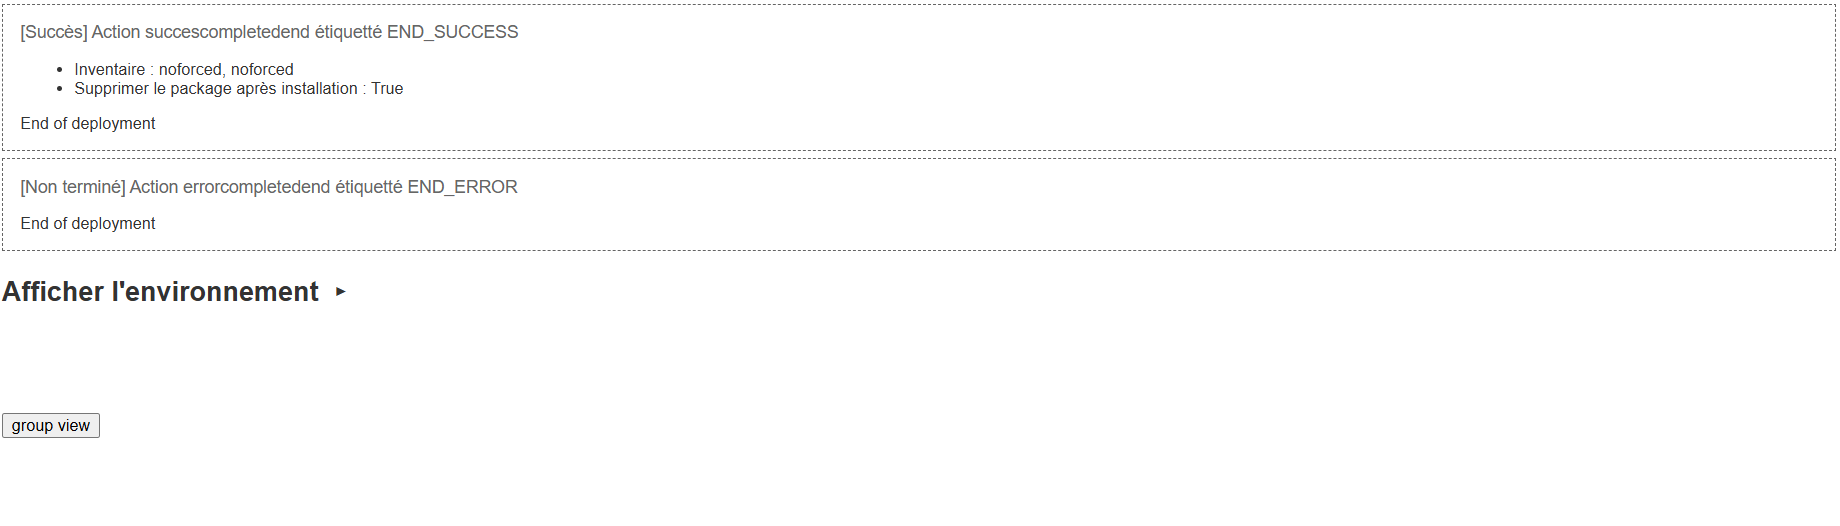
Deployment details for a machine:
The deployment details include every action performed during the deployment phase.
The deployment process at Medulla is divided into three parts:
- Sending the binary to the workstation;
- Executing the installation
- Launching an inventory.
Chapter 10: Updates
How the WSUS update module works.
Medulla offers an effective solution to replace the WSUS (Windows Server Update Services) server. This guide explains how Medulla’s update module works.
How It Works:
Update Source:
Medulla retrieves updates from the wsusscn2.cab file, a database maintained by Microsoft.
Medulla always uses the latest version of this database published by Microsoft.
Updates apply only to Microsoft products, with the exception of major operating system updates (for example, the transition from Windows 10 to Windows 11).
Update Classification:
Microsoft updates are classified by product to meet users’ specific needs.
Medulla supports the following classes:
To enable the desired updates:
In the Updates module, click the button:
Validate Microsoft products and select the relevant products.
Machine Status:
Each machine displays its update status, identified by Knowledge Base (KB) numbers.
Medulla determines the necessary updates for each machine based on the list of machine types, processors, etc.
Creating and Distributing Update Packages:
If necessary, Medulla creates an update package and makes it available.
Based on user-defined management rules, Medulla pushes these updates to the machines.
Product Management:
The selection of products to be included is managed in the database.
Simply request that a specific product be included, and it will be integrated into the update process.
Conclusion
Medulla simplifies and automates update management for Microsoft products, offering an efficient and customizable alternative to the WSUS server. By following this guide, you can configure and use Medulla to keep your systems up to date in the best possible way.
Entity Compliance
Update management is a key factor in ensuring the security, stability, and consistency of your IT environment. Using the tools provided by the platform, you can precisely identify which entities need updating, track overall compliance, and take targeted, phased, and optimized action.
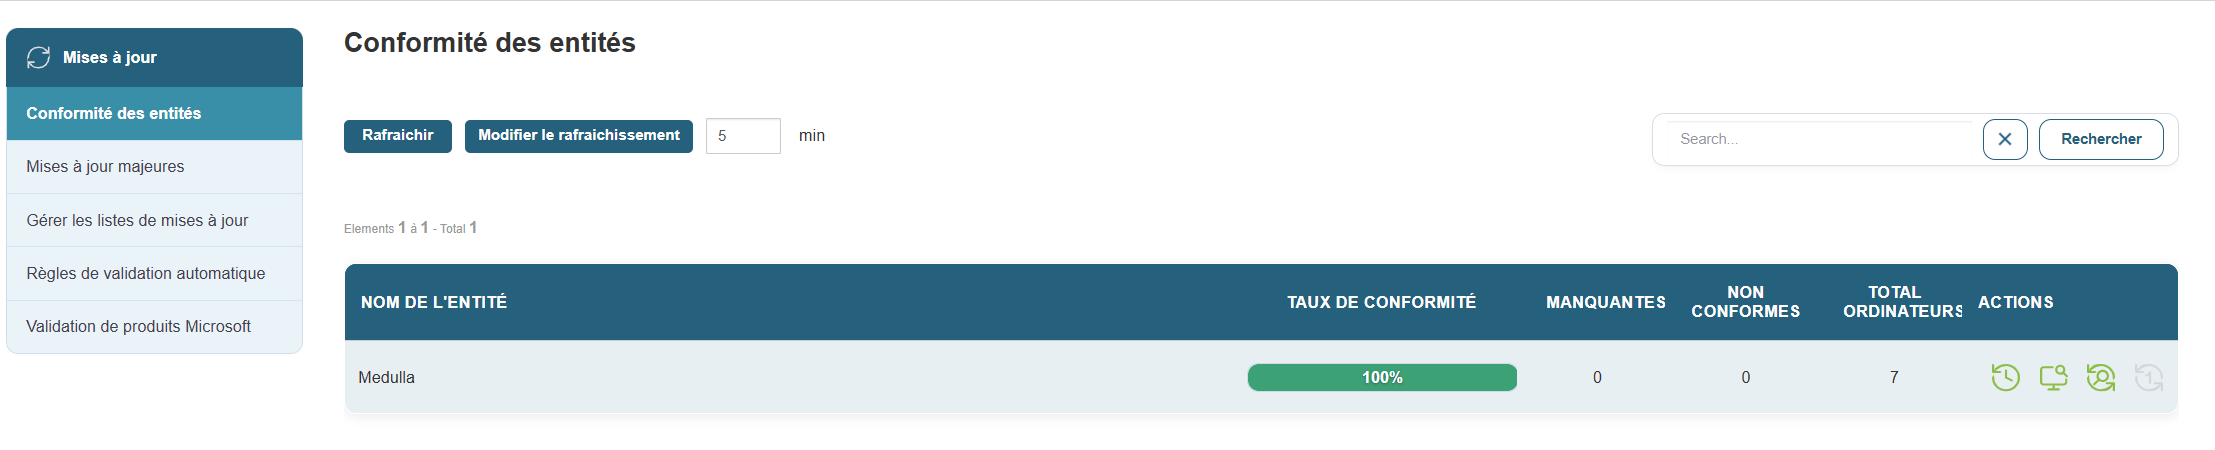
The Entity Compliance section provides a clear overview of the update status for each set of machines. It allows you to immediately identify entities at risk or requiring action.
Access:
Table displayed:
-
Entity Name: e.g., Siveo Medulla, Siveo Medulla > Private
-
Compliance Rate: percentage of up-to-date machines
-
Missing updates: total number of uninstalled patches
-
Non-compliant machines: number of non-standard workstations
-
Total computers: number of machines in the entity
Example:
Available actions:
-
View details: access the complete list of missing updates, including affected workstations and deployment attempt history
-
Search / filter: by entity name, compliance status, or number of missing updates
This view is ideal for planning update campaigns, preparing audits, or measuring the effectiveness of your security policy.
Compliance Tracking
Update compliance is an indicator of your fleet’s health. The higher it is, the more protected and aligned your systems are.
Best practices:
-
Regularly check entities with a compliance rate below 100%
-
Analyze the causes of non-compliant machines (deployment errors, missed reboots, software conflicts, etc.)
-
Launch a new targeted deployment from the affected entity
Managing updates is not just about fixing issues. It is a proactive, continuous, and strategic process. With the compliance tools offered by the platform, you can:
-
Quickly view at-risk devices
-
Intelligently deploy the necessary patches
-
Minimize the impact on the network and users
-
Maintain a high level of security across your infrastructure
Entity Compliance Tracking
Update compliance is an indicator of the health of your IT infrastructure. The higher it is, the more protected and aligned your systems are.
Best practices:
-
Regularly check entities with a compliance rate below 100%
-
Analyze the causes of non-compliant machines (deployment errors, missed reboots, software conflicts, etc.)
-
Launch a new targeted deployment from the affected entity
Managing updates is not just about fixing issues. It is a proactive, continuous, and strategic process. With the compliance tools offered by the platform, you can:
-
Quickly view at-risk devices
-
Intelligently deploy the necessary patches
-
Minimize the impact on the network and users
-
Maintain a high level of security across your infrastructure
Manage update lists
Medulla’s update management module replaces Microsoft’s WSUS solution.
How it works:
The Medulla server retrieves the list of updates—available based on the criteria defined during server installation or configuration—and makes them available to the various client machines managed in Medulla. Each client machine requests the updates it needs from the server; once the server has a complete list of each machine’s requirements, it downloads the relevant updates and makes them available to the clients. Each client workstation will then request the installation of the updates it needs based on the settings of the update lists (Manual Installation, Automatic Installation, or Block Updates).
This operating principle works on a per-entity basis. For each entity, you can manage different update lists.
How it works:
In the interface, updates will appear on the "Manage Update Lists" page:

By default, updates are added to the gray list, which corresponds to manual updates.
Several options are available:
![]() Enable for manual update
Enable for manual update
![]() Disable for manual update
Disable for manual update
![]() Approve for automatic update
Approve for automatic update
![]() Block the update
Block the update
If you approve for automatic updates, this moves the update to the whitelist, and all client machines that need this update will then retrieve and install it.
If you click "Block update," the update is moved to the blacklist and will not be offered to any client workstations.
Upgrading to major OS versions.
The update module in Medulla allows you to perform version updates directly from the Medulla interface via the Major Updates tab:

By clicking the Major Updates button, you will see the compliance view and view machines sorted by entity.
For each entity, you will see information ranging from Windows 10 versions up to the update from Windows 10 to Windows 11.
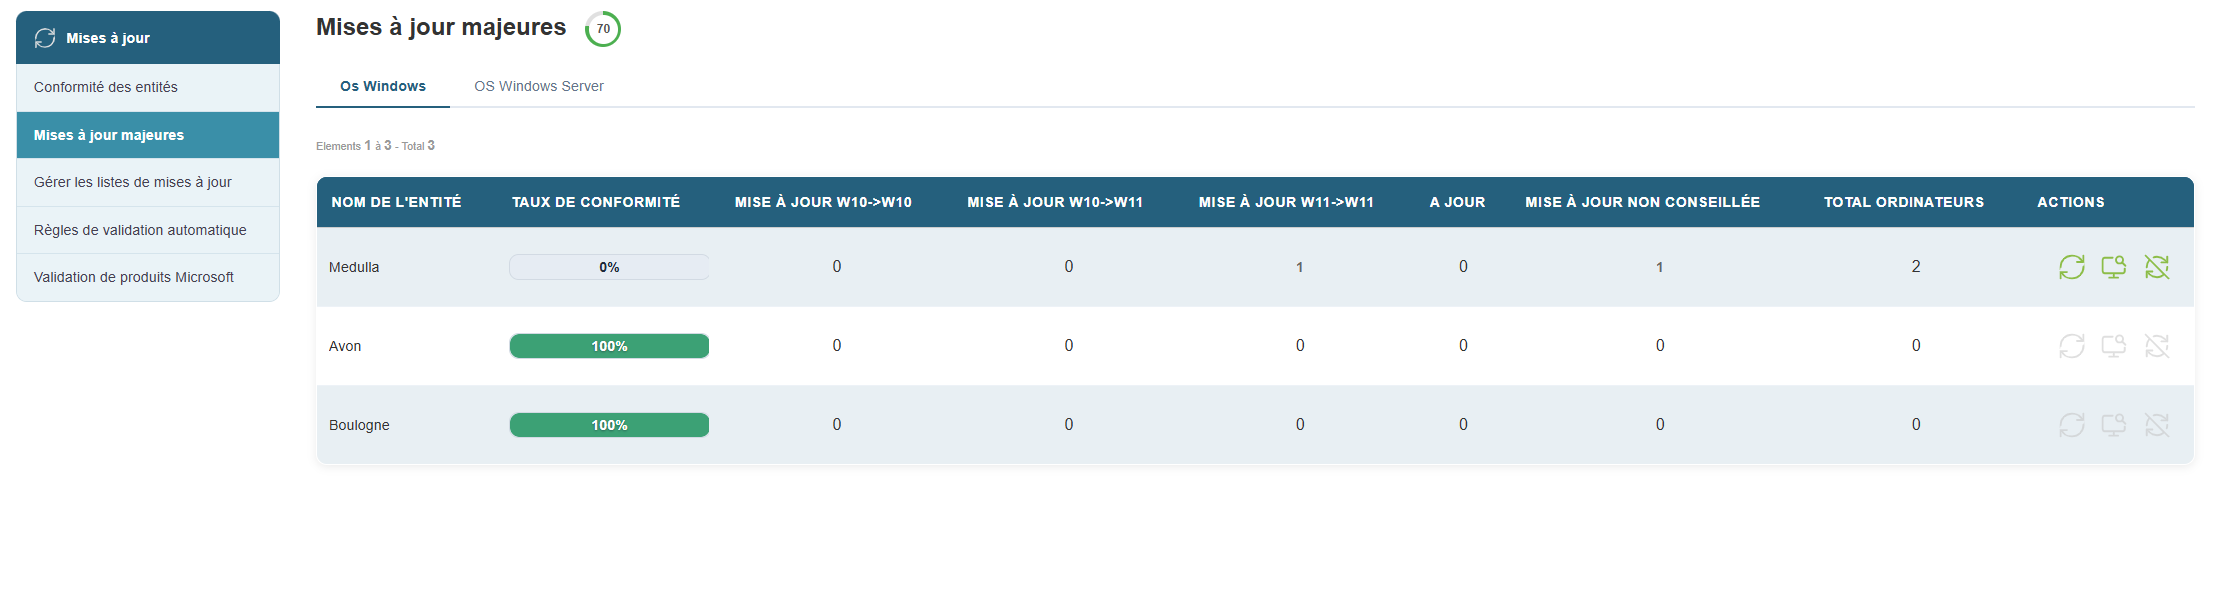
Among the information provided are the number of machines, updates from Windows 10 to Windows 10, and updates from Windows 10 to Windows 11.
Medulla includes Microsoft’s prerequisites for upgrading to Windows 11.
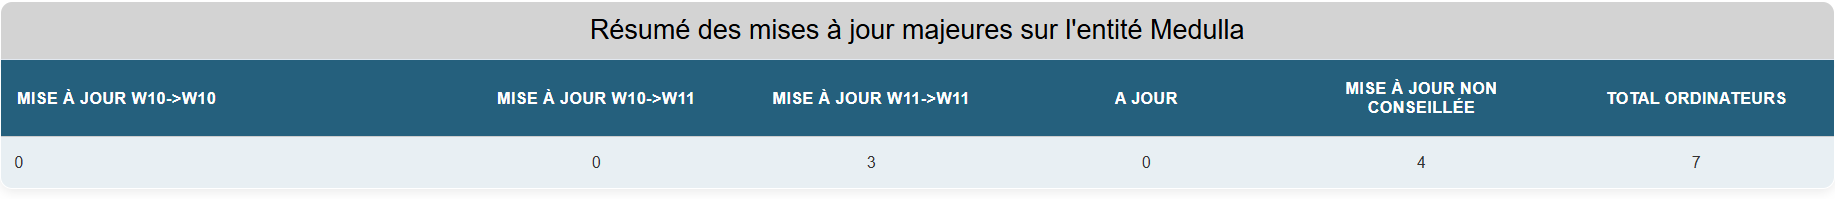
In the image below, we can see that 4 machines do not meet Microsoft’s requirements for upgrading to Windows 11.

Among the actions available on this page:
![]() This icon allows you to deploy available major updates. If, as shown here, it is grayed out, this means that no machine requires an update or that no machine meets the conditions to receive an update.
This icon allows you to deploy available major updates. If, as shown here, it is grayed out, this means that no machine requires an update or that no machine meets the conditions to receive an update.
![]() Details per machine in the entity (this provides a history for each machine).
Details per machine in the entity (this provides a history for each machine).
![]() This action lists the machines that cannot be updated to Windows 11 until the prerequisites are met;
This action lists the machines that cannot be updated to Windows 11 until the prerequisites are met;
By clicking on the details per machine, you will see the following information:
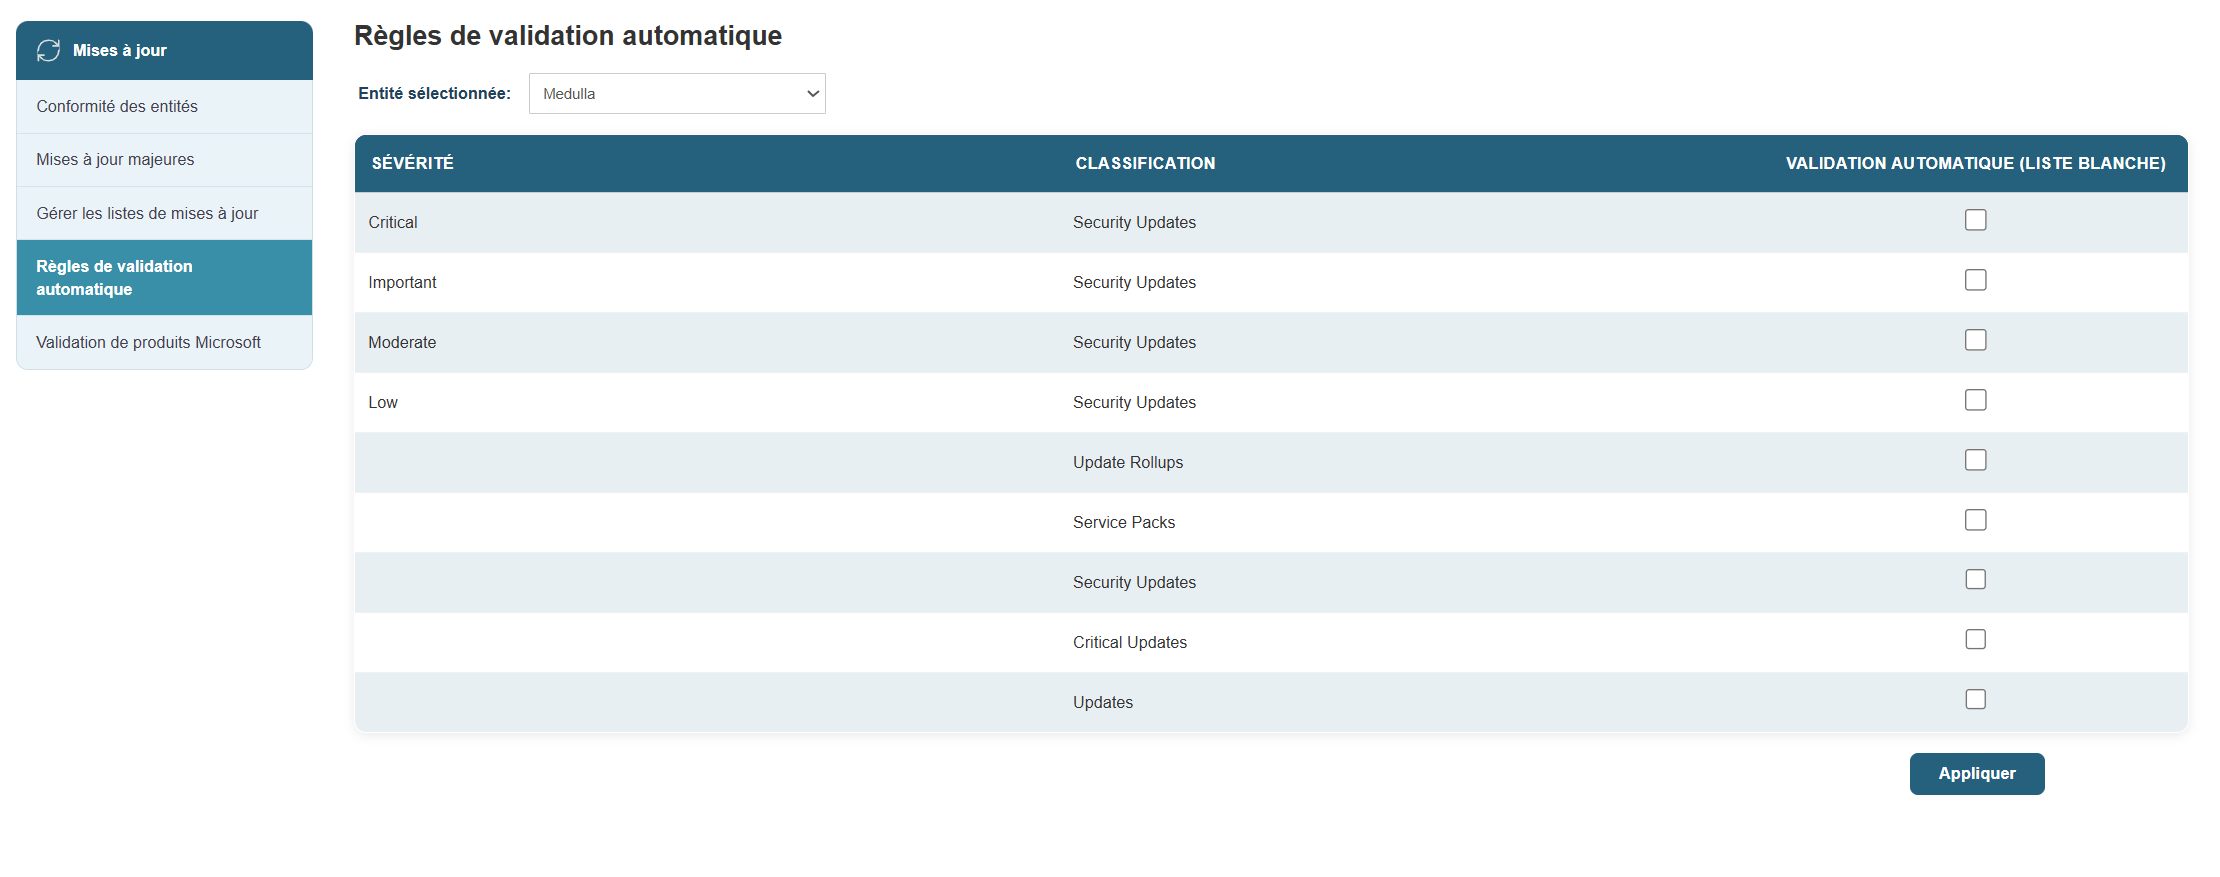
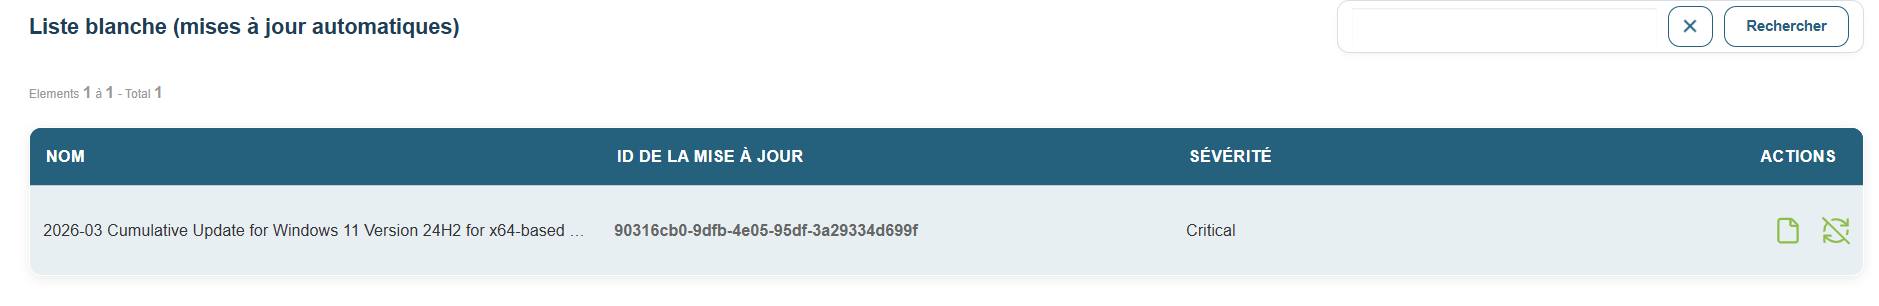
Automatically approve whitelisted updates.
In Medulla’s WSUS module, an option allows you to automatically approve a type of update and thus automatically whitelist it.
Once whitelisted, these types of updates will be deployed to the machines that require them.
To do this:
Click on the Updates tab in the Medulla interface, then click the button in the left-hand menu:

Select the types of updates you want to automatically whitelist. Then click the "Confirm" button.
You will then be redirected to the page.

You will then be able to see the updates automatically approved in the whitelist:
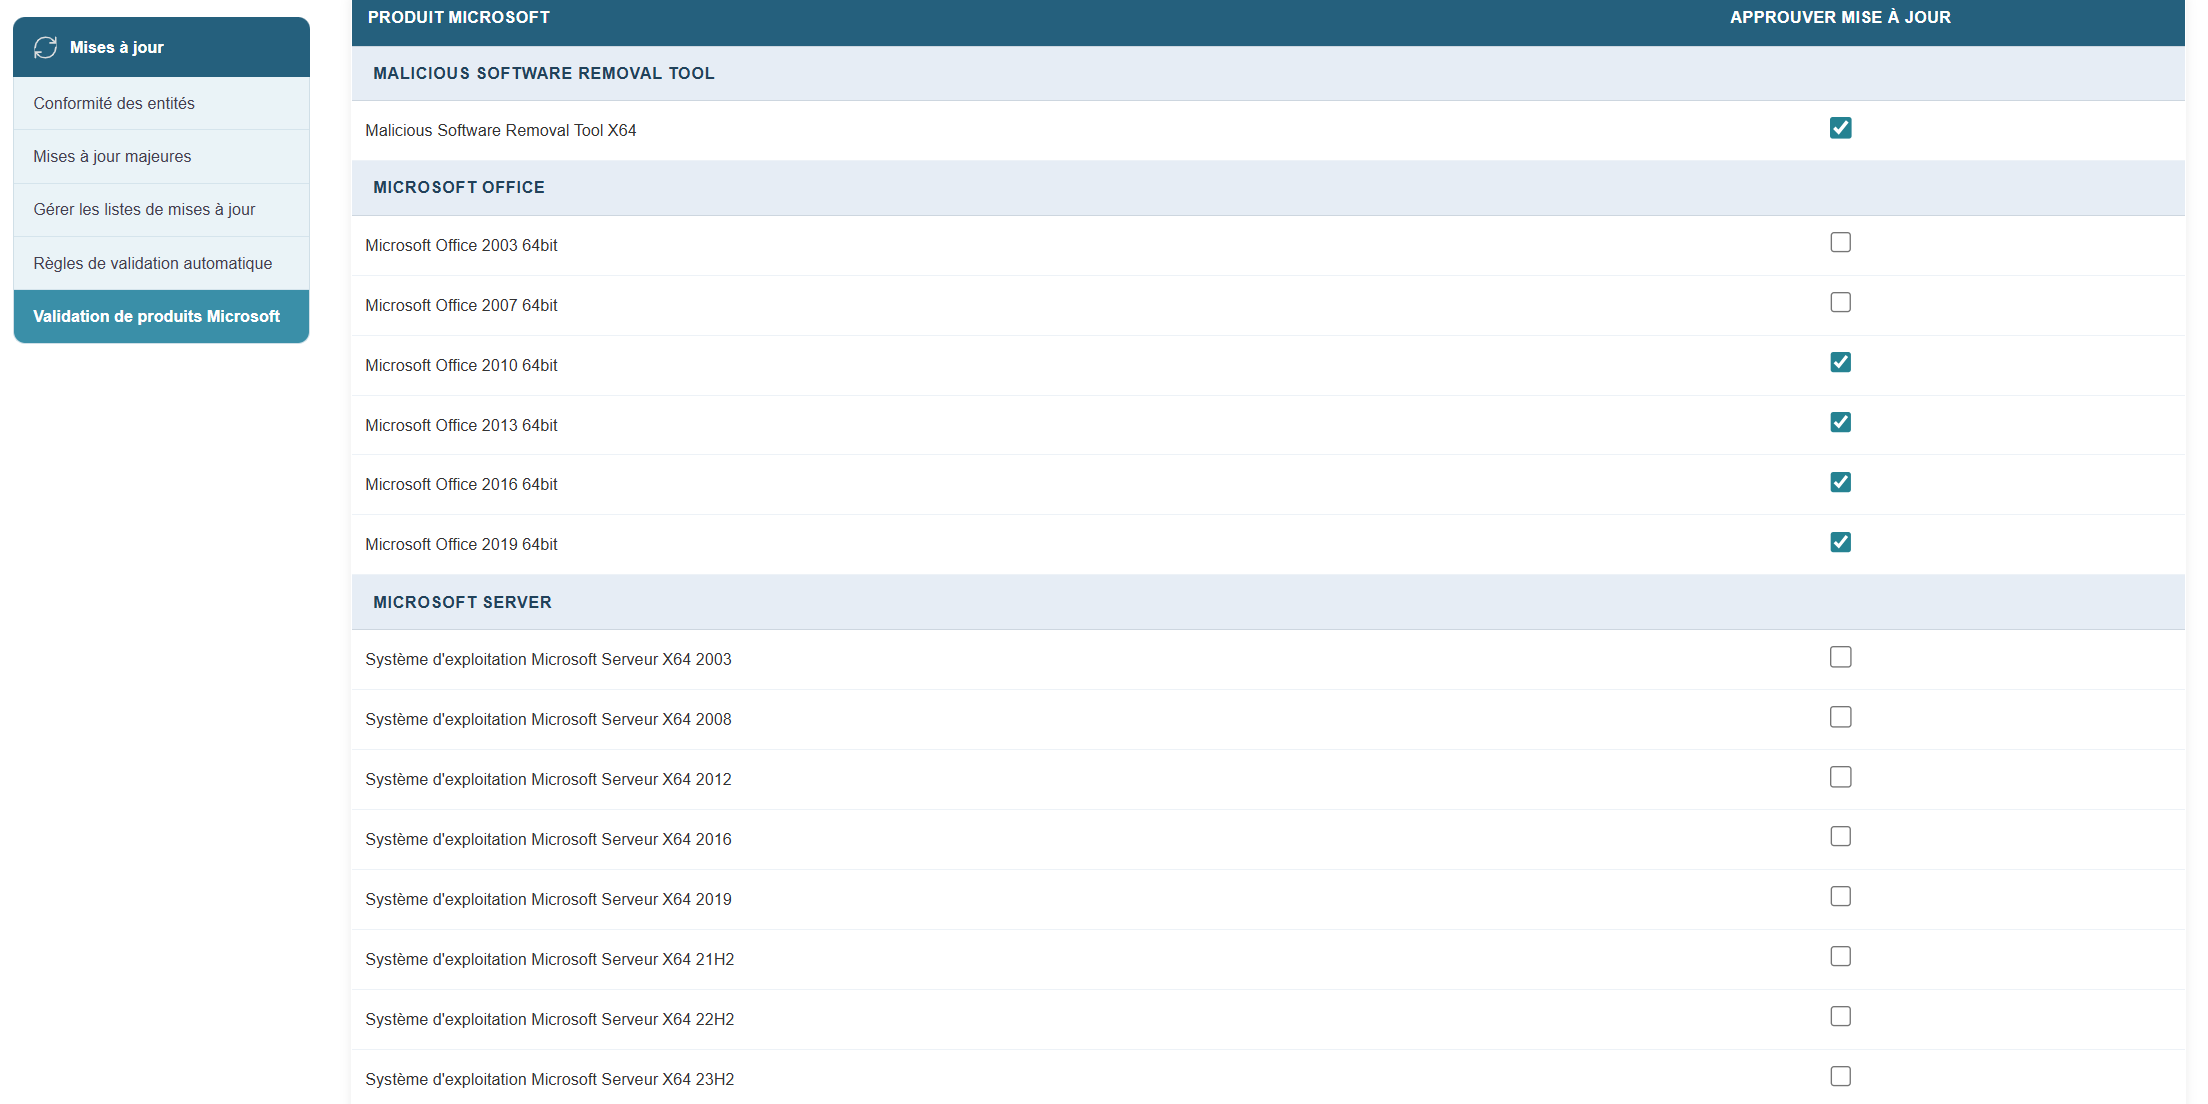
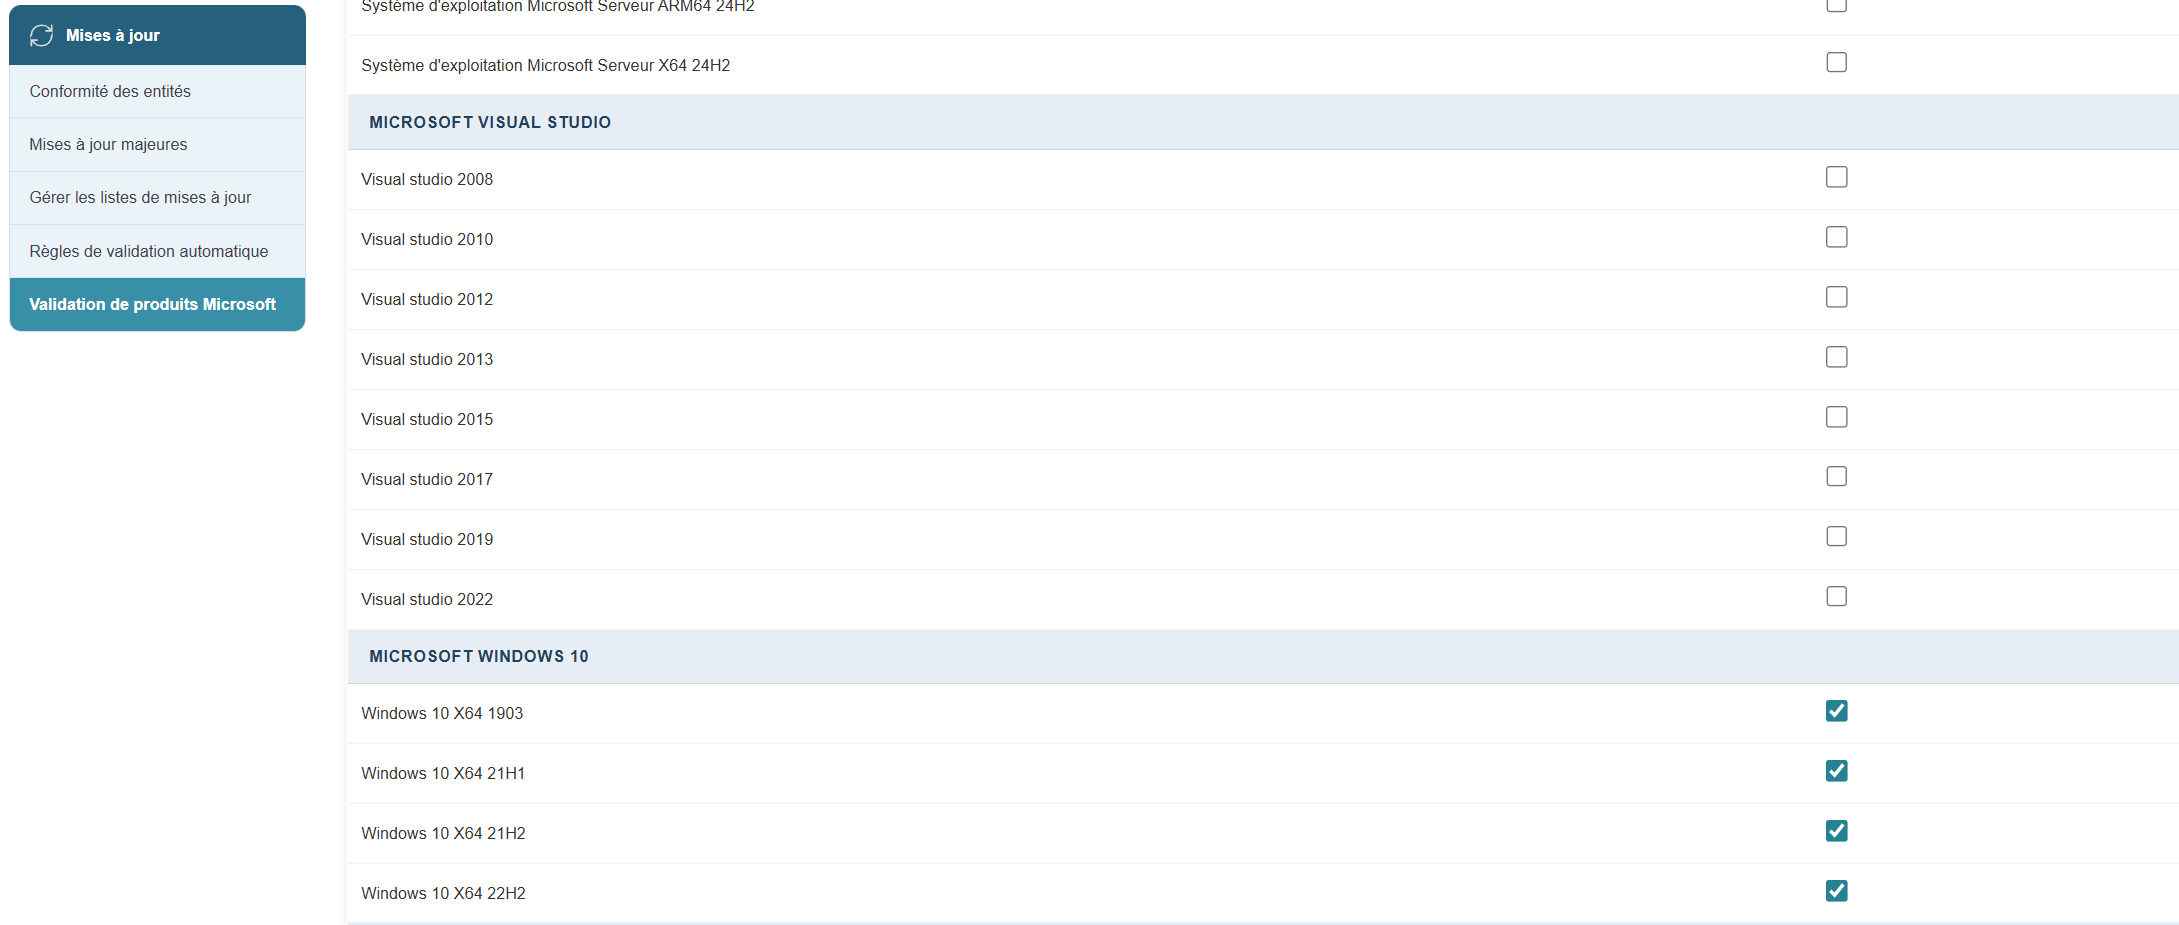
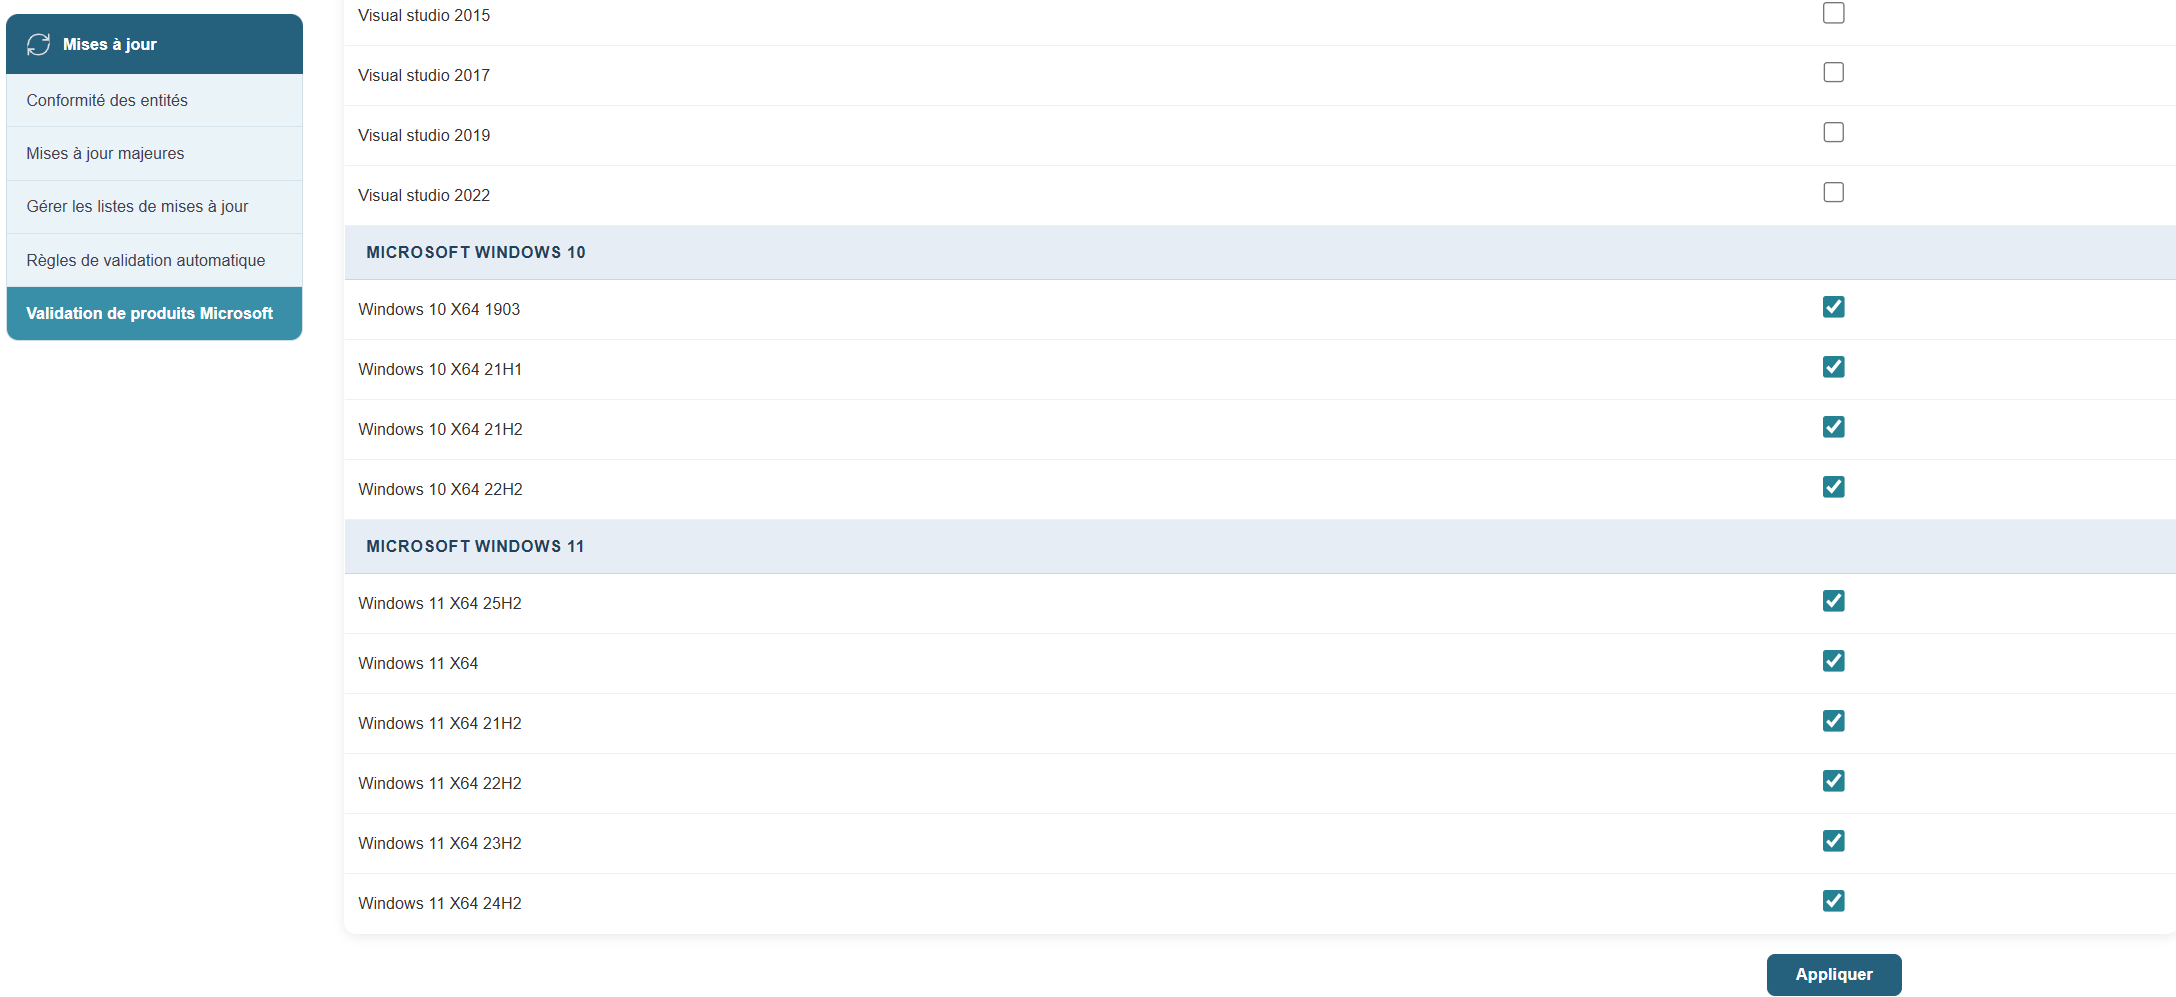
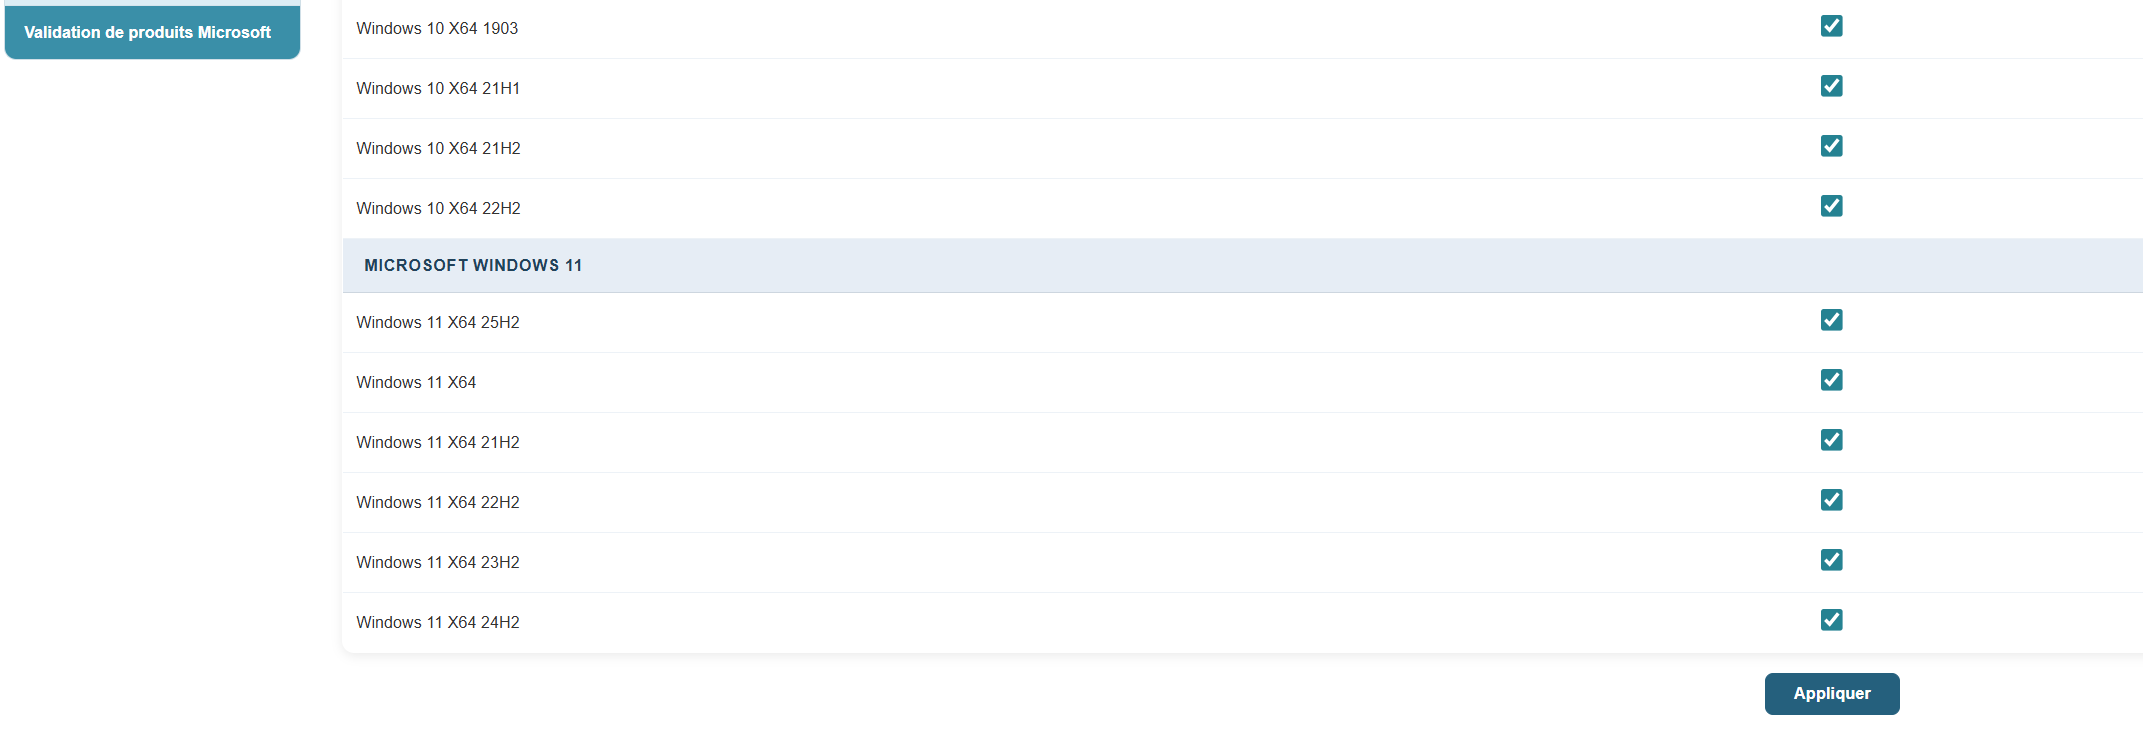
Microsoft Product Validation
By going to the "Microsoft Product Validation" submenu, you can choose whether or not to validate a Microsoft product category for updating.

This system prevents your update module from being cluttered with products you do not wish to manage.
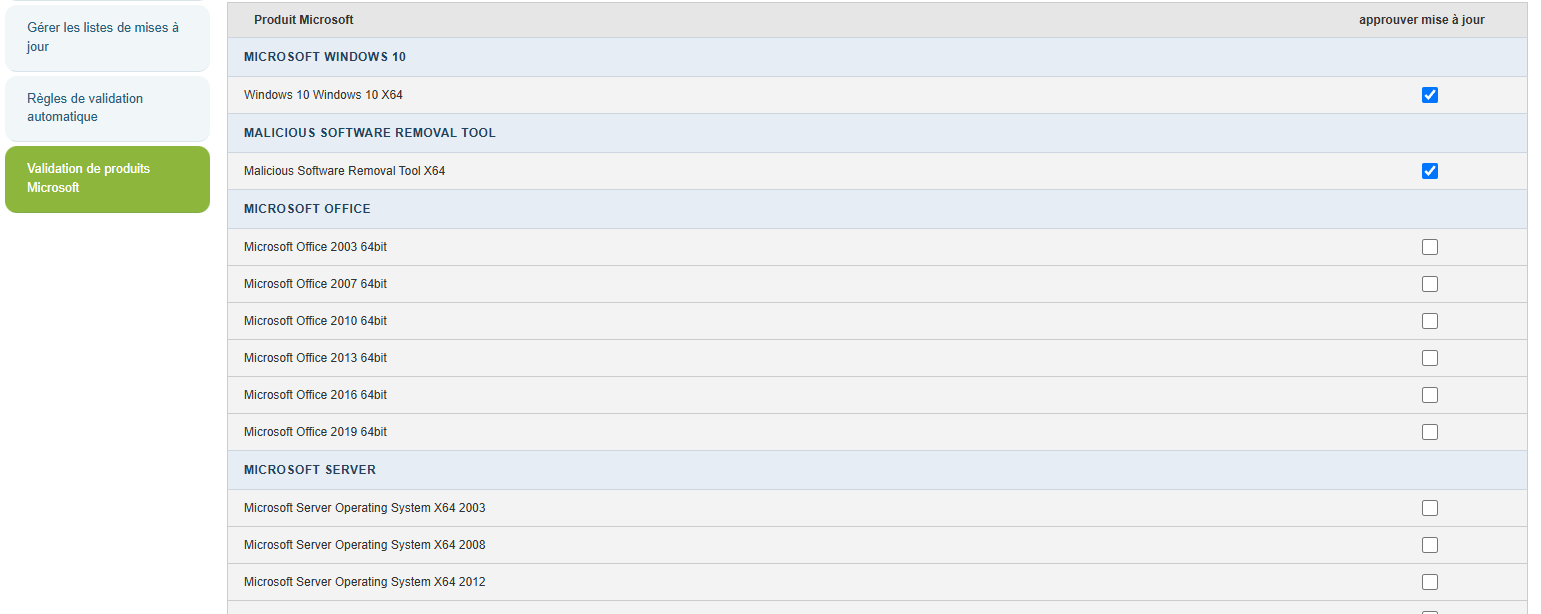
Simply check the boxes for the desired products and click the "Apply" button at the bottom of the page.
Chapter 11: Backup
Enable backup
A good backup policy is the key to a resilient infrastructure. Whether due to hardware failure, human error, or an attack, a properly configured backup solution ensures you can quickly restore data and maintain business continuity without interruption.
Backups can be enabled on a per-user basis or via shared profiles. This allows you to precisely define what needs to be protected.
Access:
Steps:
-
Select the relevant profile or workstation.
-
Click Configure Backup.
-
Define the scope of the backup:
-
Specific files/folders
-
Full workstation backup
-
-
Choose the frequency (daily, weekly, or custom).
-
Click Enable Backup.
Once the backup is active, it runs automatically according to the defined schedule, without interrupting the user.
Track backups
Real-time backup monitoring allows you to verify that all tasks have been executed correctly.
Access:
In case of an error:
-
View the detailed logs.
-
Identify the cause (network connection, insufficient disk space, etc.).
-
Set up alerts to anticipate problems.
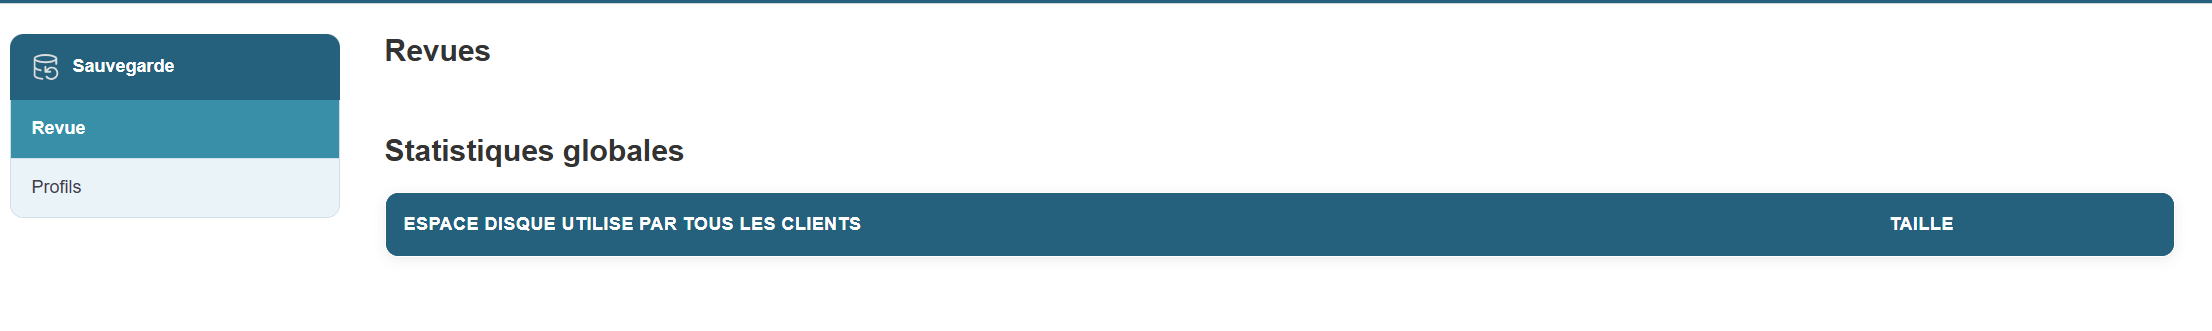
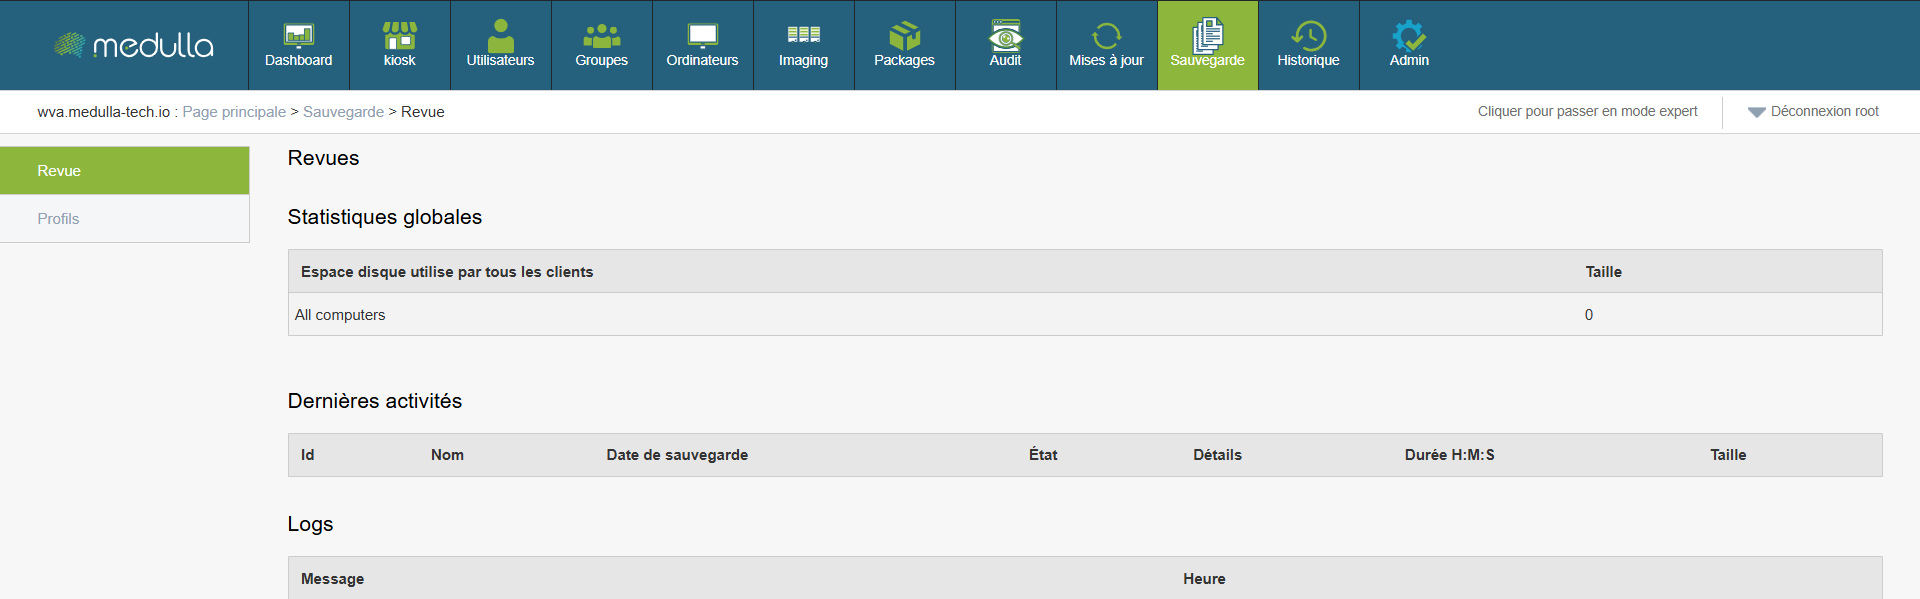
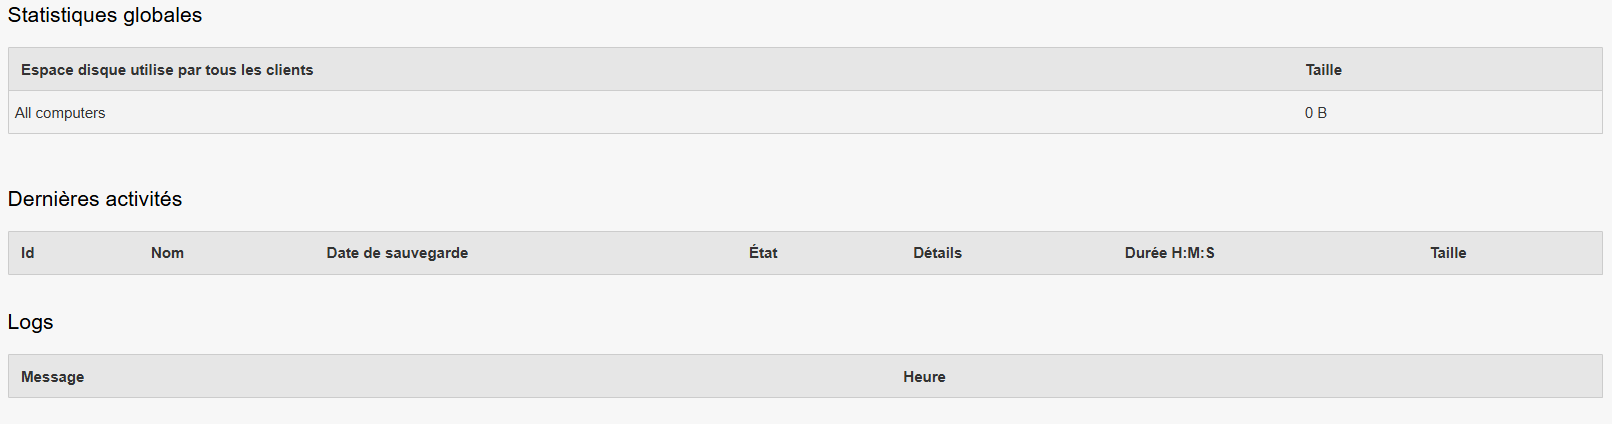
Overall statistics
You have key metrics to assess the overall status of your backups.
Access:
Review > Global Statistics
-
Disk space used: total size of backups across all clients
-
Active / backed-up machines
-
Successful / Failed Backups
Implementing a backup strategy is not just about preventing data loss—it’s about ensuring business continuity. With the platform, you can:
-
Monitor all activities in real time
-
View your overall efficiency through statistics
Chapter 12: History
Access the logs
This chapter presents the various features related to system history via logs. Each section is described step by step to facilitate the viewing, analysis, and use of recorded events.
Objective: View the events recorded by each system component.
Steps:
-
Open the administration interface.
-
Click the Logs tab in the main menu.
-
A list of modules appears, including:
-
inventory logs -
backup logs -
deployment logs -
quick-action logs -
download logs -
kiosk logs -
packaging logs -
remote access logs -
imaging logs
-
-
Select the module whose logs you want to view.
-
The events appear immediately in the table located below the "Log" heading for the selected log.
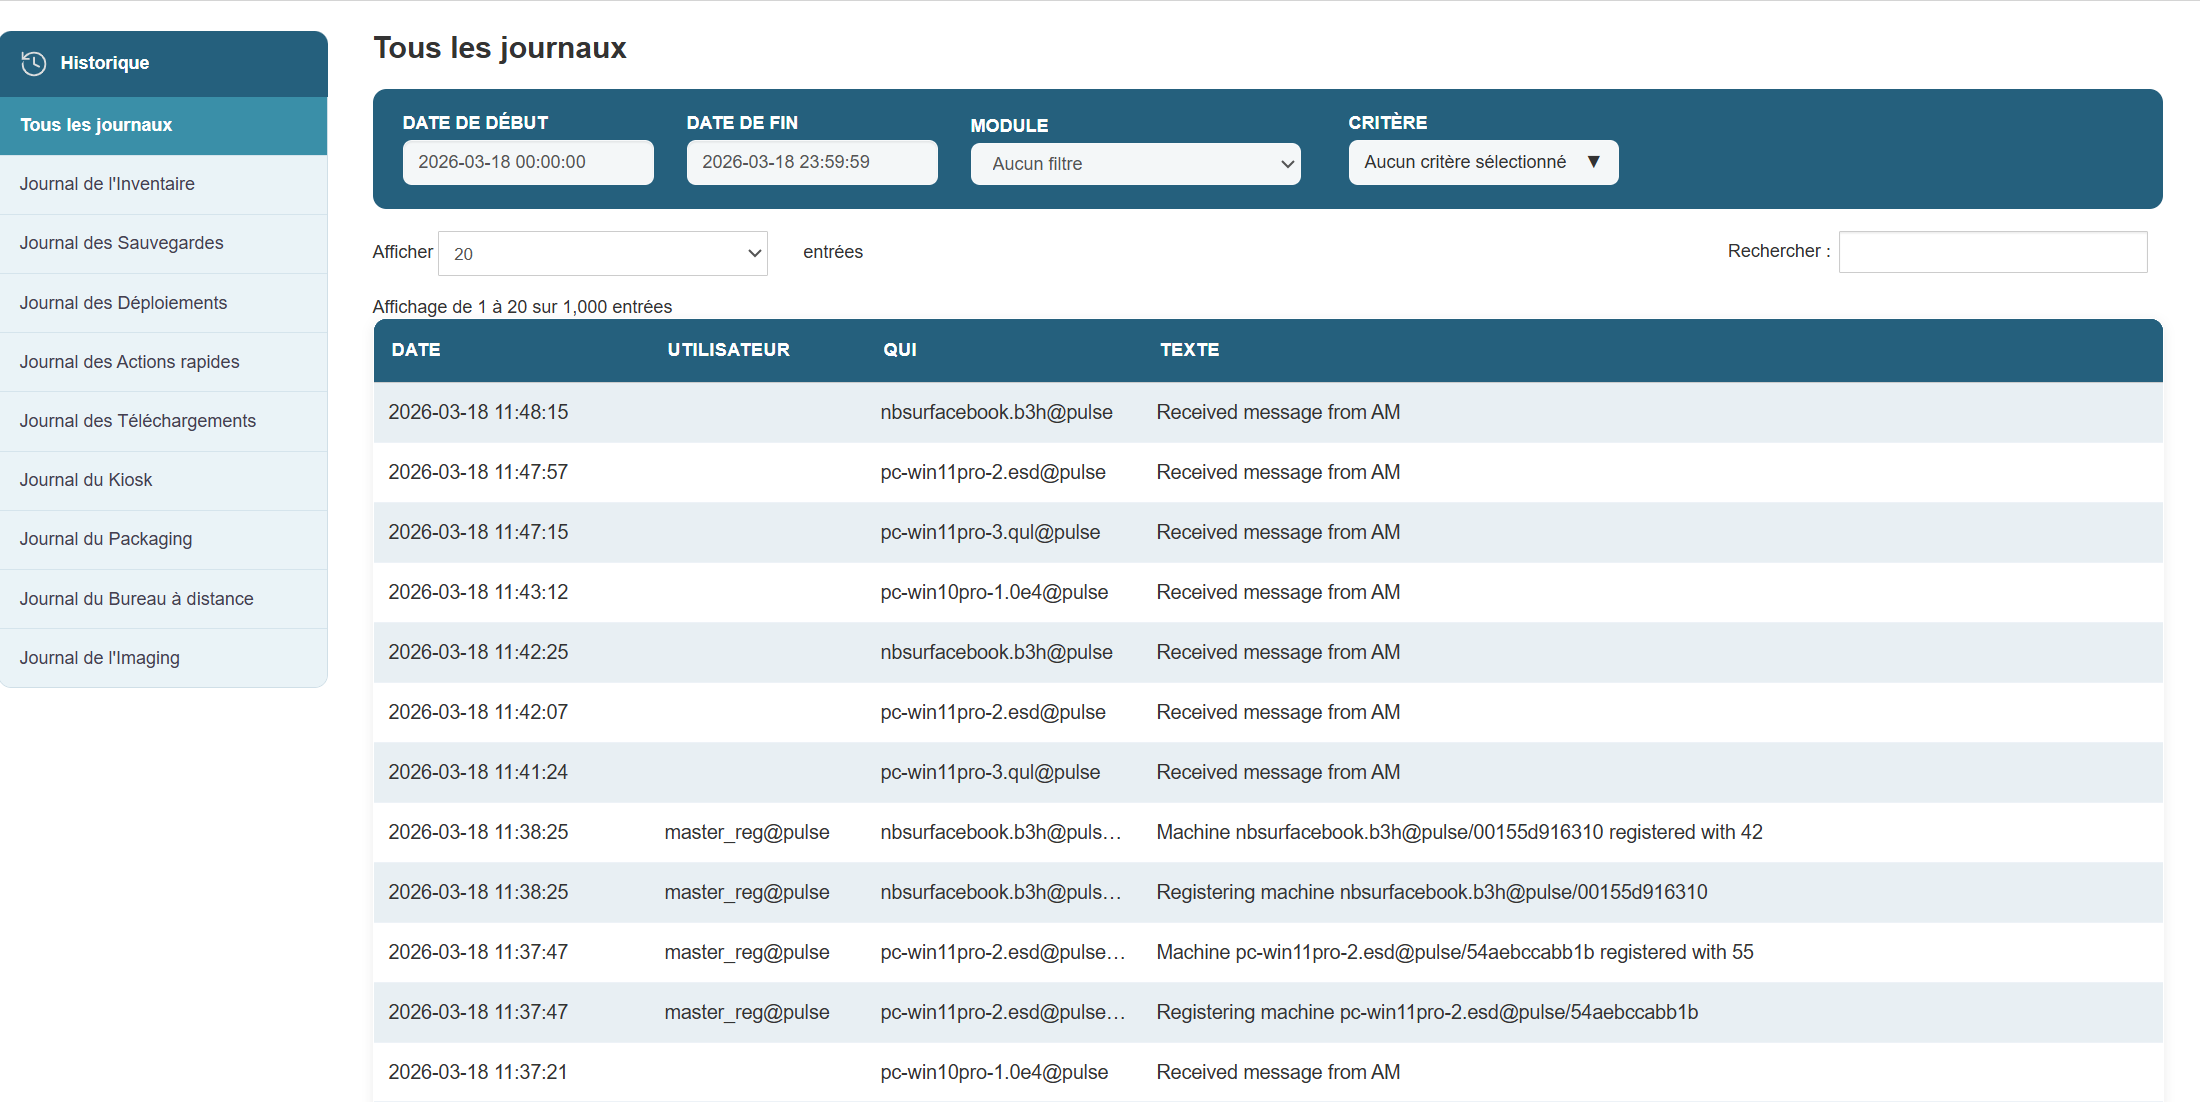
Search and filter logs
To quickly extract specific events based on defined criteria to improve efficiency during analysis.
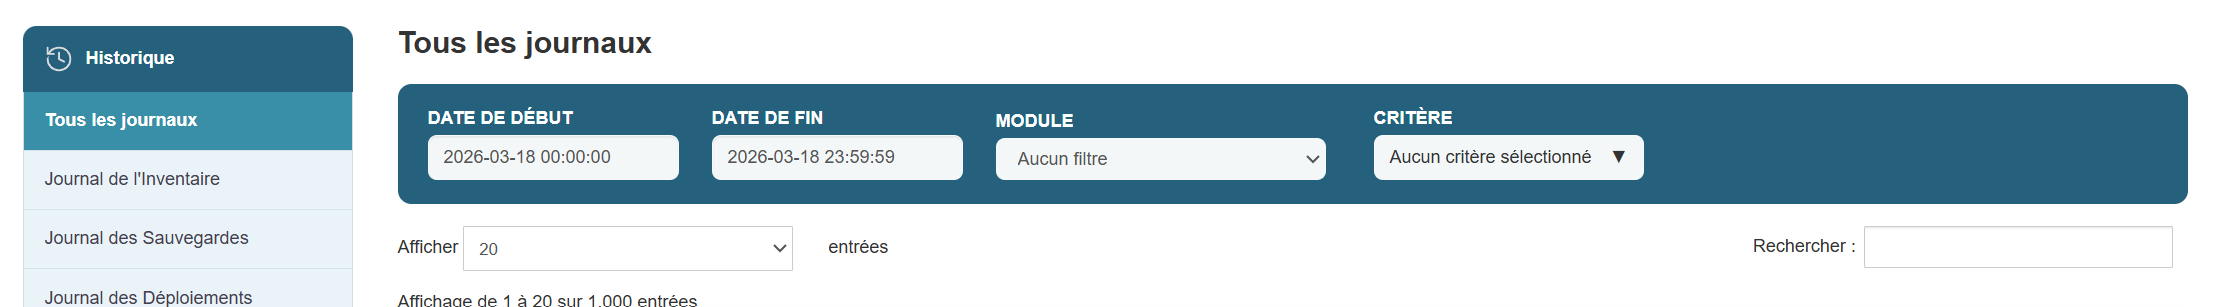
Steps:
-
Define a search period
-
In the Start Date and End Date fields, specify the desired time range.
-
Example:
-
Start Date:
2025-04-14 00:00:00 -
End Date:
2025-04-14 23:59:59
-
-
-
-
Select specific criteria (optional)
-
Open the Criteria dropdown menu to refine your search.
-
The available options are as follows:
-
inventory reception: events related to the receipt of machines -
inventory requested: requested inventory -
inventory deployment: recording during deployments -
inventory planned: planned operations -
inventory quick action: instant actions on equipment -
inventory user: user activities -
inventory machine: actions associated with a specific machine -
inventory master: actions performed by a master account -
inventory new machine: adding new machines -
No criteria selected: displays all events without filtering
-
-
-
Apply filters
-
Click the Filter logs button.
-
The table updates to display only the events that match your filters.
-
-
Search for a keyword
- In the Show field, you can choose the number of entries to display.
-
In theSearch field (top right of the table), enter a free-text string.
-
Example:
guacamole,error,registered
-
-
Adjust the display
-
In the Show X entries section, select how many rows should be visible per page.
-
Example:
20for smooth reading.
-
-
Example of a combined filter:
To display all new machines registered between April 13 and April 14, 2025:
-
Start Date:
2025-04-13 00:00:00 -
End Date:
2025-04-14 23:59:59 -
Criteria:
inventory new machine -
Click Filter logs
Understanding the logs
To interpret the information contained in each line of the log.
Each entry in the table contains the following columns:
-
Date: Date and time of the event
-
User: Account that generated the action
-
Who: Machine or service involved
-
Text: Description of the action performed
Example:
Tip: Group similar logs together to identify trends or sequences of operations (e.g., successive registrations, multiple deployments, etc.).
Export logs
To save logs for external analysis, archiving, or sharing.

Steps:
-
Apply your filters (by date, user, etc.) to isolate the desired logs.
-
Click the Export button (or Export logs, depending on the interface).
-
Choose the output format:
-
CSV: for processing in Excel or Google Sheets
-
PDF: for archiving or quick sharing
-
-
The file is generated and downloaded automatically.
-
Save it or transfer it as needed (report, audit, support, etc.).
The system history is a key tool for:
-
Ensuring the traceability of actions
-
Quickly identifying anomalies
-
Understand the behavior of machines or users
-
Facilitate diagnostics and interventions
-
Ensuring system compliance and transparency
Regular and thorough use of logs helps to sustainably enhance the security and reliability of your infrastructure.
Chapter 13: Admin
List of XMPP relays
XMPP relays are communication points between the various machines on your network.
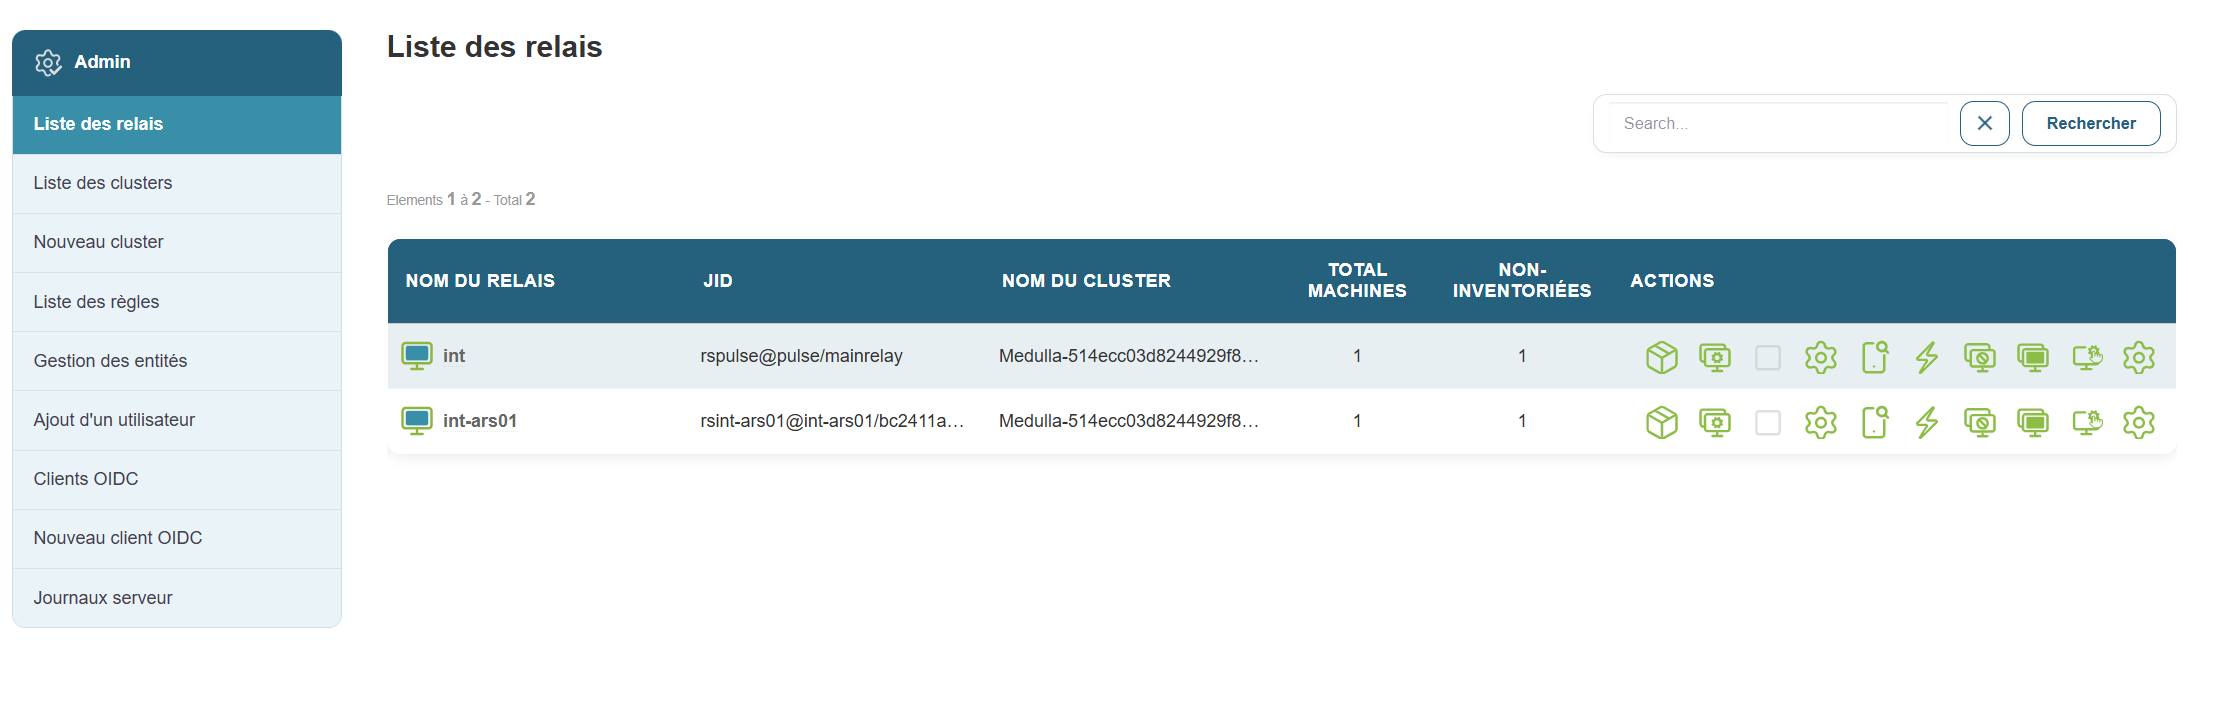
Why this is useful:
This allows you to see all active connections and understand how machines communicate with each other.
Steps:
Tip:
You can search for a relay by typing a keyword into the search bar at the top of the list.
Cluster List
Acluster is a group of relays that are grouped together to organize the network in a more logical way.
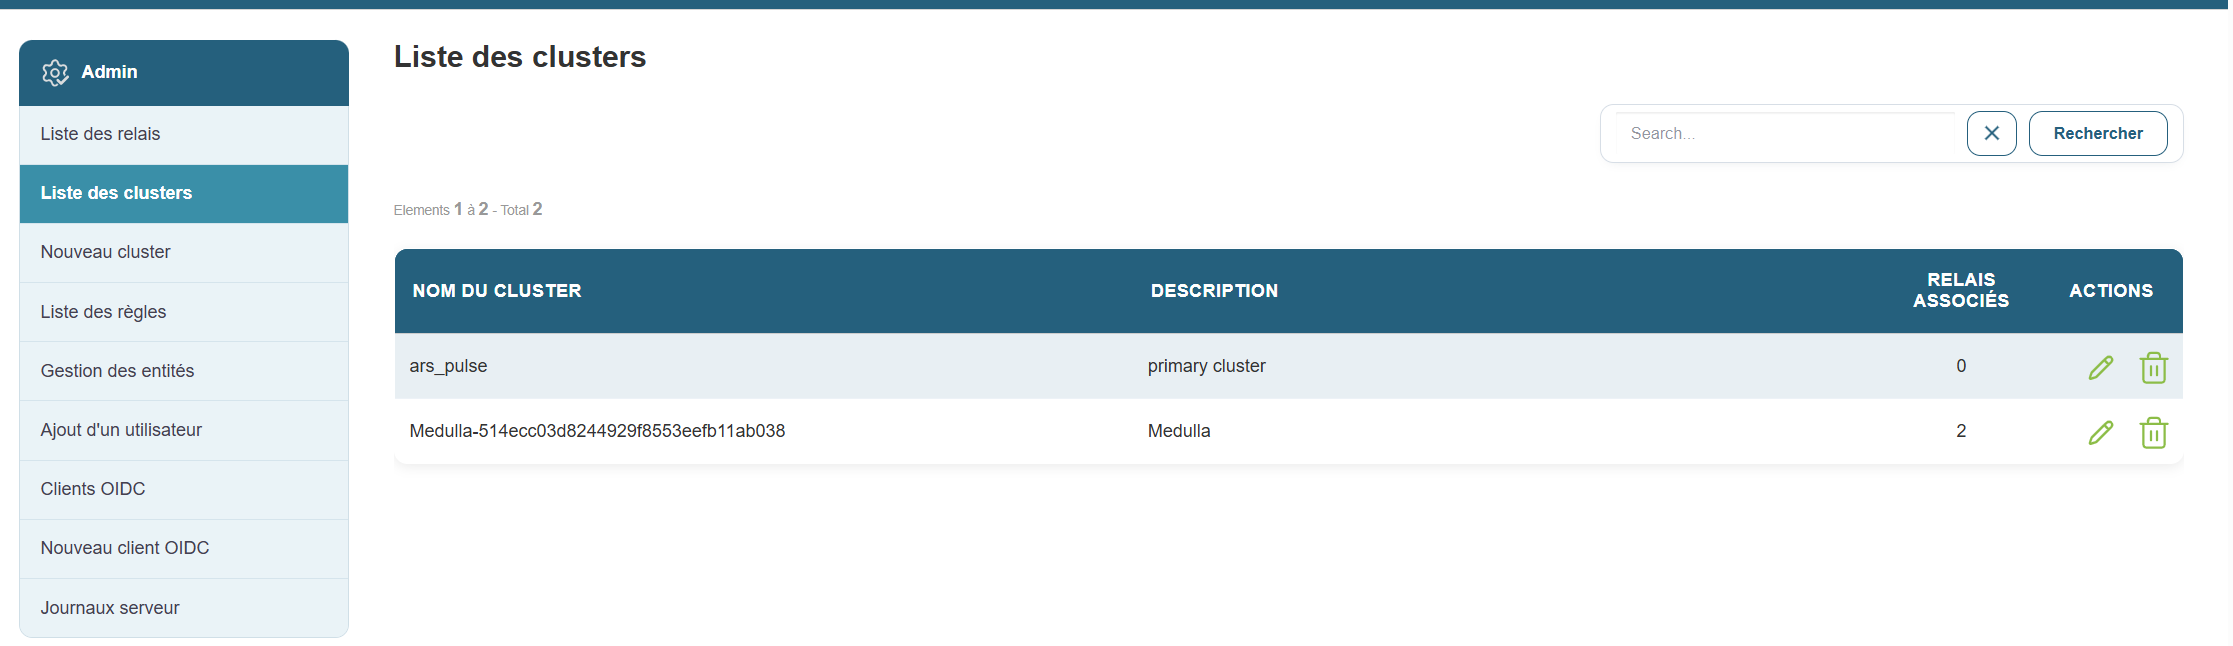
Why this is useful:
It helps you better manage your network, especially if you have different environments (e.g., test, production, etc.).
Steps:
-
Go to the “Clusters List” section .
-
You will see a list with:
-
The cluster name
-
Its description
-
The type (private or public)
-
The relays associated with it
-
Example:
A cluster named “Public-...” can contain all shared public relays.
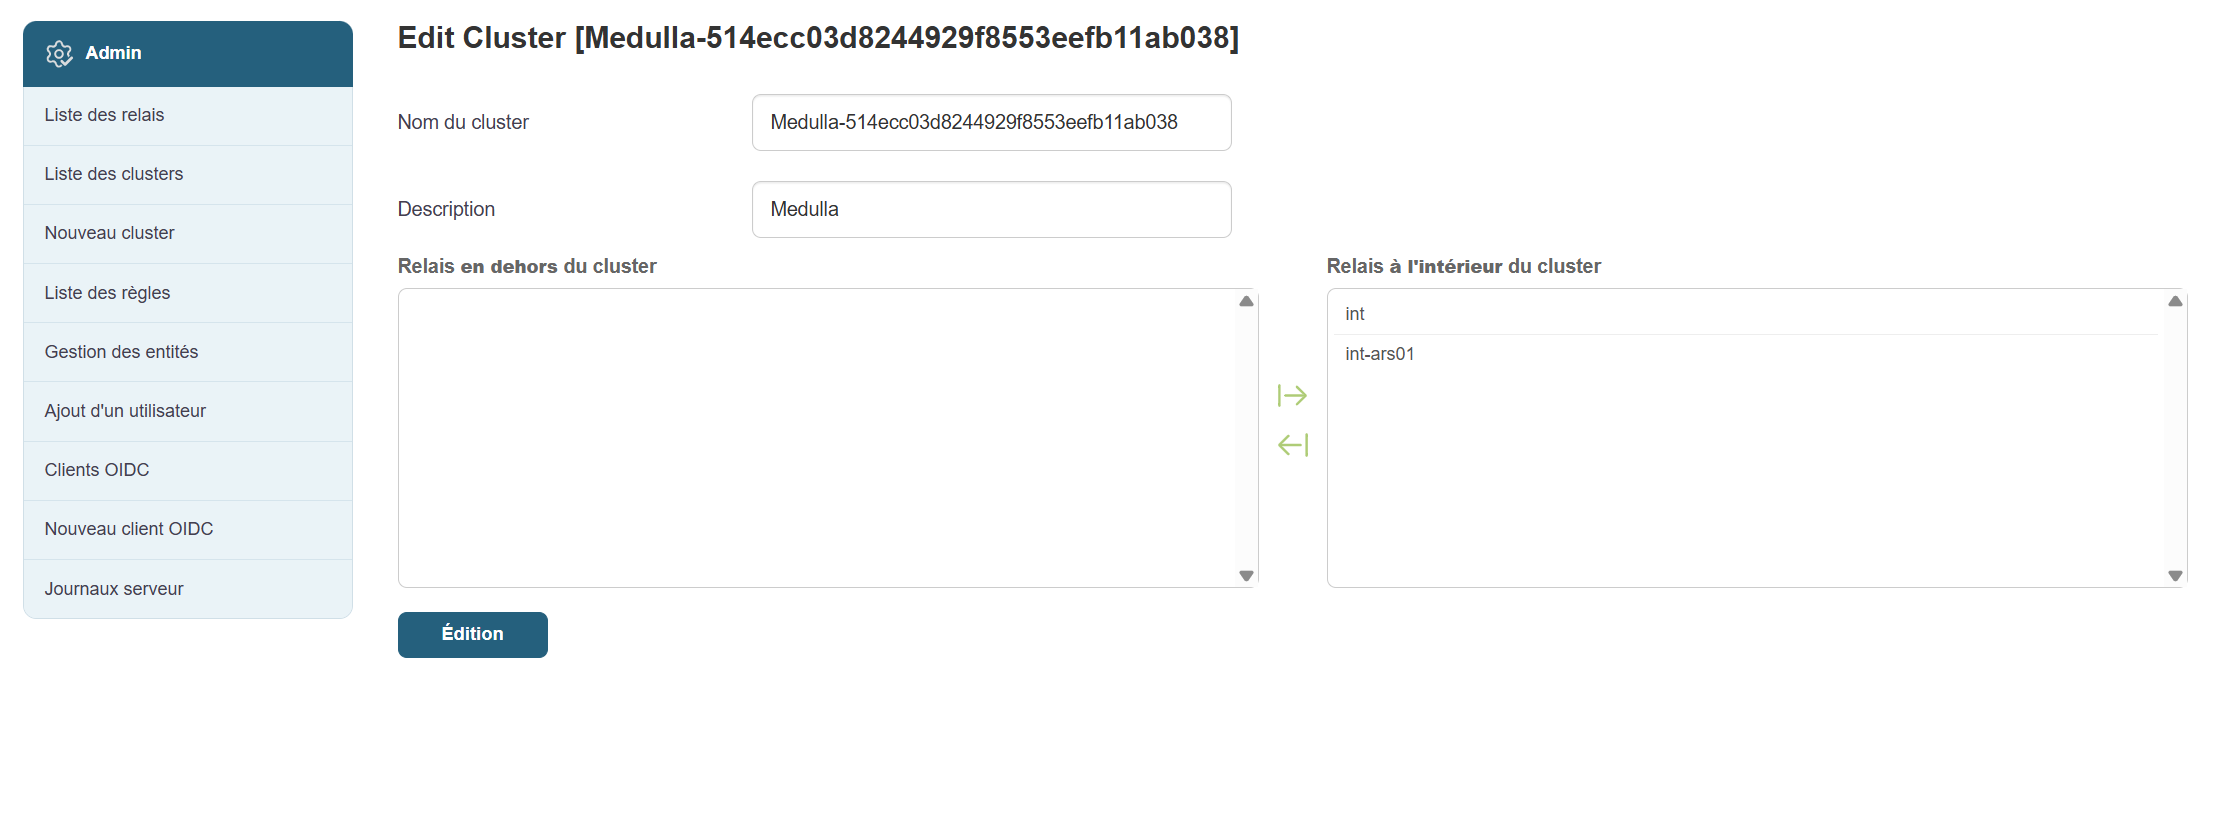
By clicking the pencil icon in Actions, you can edit the cluster by following these steps:
- Choose a cluster name
- Choose a description
- Select the relays outside the cluster to add to the cluster and vice versa
- Confirm
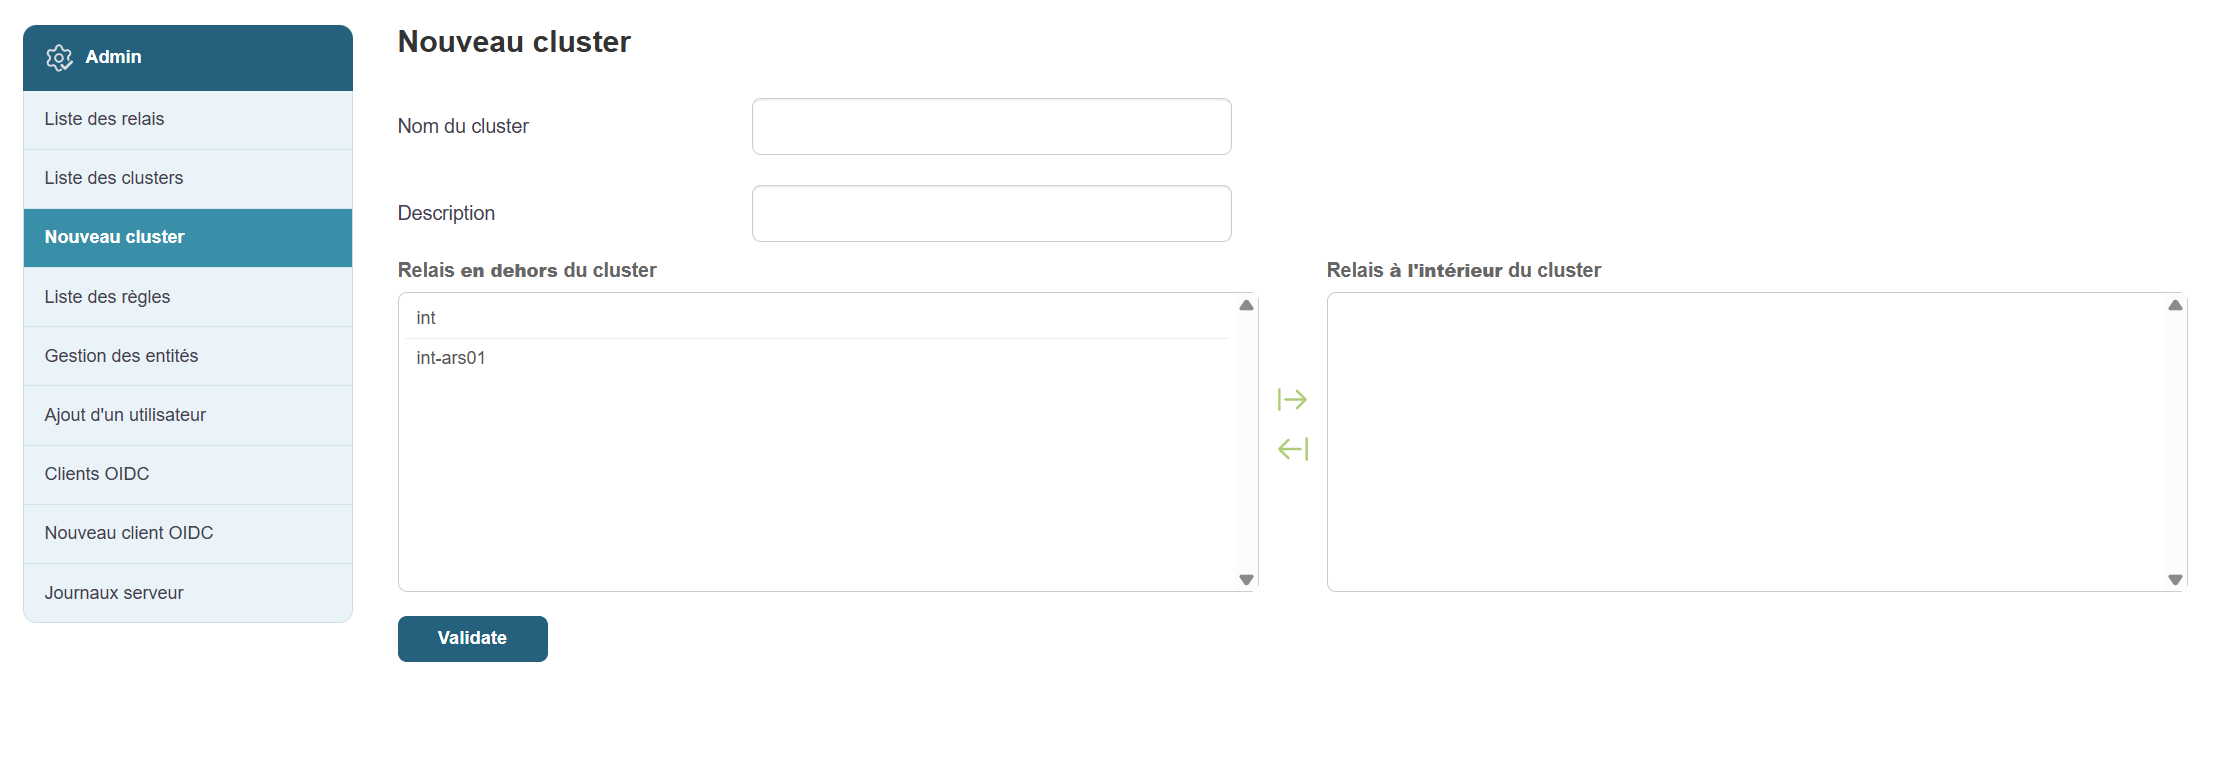
Create a cluster
Creating acluster allows you to better organize your relays according to your needs (for example, separating testing from production). This is exactly the same form as the edit form.
Steps:
-
Click “New Cluster” in the menu.
-
Click the “Add a new cluster” button .
-
Fill in the fields:
-
Clustername (e.g., "TestCluster")
-
Description (e.g., "Cluster for test relays")
-
-
Select the relays you want to associate with it (a list will appear).
-
Click “Confirm” to save.
Manage rules
Rules allow you to automate certain network actions or behaviors.
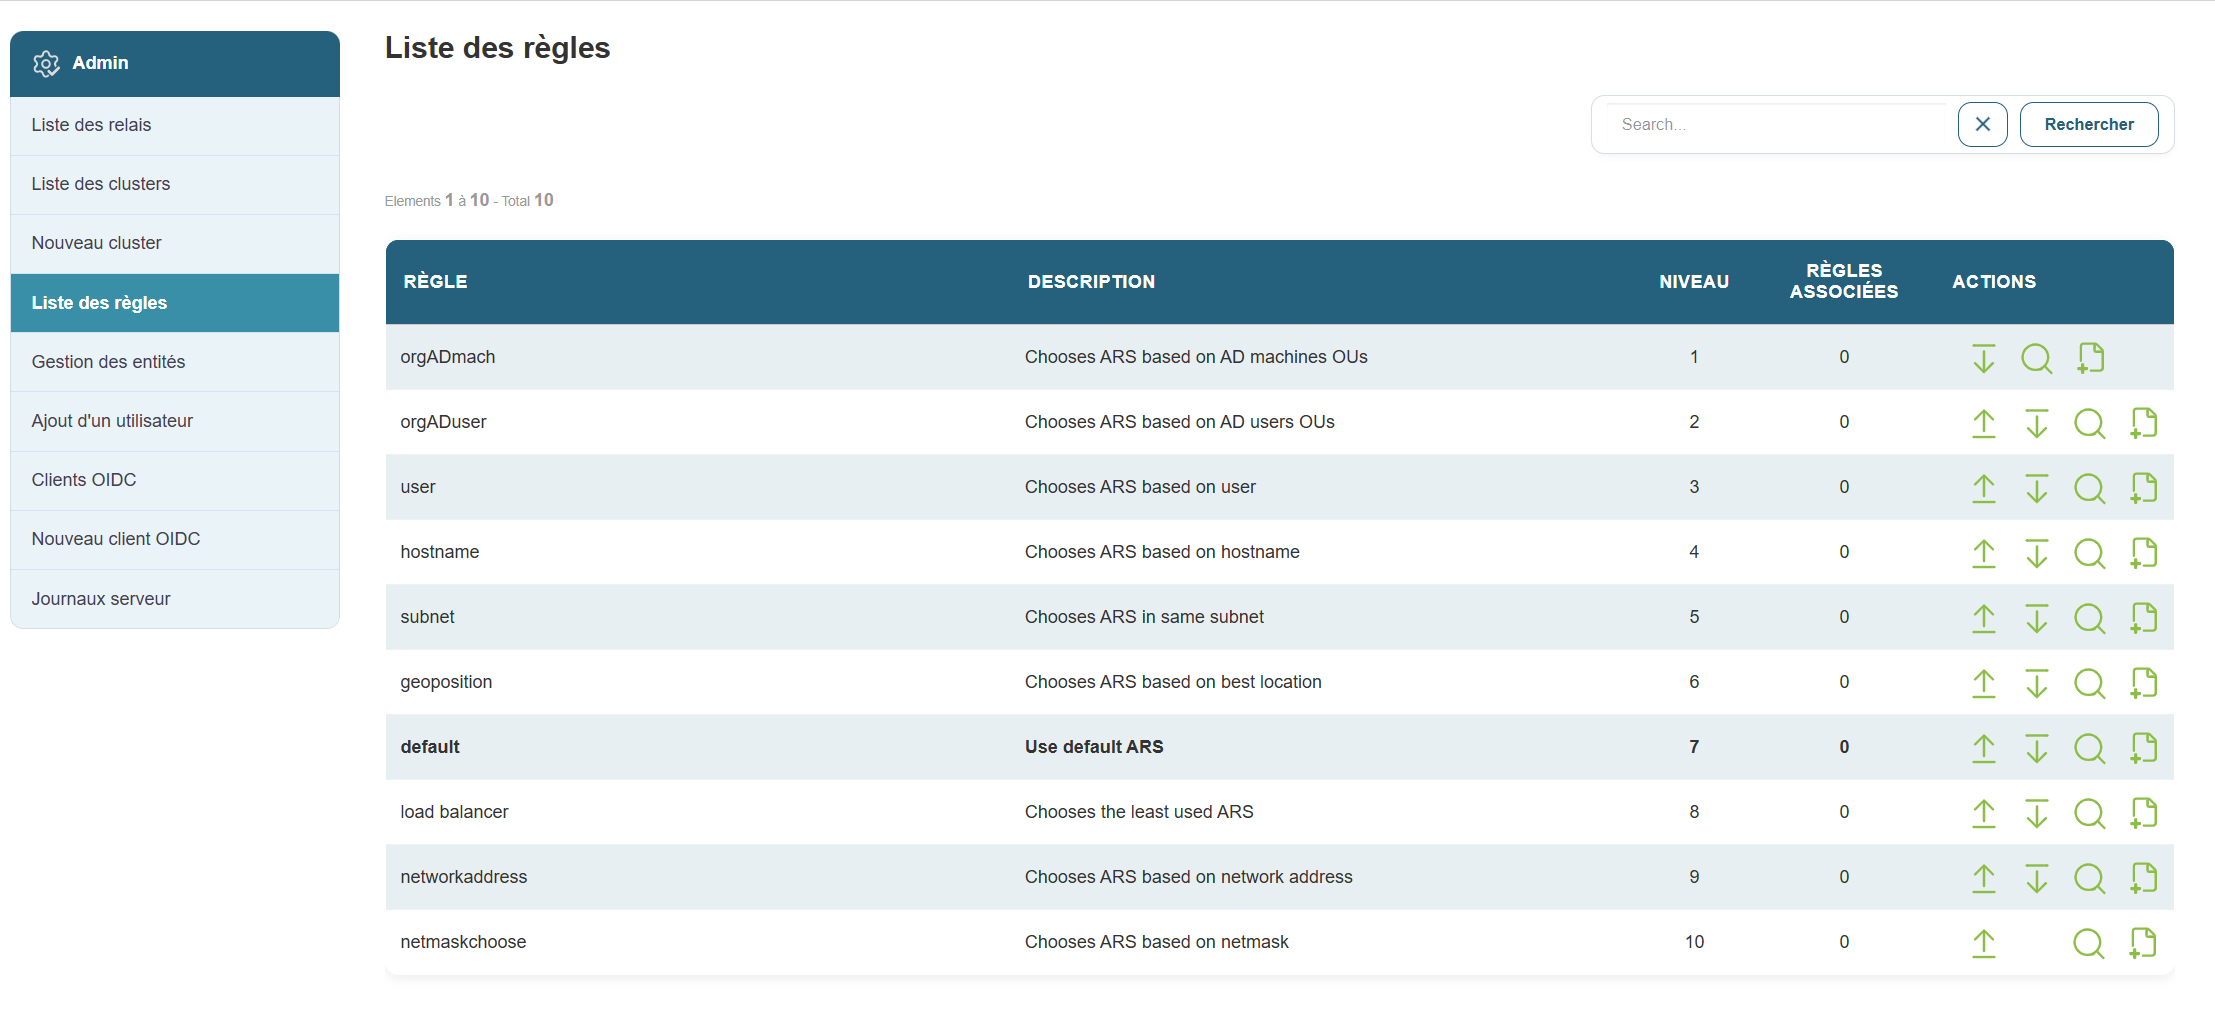
Why this is useful:
For example, this can trigger an automatic check or apply specific settings based on defined conditions.
Steps:
-
Click “Rules” in the menu.
-
On the page, you can:
-
Change the priority order of existing rules by clicking the down arrow to lower it or the up arrow to raise it.


-
Add a new rule as needed

- View the details of a rule

-
When you click the plus icon to add a new rule, the following form appears:
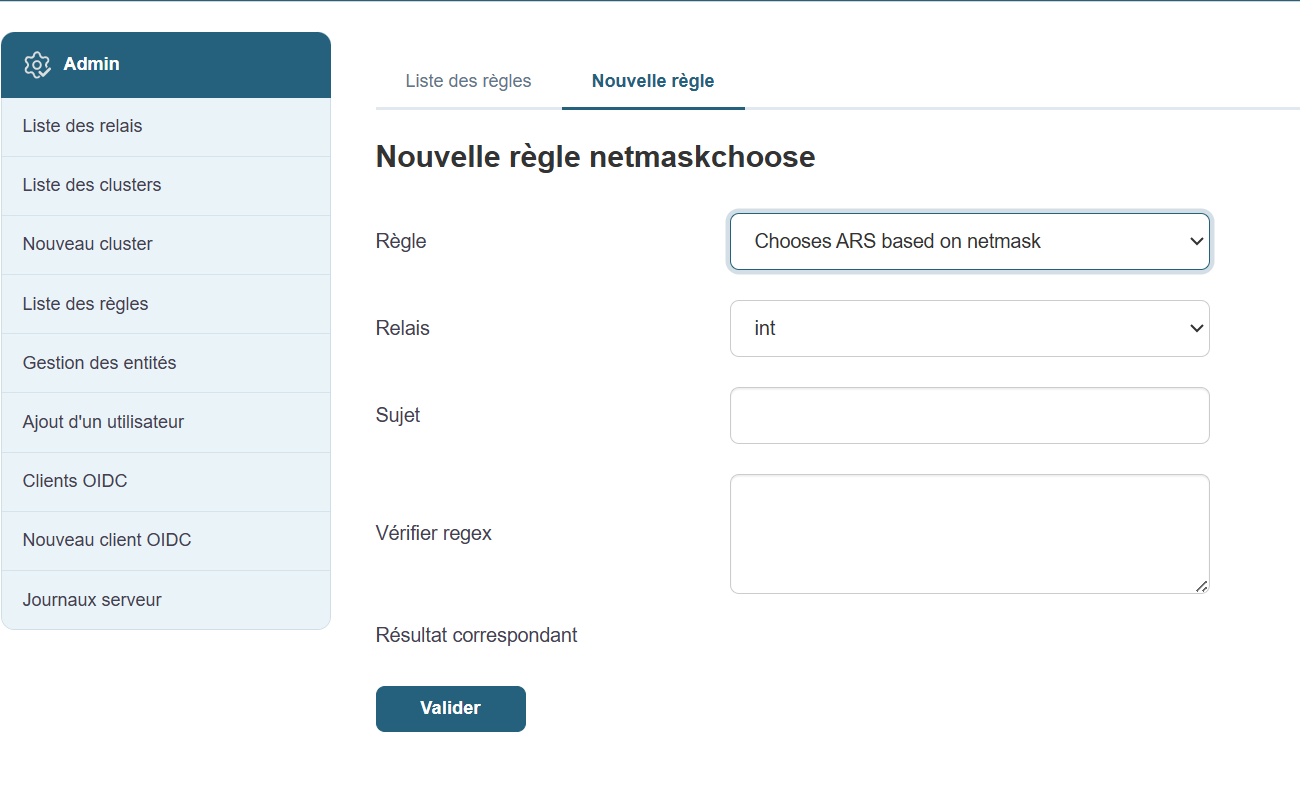
Fill in the fields one by one:
- Select the rule
- Select your relay
- Describe the subject
- Enter the regex to check
- Validate
Even if you’re not technically inclined, you can ask an administrator which rules are recommended for your environment.
Quick Actions

Each XMPP relay has a setof quick actions that allow you to interact directly with the machines it manages. These actions are accessible from the list of relays and are designed to simplify common administration, diagnostic, or configuration tasks without requiring advanced technical knowledge.
Here is a detailed overview of each action, its purpose, and the procedure for using it.
1. View the list of installed packages
Purpose
View the software installed on the machines attached to a relay.
Procedure

-
Click the "List of packages" button to the right of the relevant relay.
-
A window opens displaying the installed software, along with their names and versions.
When to use
-
To verify the presence of a program.
-
To check the software versions deployed.
2. Reconfigure the machines connected to the relay
Objective
Automatically reapply the active configuration to machines connected to the relay.
Procedure

-
Click "Reconfigure".
-
Confirm the action if prompted.
-
The machines will receive the current configuration again.
When to use
-
After modifying settings, rules, or configuration files.
-
If a machine appears to be out of sync or non-compliant.
3. Change the relay on one or more machines (Switch function)
Objective
Move one or more machines from one relay to another.
Procedure

-
Click "Switch" to the right of the original relay.
-
Select the machines to move.
-
Select the destination relay.
-
Confirm to apply the change.
When to use it
-
When performing maintenance or removing a relay.
-
When reorganizing the network architecture.
4. Modify the configuration files
Objective
Manually modify the configuration files of a relay or its machines.
Procedure

-
Click "Edit configuration files" (first gear icon)
-
An editing interface opens.
-
Make the necessary changes.
-
Save the changes.
When to use it
-
To adjust a specific configuration for a one-time need.
-
During a test or manual intervention.
Note: This operation directly affects the system. Use with caution.
5. View current or past quality assurance (QA) checks
Objective
View compliance, security, or quality tests performed on the machines.
Procedure

-
Click "QA Launched".
-
A window displays the list of tests run and their status (passed or failed).
When to use
-
To verify that the rules are being properly applied.
-
To identify potential malfunctions.
6. Access system actions (advanced diagnostics)
Objective
To use diagnostic or remote intervention tools on a machine.
Procedure

-
Click "Actions" next to the relay.
-
Select one of the available options:
-
Reboot: Restart the machine.
-
Process: View running processes.
-
Disk usage: View the disk space used.
-
Agent version: View the version of the installed software agent.
-
Netstat: displays active network connections.
-
Console: opens a command-line interface.
-
When to use it
-
When a machine is down, running slowly, or unstable.
-
For quick diagnostics or manual verification.
7. Banning a machine
Objective
Temporarily block a machine’s access to the system.
Procedure

-
Click "Ban" next to the relay.
-
Confirm the ban.
-
The machine is isolated from the rest of the network.
When to use
-
In case of abnormal behavior, suspected compromise, or a critical error.
8. Unbanning a machine
Objective
To lift the block applied to a previously banned machine.
Procedure

-
Click "Unban".
-
The machine regains its normal communication privileges.
When to use
-
After the initial problem has been resolved.
-
If the machine was blocked incorrectly.
9. Remote Access
Objective
To control a machine remotely as if you were physically in front of it.
Procedure

-
Click "Remote Control".
-
A remote session opens, allowing you to interact with the machine’s graphical interface.
When to use it
-
To perform manual operations.
-
To diagnose a specific problem.
-
When no other automated action is sufficient.
10. Manage relay rules
Objective
View, modify, or add operating rules specific to a relay.
Procedure

-
Click on "Relay Rules" (last gear icon)
-
From the interface:
-
View existing rules.
-
Edit or delete obsolete rules.
-
Add new rules as needed.
-
When to use it
-
To automate repetitive actions.
-
To dynamically adapt the relay's behavior to a specific use case.
Chapter 14: MDM
Chapter 15: CVE
CVE Module (Concept and Principles)
Medulla has introduced a new feature that allows the inventory database to be compared with CVE search APIs based on three CVE database models: NVD (U.S.), CIRCL (Luxembourg), and EUVD (European Union).
This real-time comparison of the inventory database with these three databases enables the detection of all CVE-related anomalies and provides system administrators and security teams with visibility into vulnerabilities on workstations linked to applications that are out of date or need to be updated across the network.
This module allows you to perform the following actions:
- View and launch a vulnerability scan across the entire fleet of machines managed in the Medulla interface
- View and launch a vulnerability scan by entity.
- View and launch a vulnerability scan by group.
- View the results of all CVEs across the fleet.
For each CVE reported in the module, we organize a ranking based on the severity priority of the vulnerability:
- Low priority
- Medium priority
- High priority
- Critical priority
A banner at the top of the module page provides a summary and an overview of the status of security vulnerabilities across the fleet.
This banner displays:
- The total number of CVEs across the fleet.
- The number of critical CVEs
- The number of high-severity CVEs
- The number of medium-severity CVEs
- The number of low-severity CVEs
- The number of affected machines.
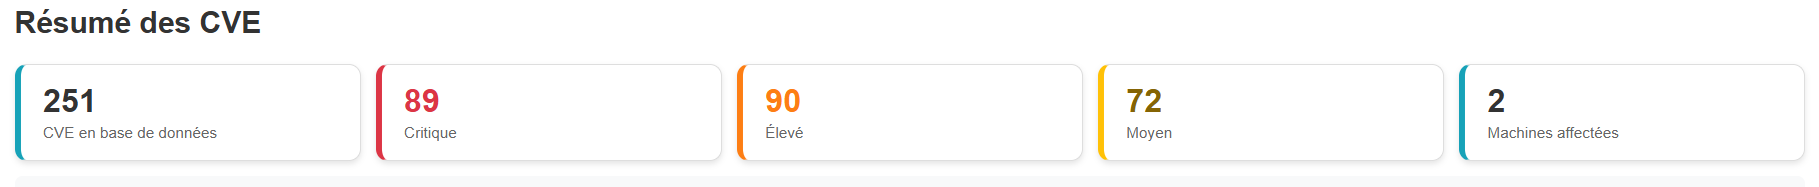
To access this module, click the security button:

CVE operation
When you access the CVE module, it provides an overview of the CVEs across the infrastructure, their severity, and the number of affected machines.
By clicking on the CVE summary banner, you can create groups based on severity. You can also click the trash can button to exclude CVEs, machines, or groups from the CVE lists.
You can view the details of each CVE by using the CVE search APIs to retrieve information about the vulnerability and its impact.
You can sort this by entity, search for a specific CVE, or run a scan.
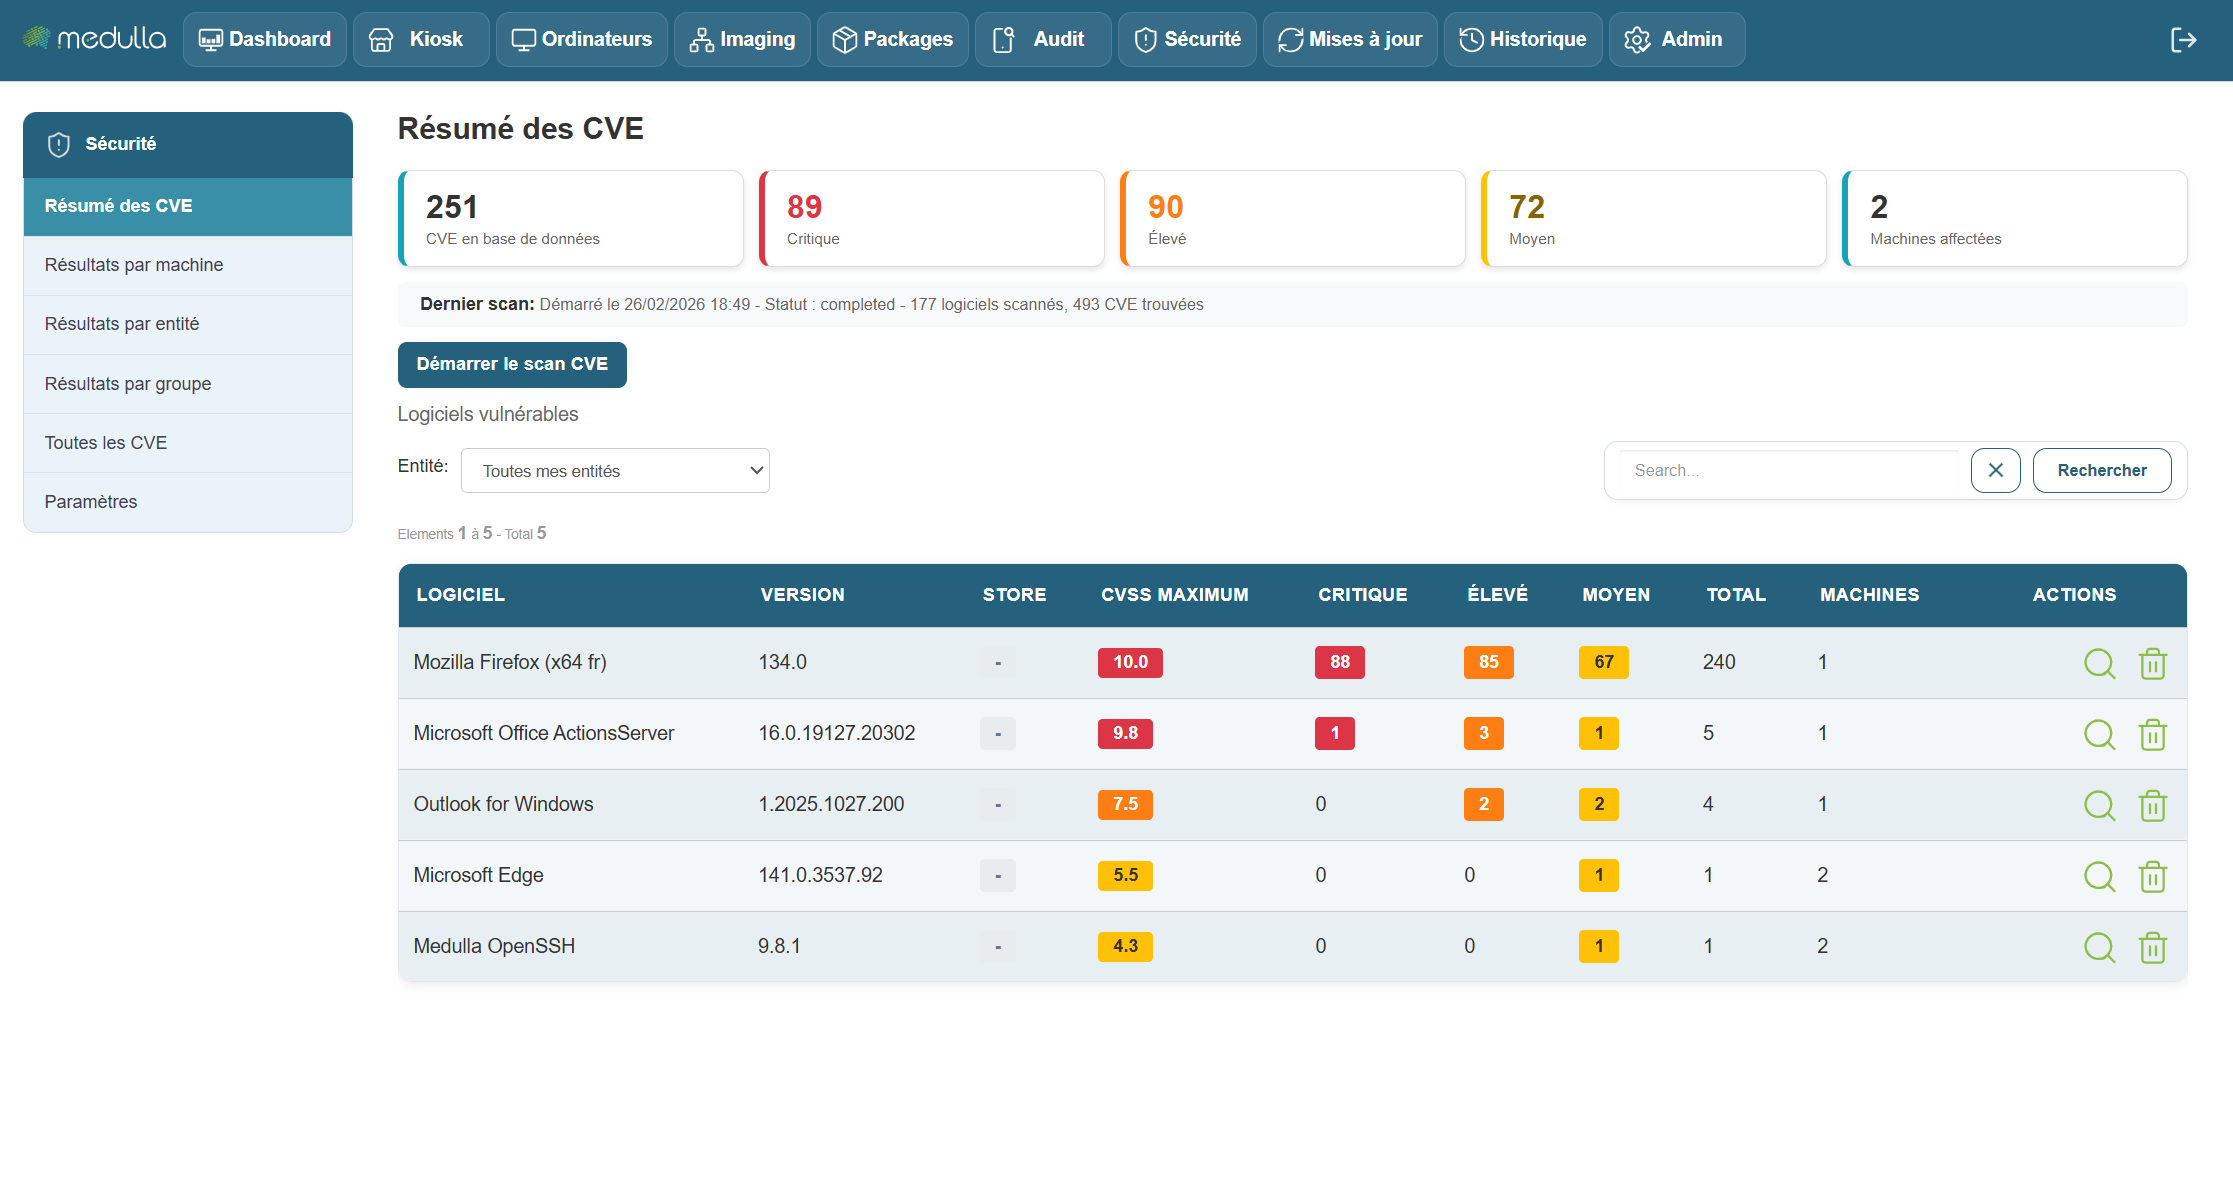
- An overview, which is the module’s home page.
- A results view by machine
- A results view by entity
- A results view by group
- A view of all CVEs.
- A settings menu.
Results view by machine
Result view by machine:
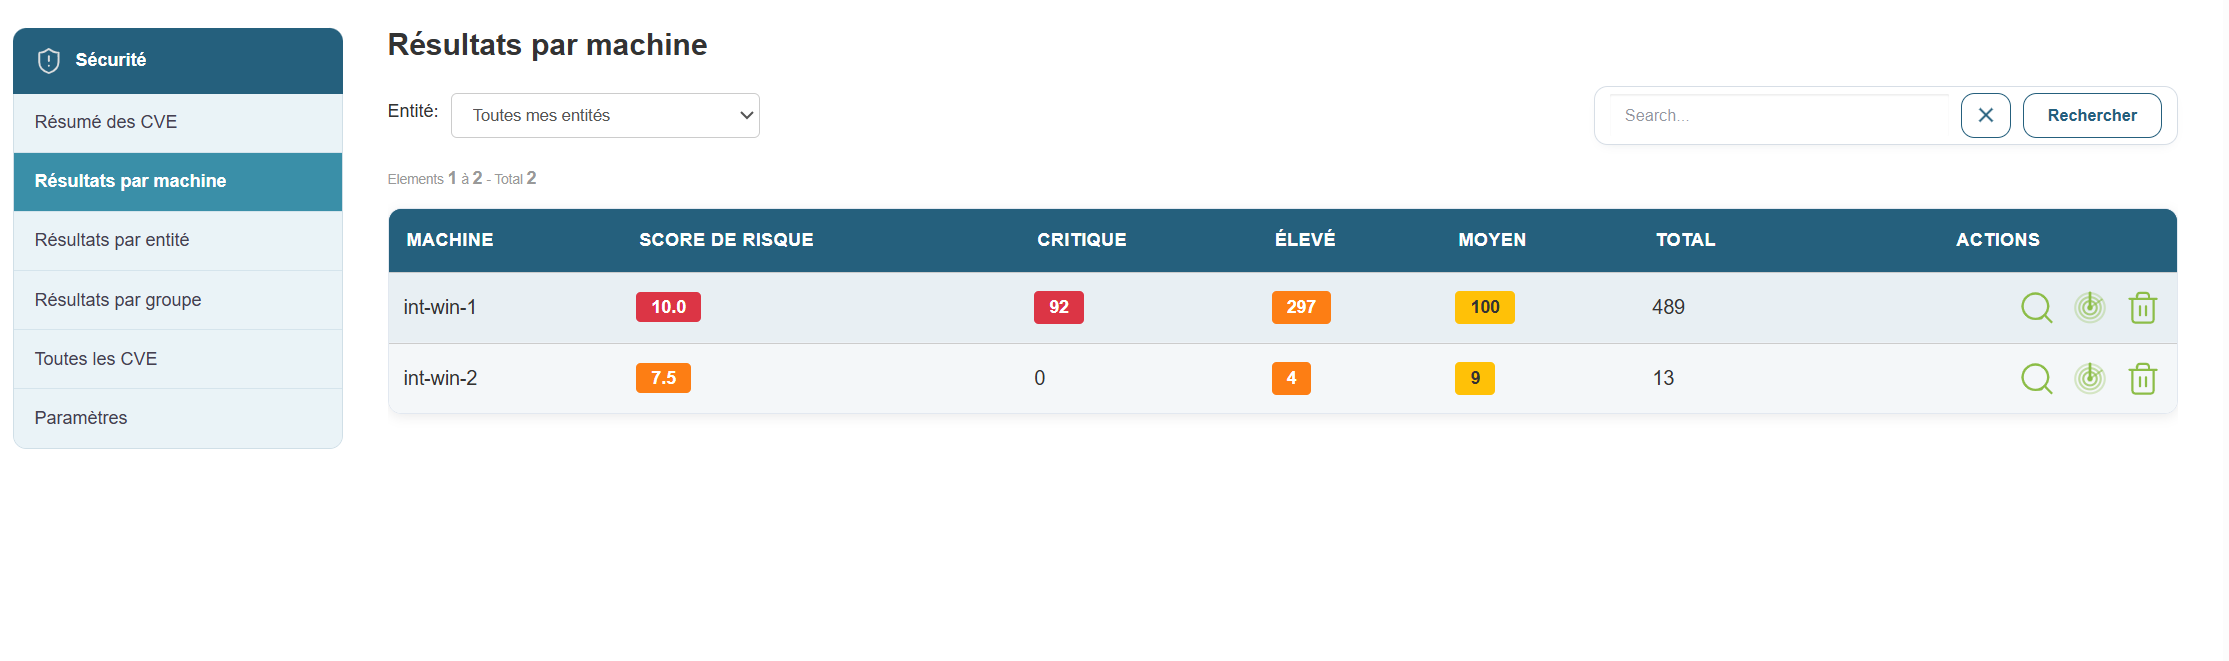
In this view, you will see all machines affected by CVEs:
- Machine name
- CVSS Score
- Number of critical CVEs
- Number of high-severity CVEs
- Number of medium CVEs
- Number of low-severity CVEs
- Total CVEs per machine
- The three actions for viewing details and launching a scan on an entity.
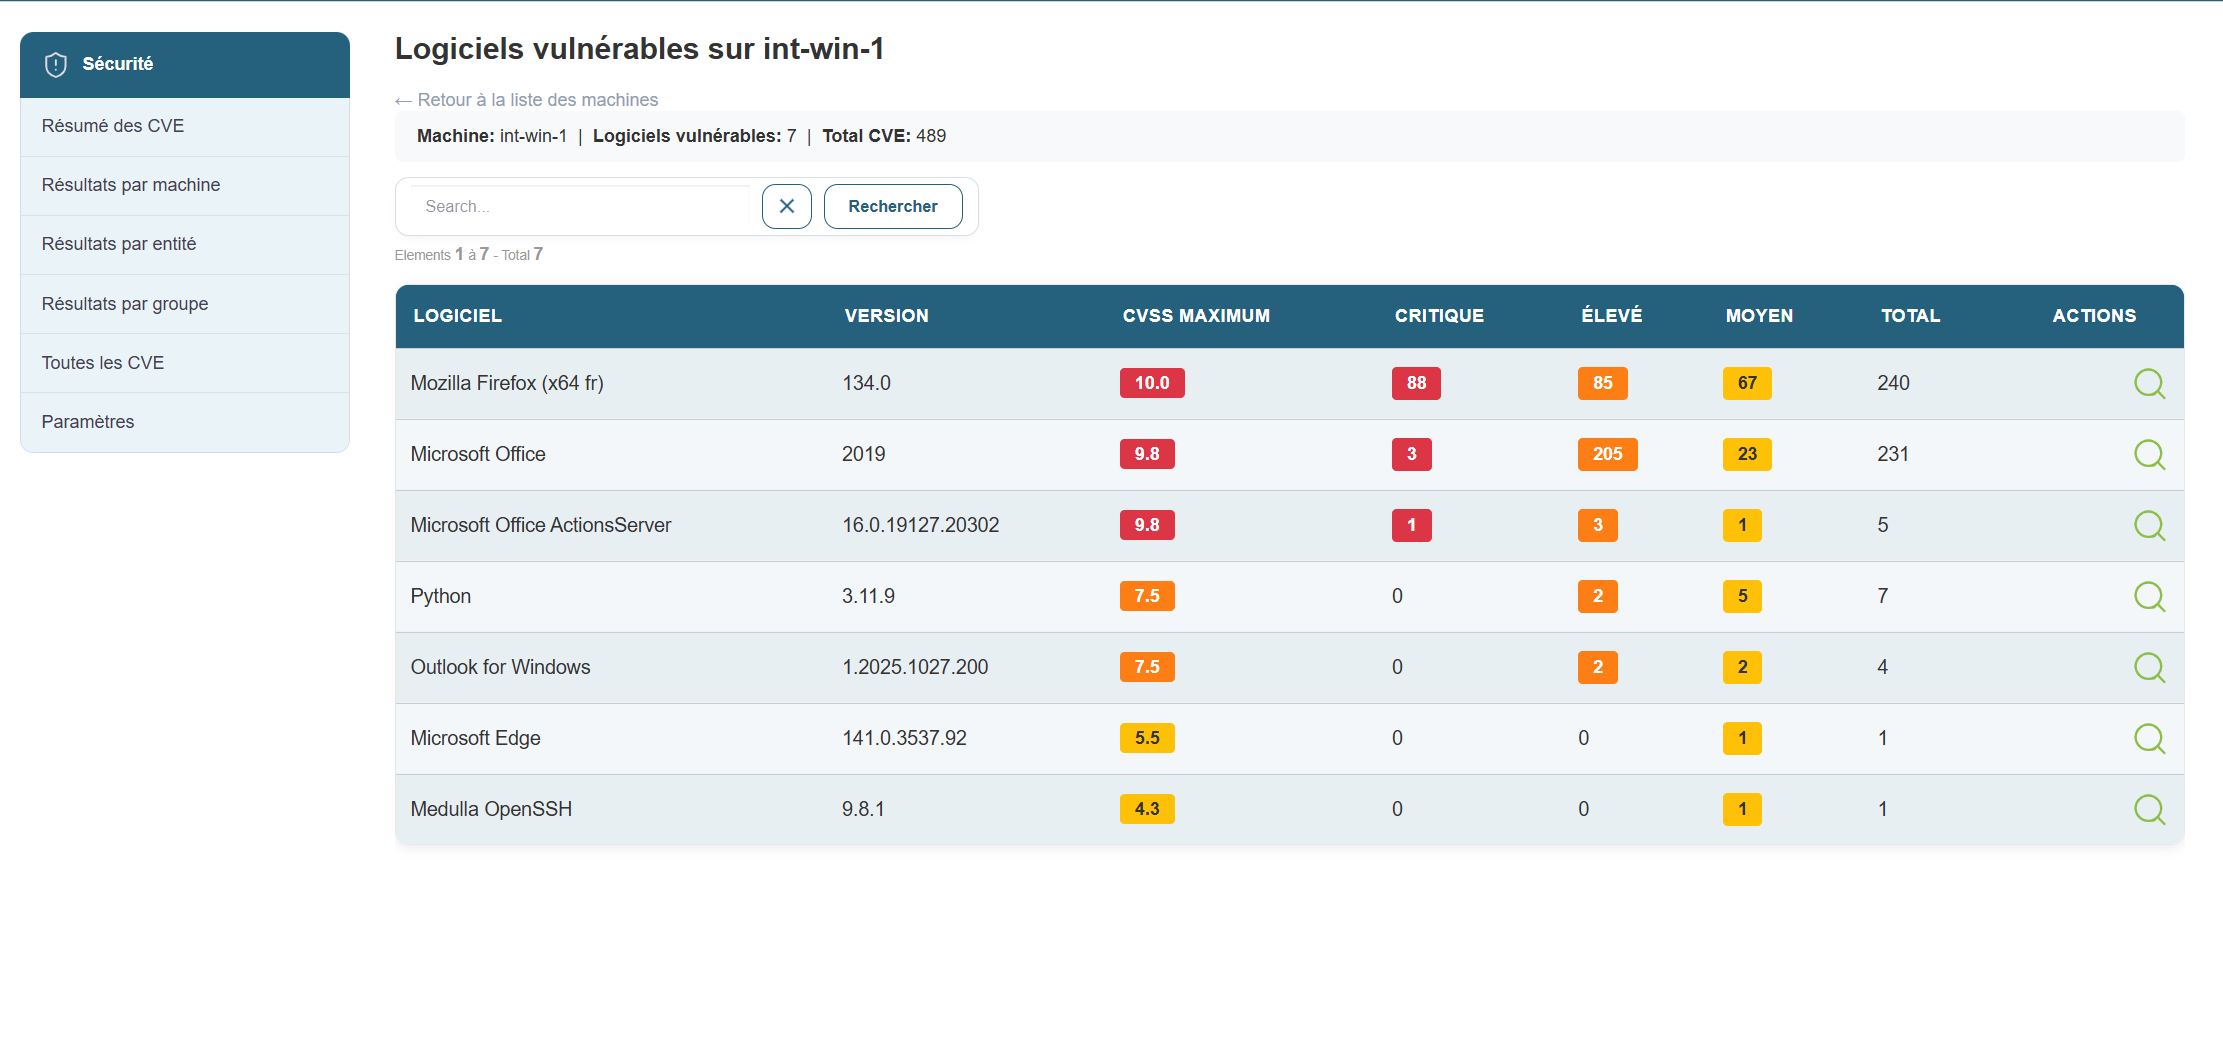
By clicking the button to view details, you’ll see the CVEs listed by application. You can drill down further by selecting a specific CVE—for example, Flatpak—if you want to see more information about that vulnerability. Just click the button in the actions menu.
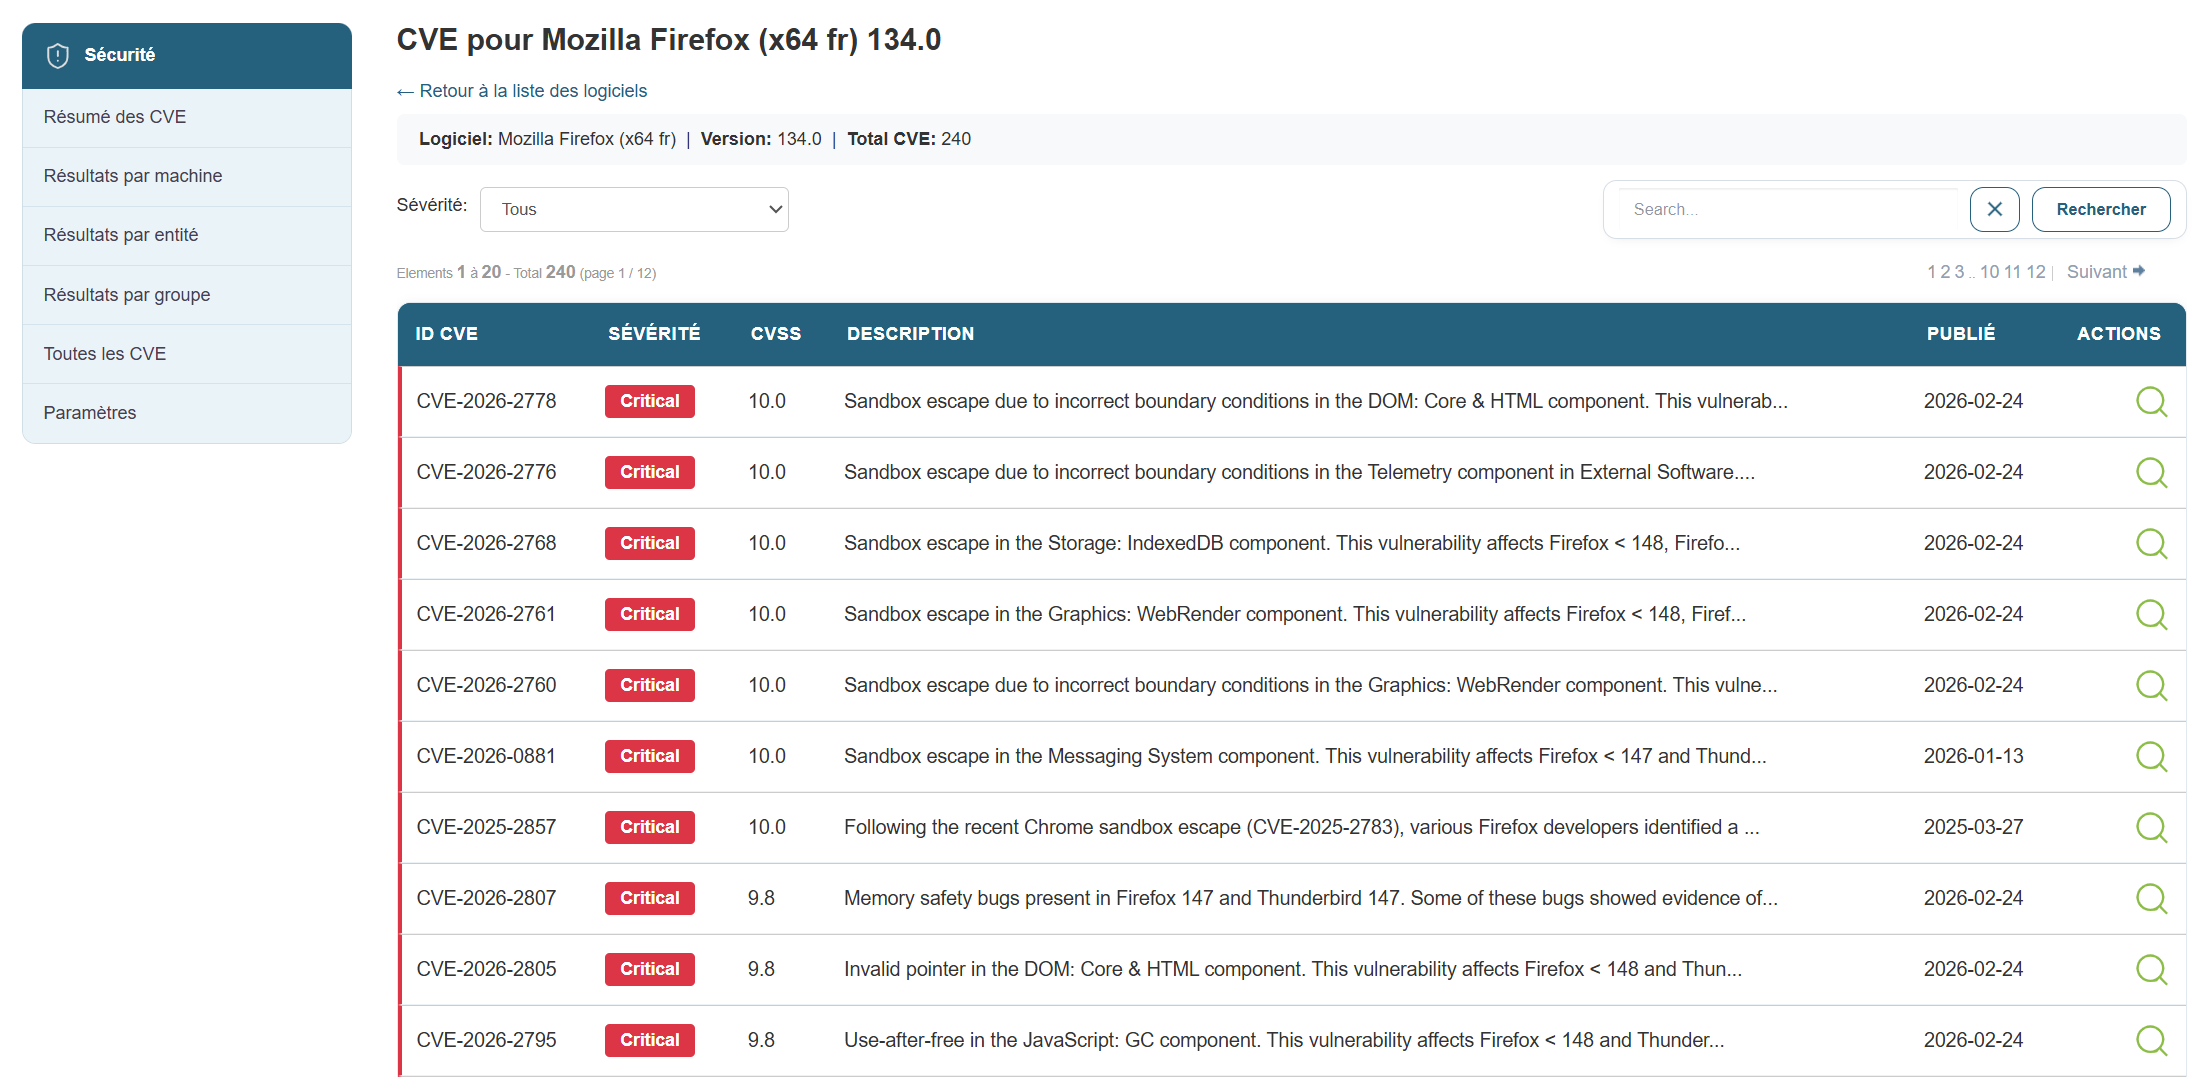
In this view, you’ll find the following information:
- The CVE ID
- The severity
- The CVSS score
- The CVE description
- Publication date
Clicking the action button for CVE-2024-42472 will give me a complete view of the CVE taken directly from the CVE database
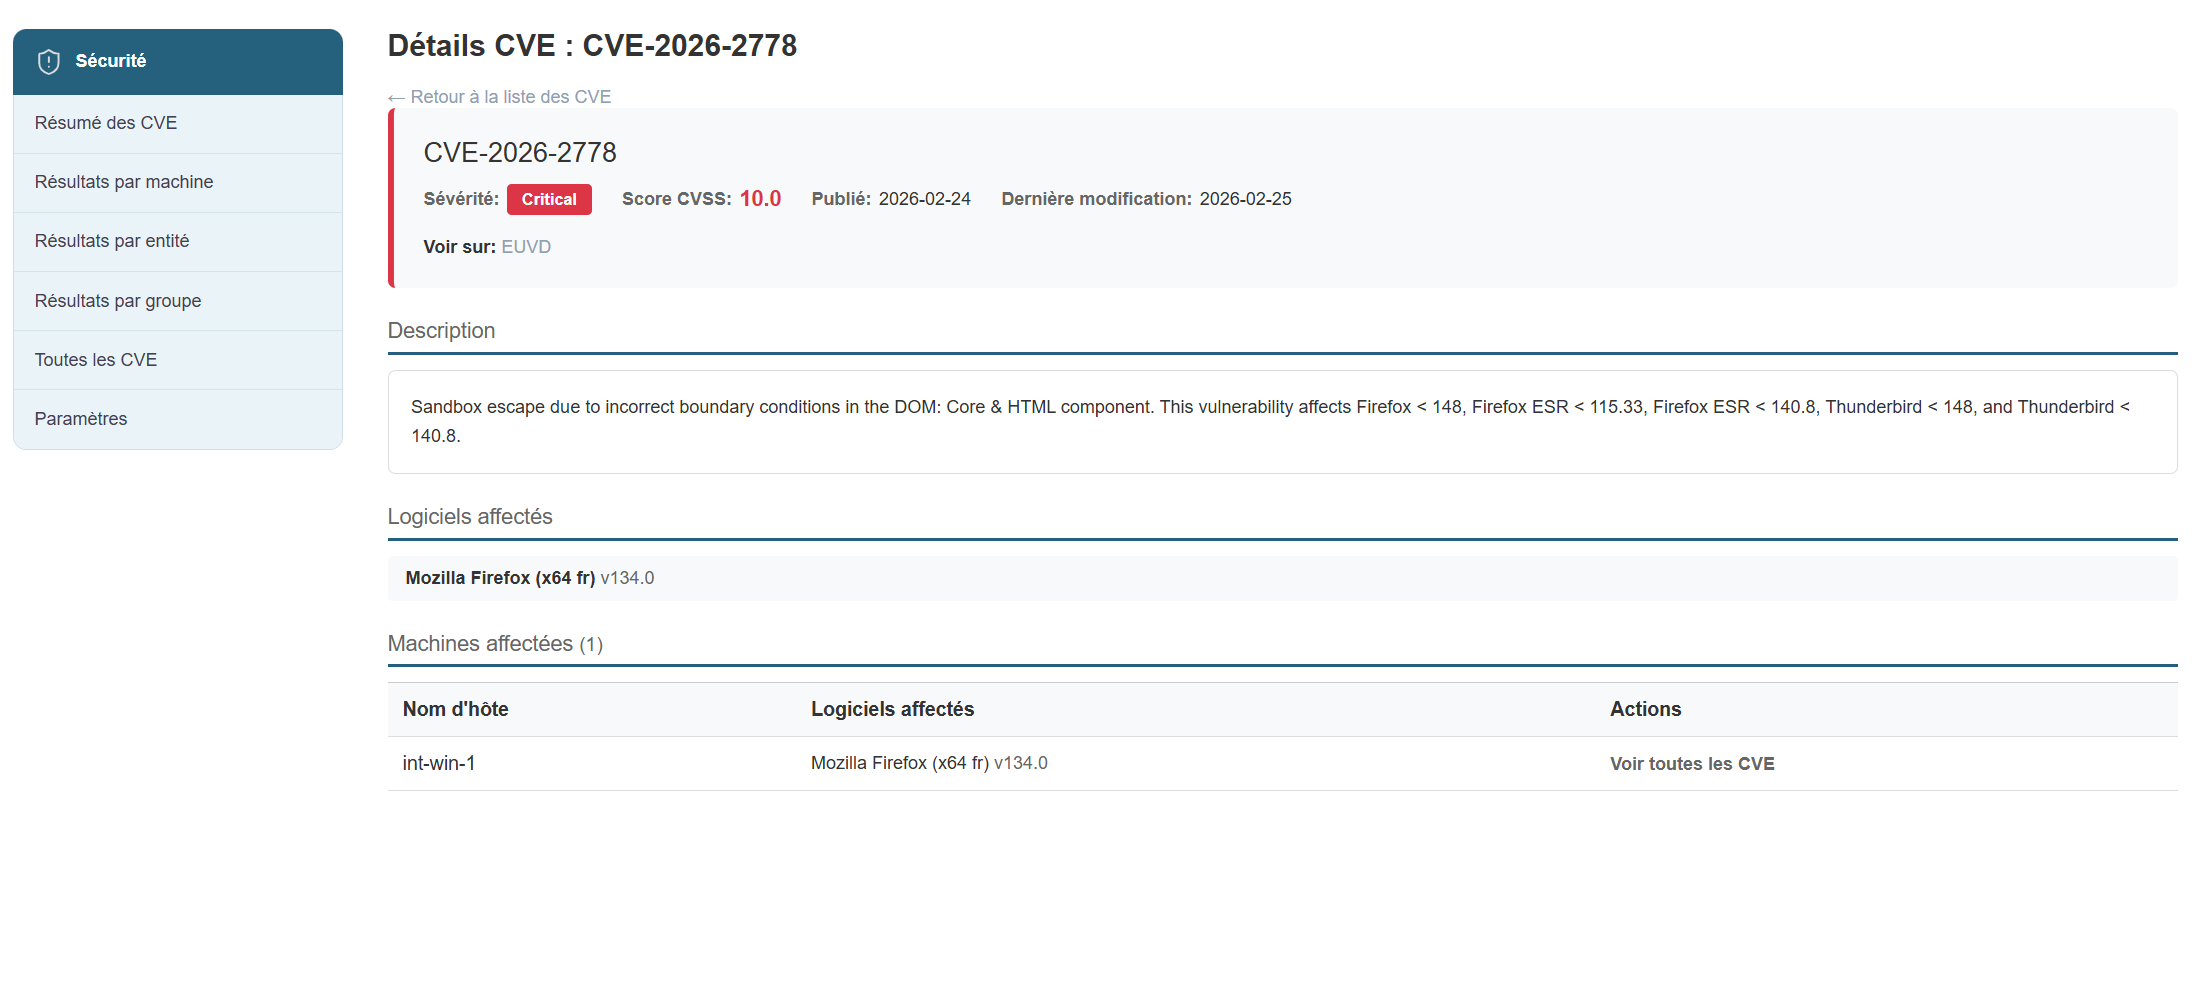
Results view by entity
Results view by entity:
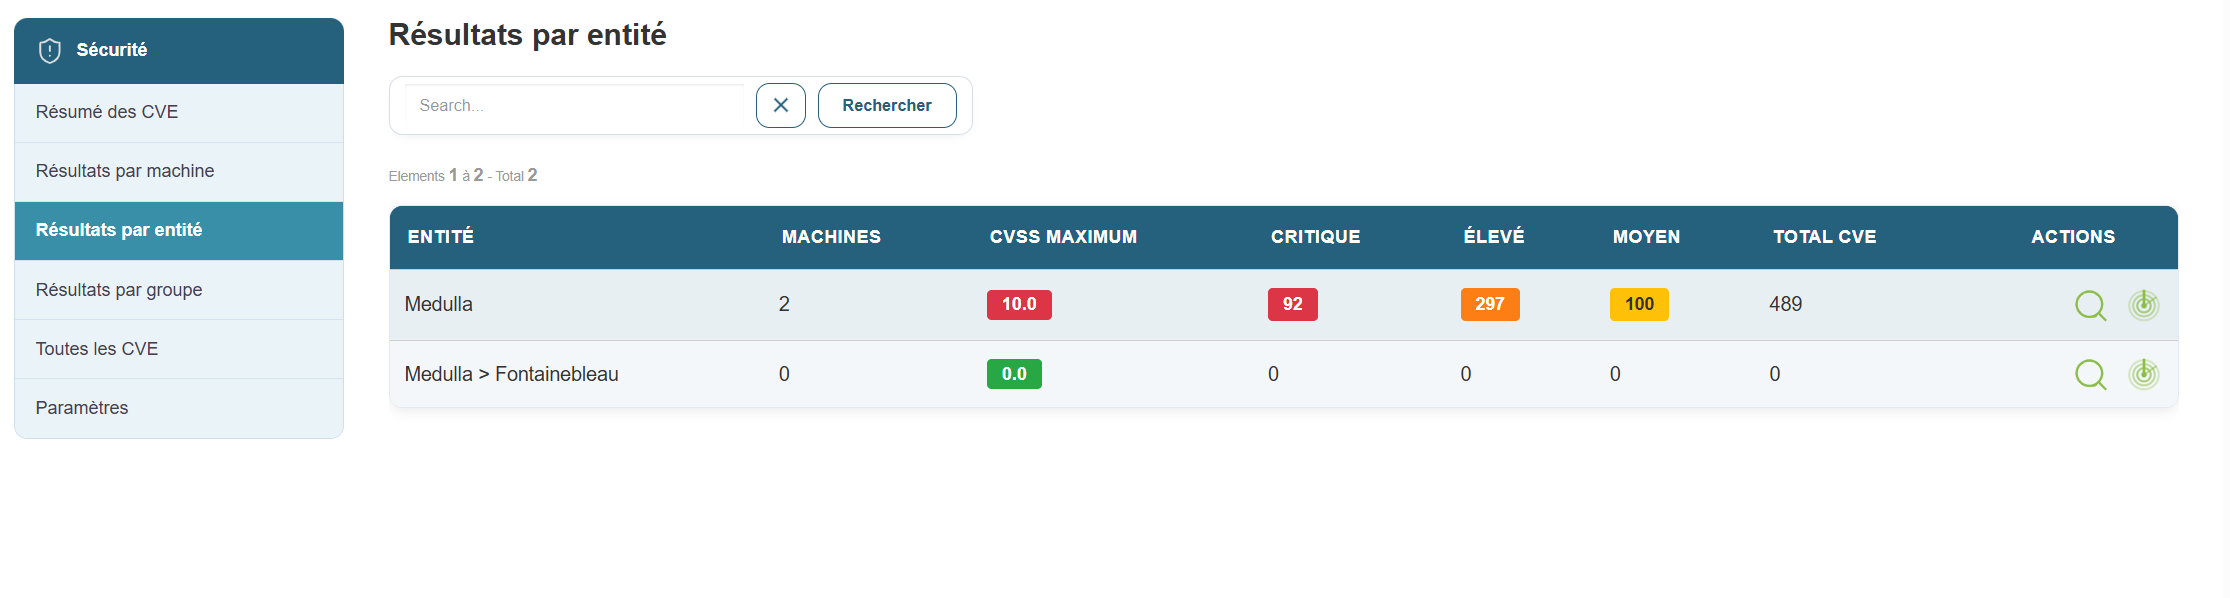
This view displays only the entity-based view and includes the following information:
- Entity name
- Number of machines in the entity
- CVSS score
- Number of critical CVEs
- Number of high-severity CVEs
- Number of medium CVEs
- Number of low-severity CVEs
- Total CVEs per entity
- The two actions: detailed view and scan initiation for an entity.
By clicking the "Details by Entity" button: You will see the details view by machine, showing only the machines in that entity.
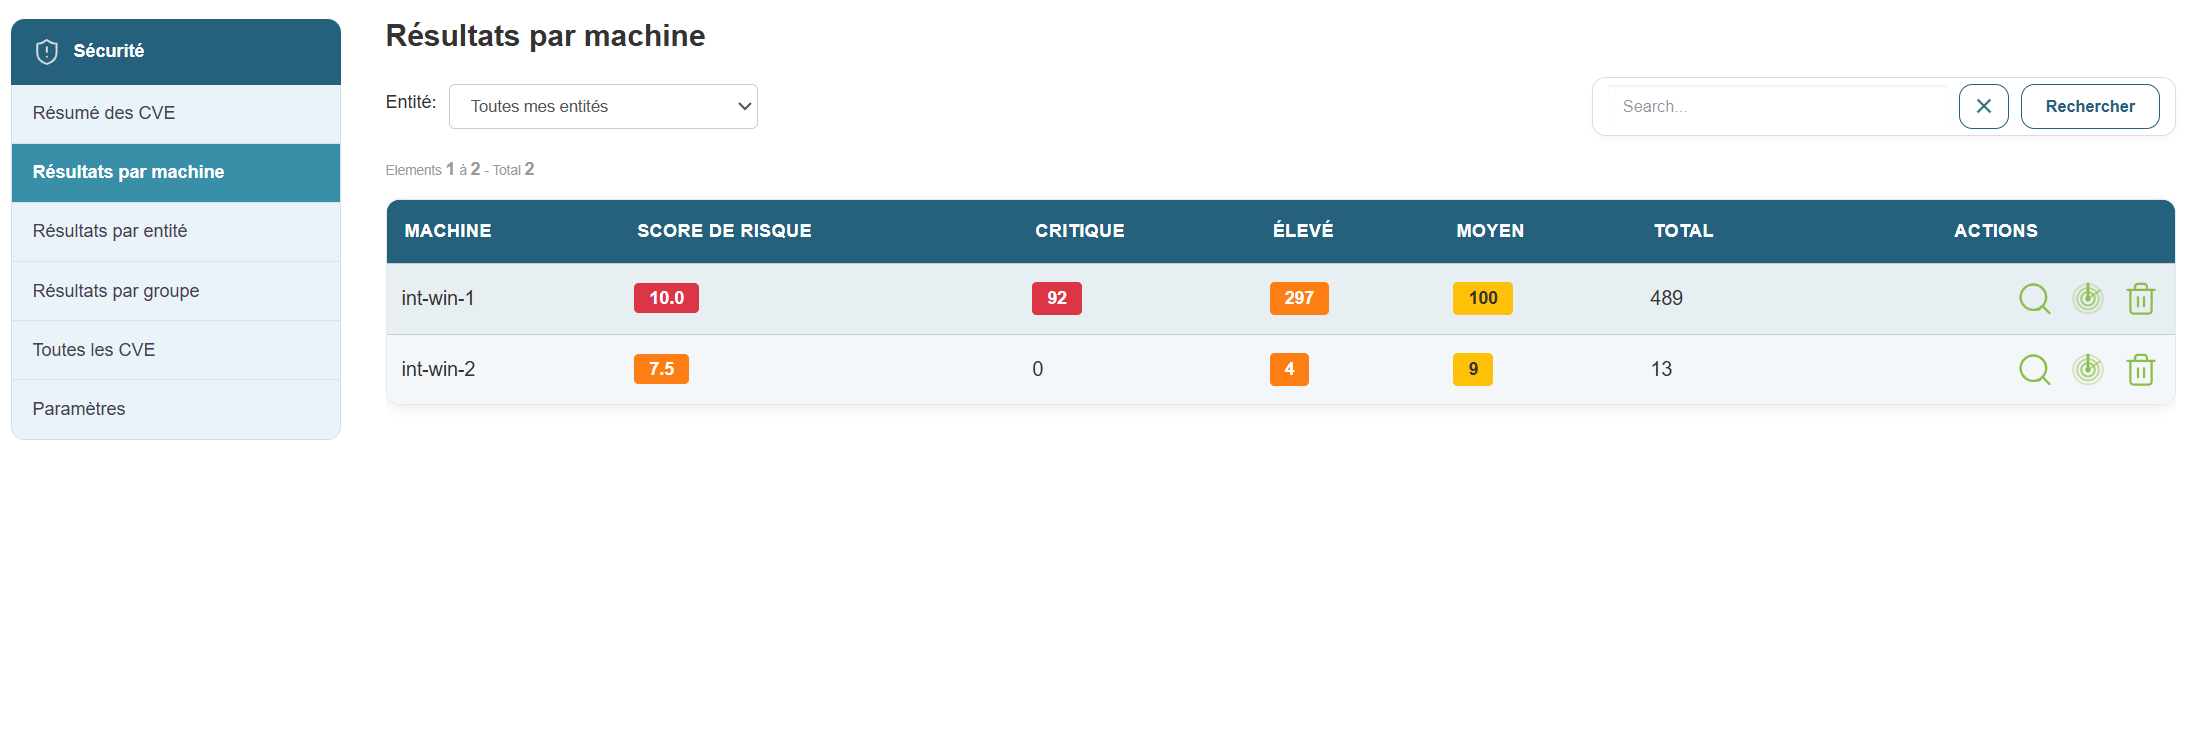
Results view by group
Results View by Group
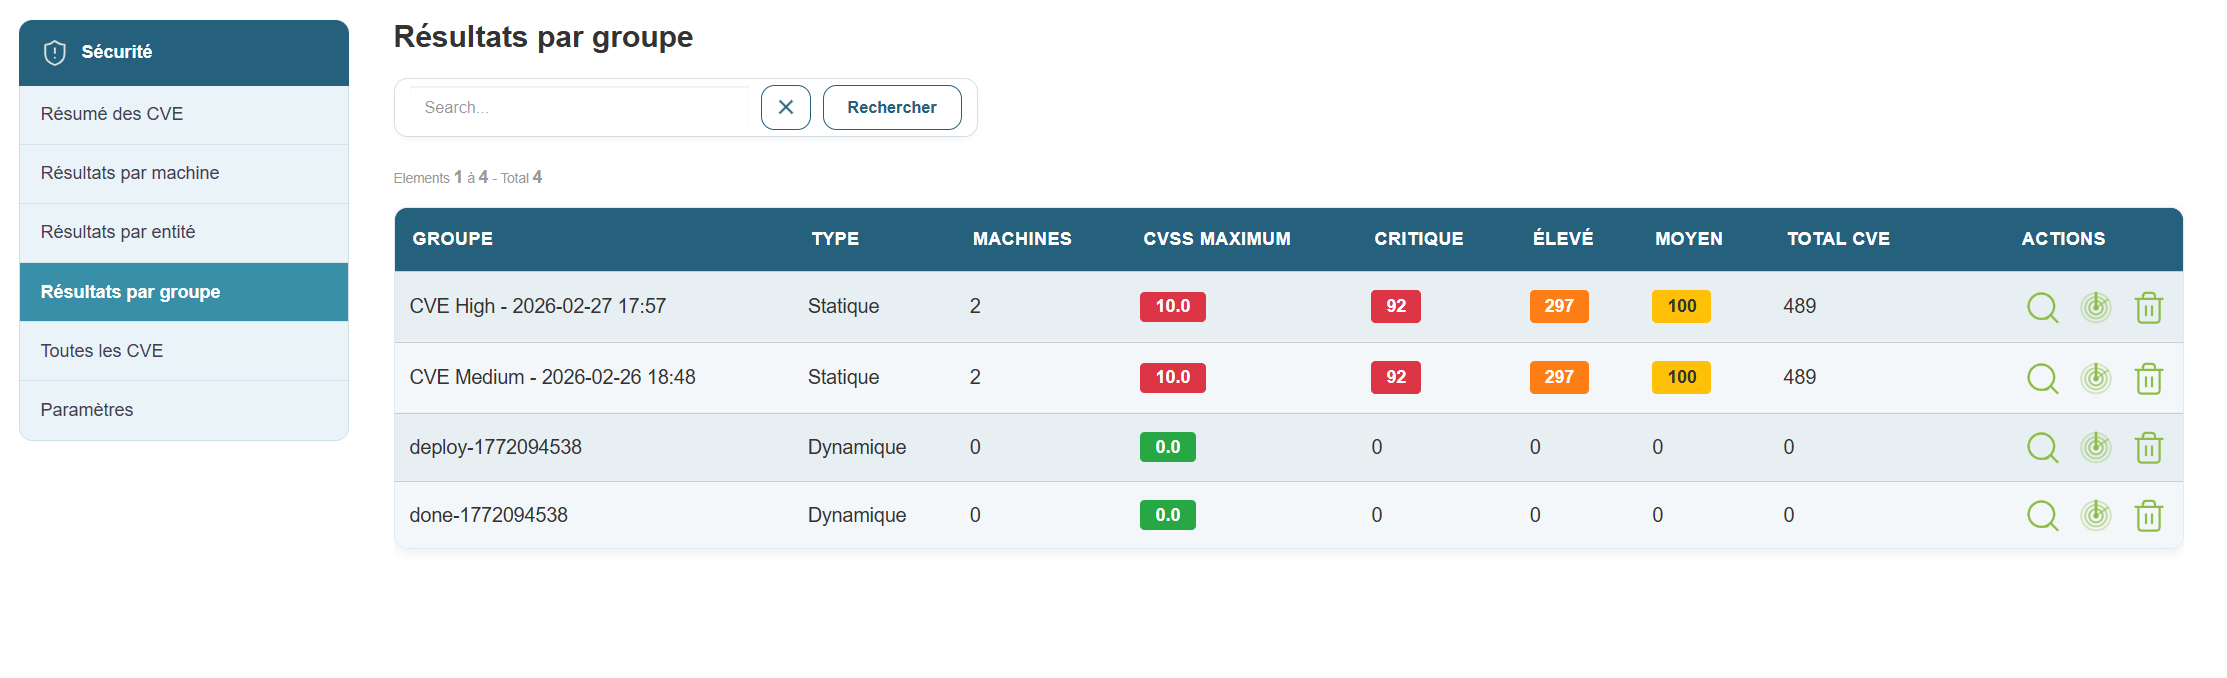
This view displays only the machine group view and includes the following information:
- Group name
- Group type
- Number of machines per group
- CVSS score
- Number of critical CVEs
- Number of high-severity CVEs
- Number of medium CVEs
- Number of low-severity CVEs
- Total CVEs per group
- The two actions: detailed view and scan initiation for a group.
By clicking the "Details by Group" button, you can view the details by machine, showing only the machines in that group.
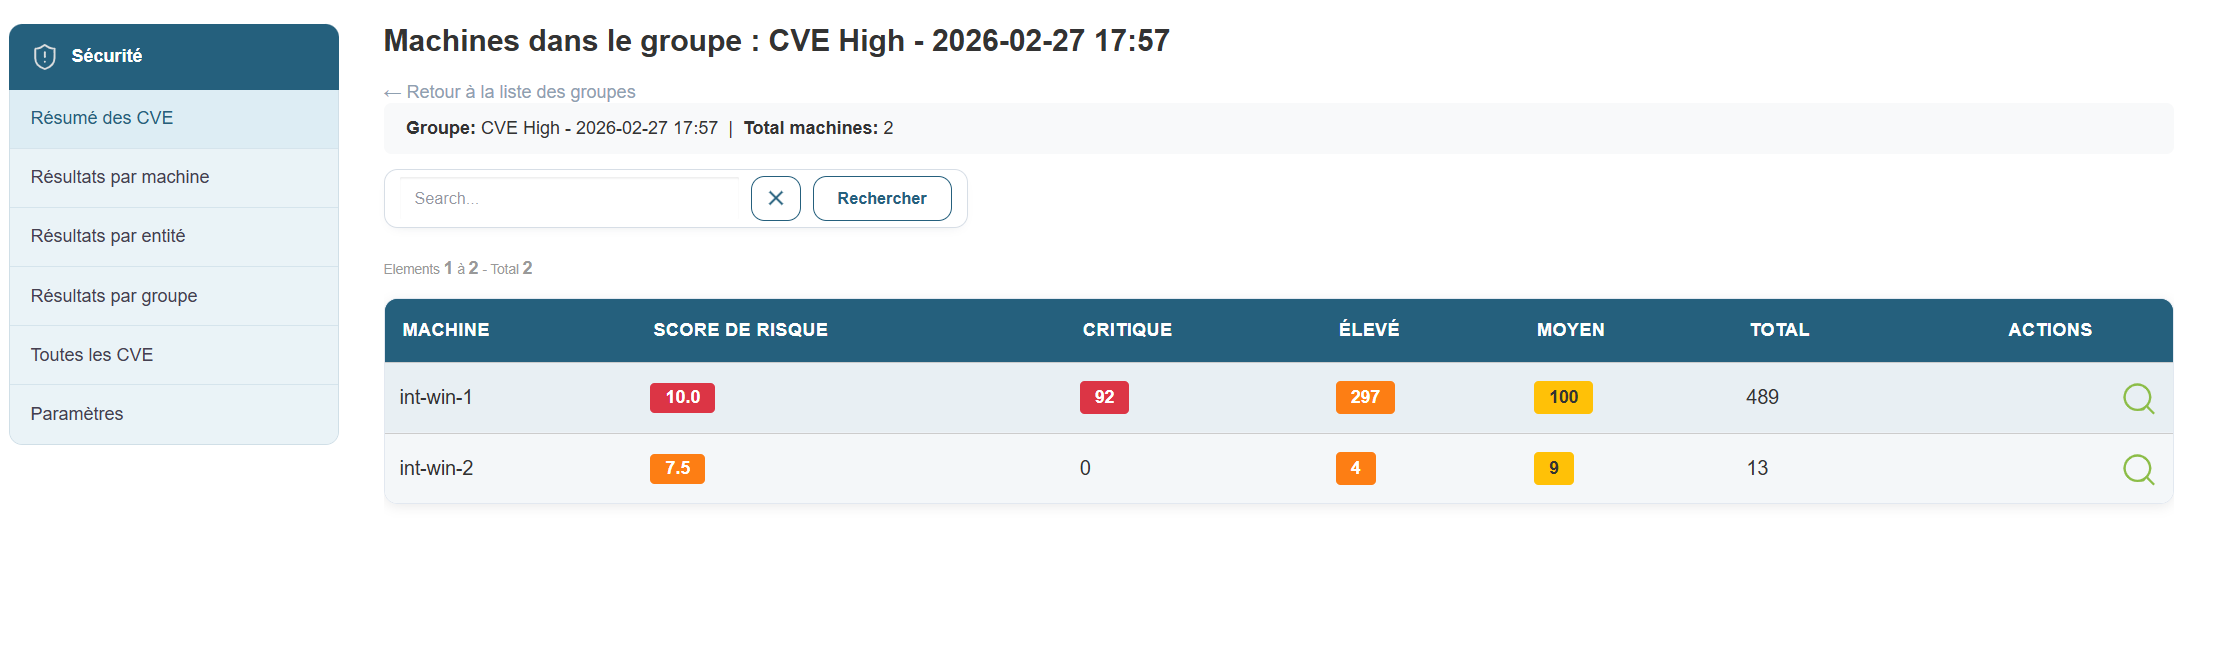
View all CVEs
View all CVEs
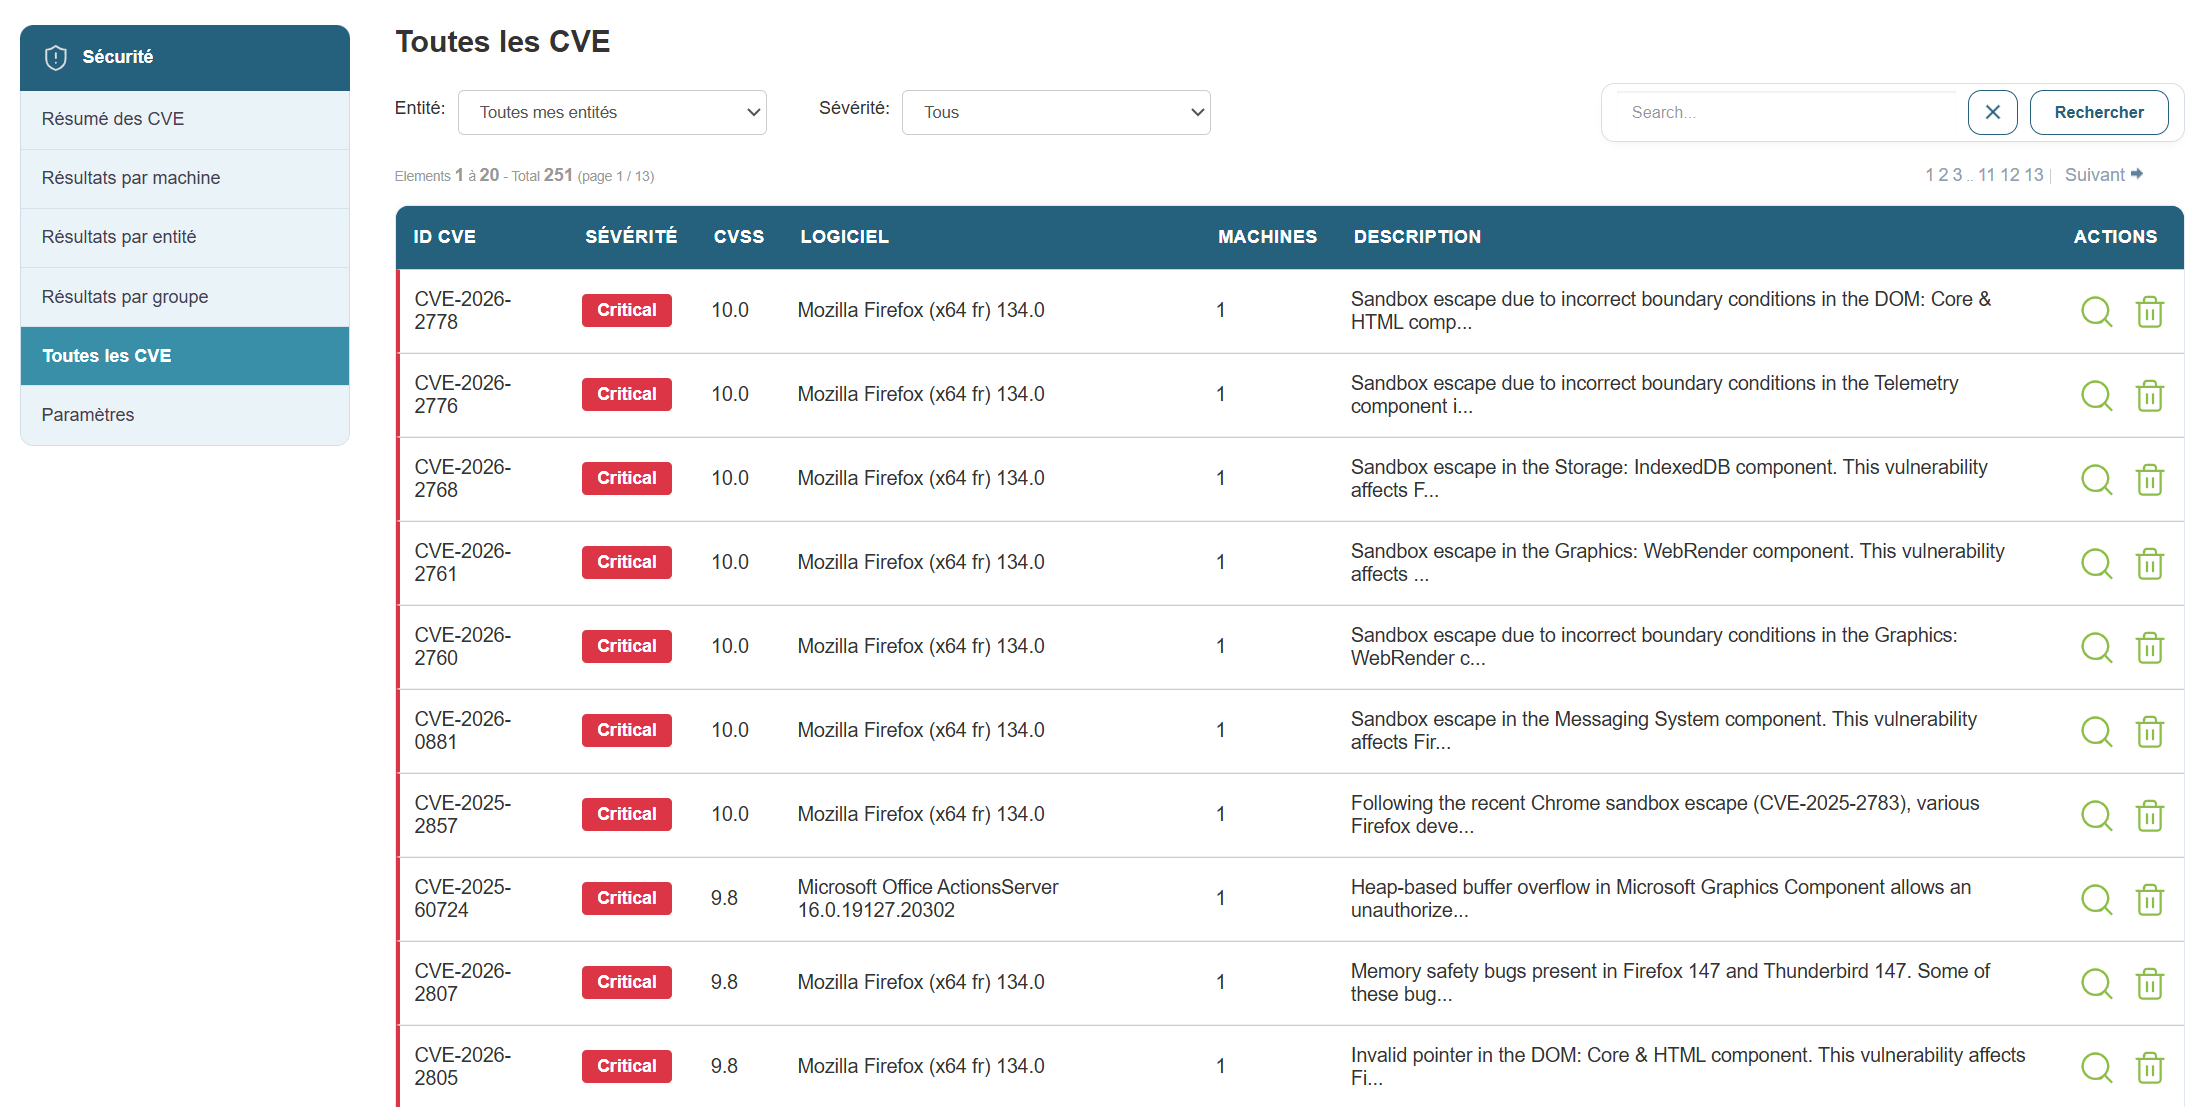
Here you will find all CVEs and the following information:
- The CVE ID
- Severity
- The CVSS score
- The affected software
- The number of affected machines
- Description
- Detailed action.
When you click on "Details," you will see the CVE record that was displayed in the main view:
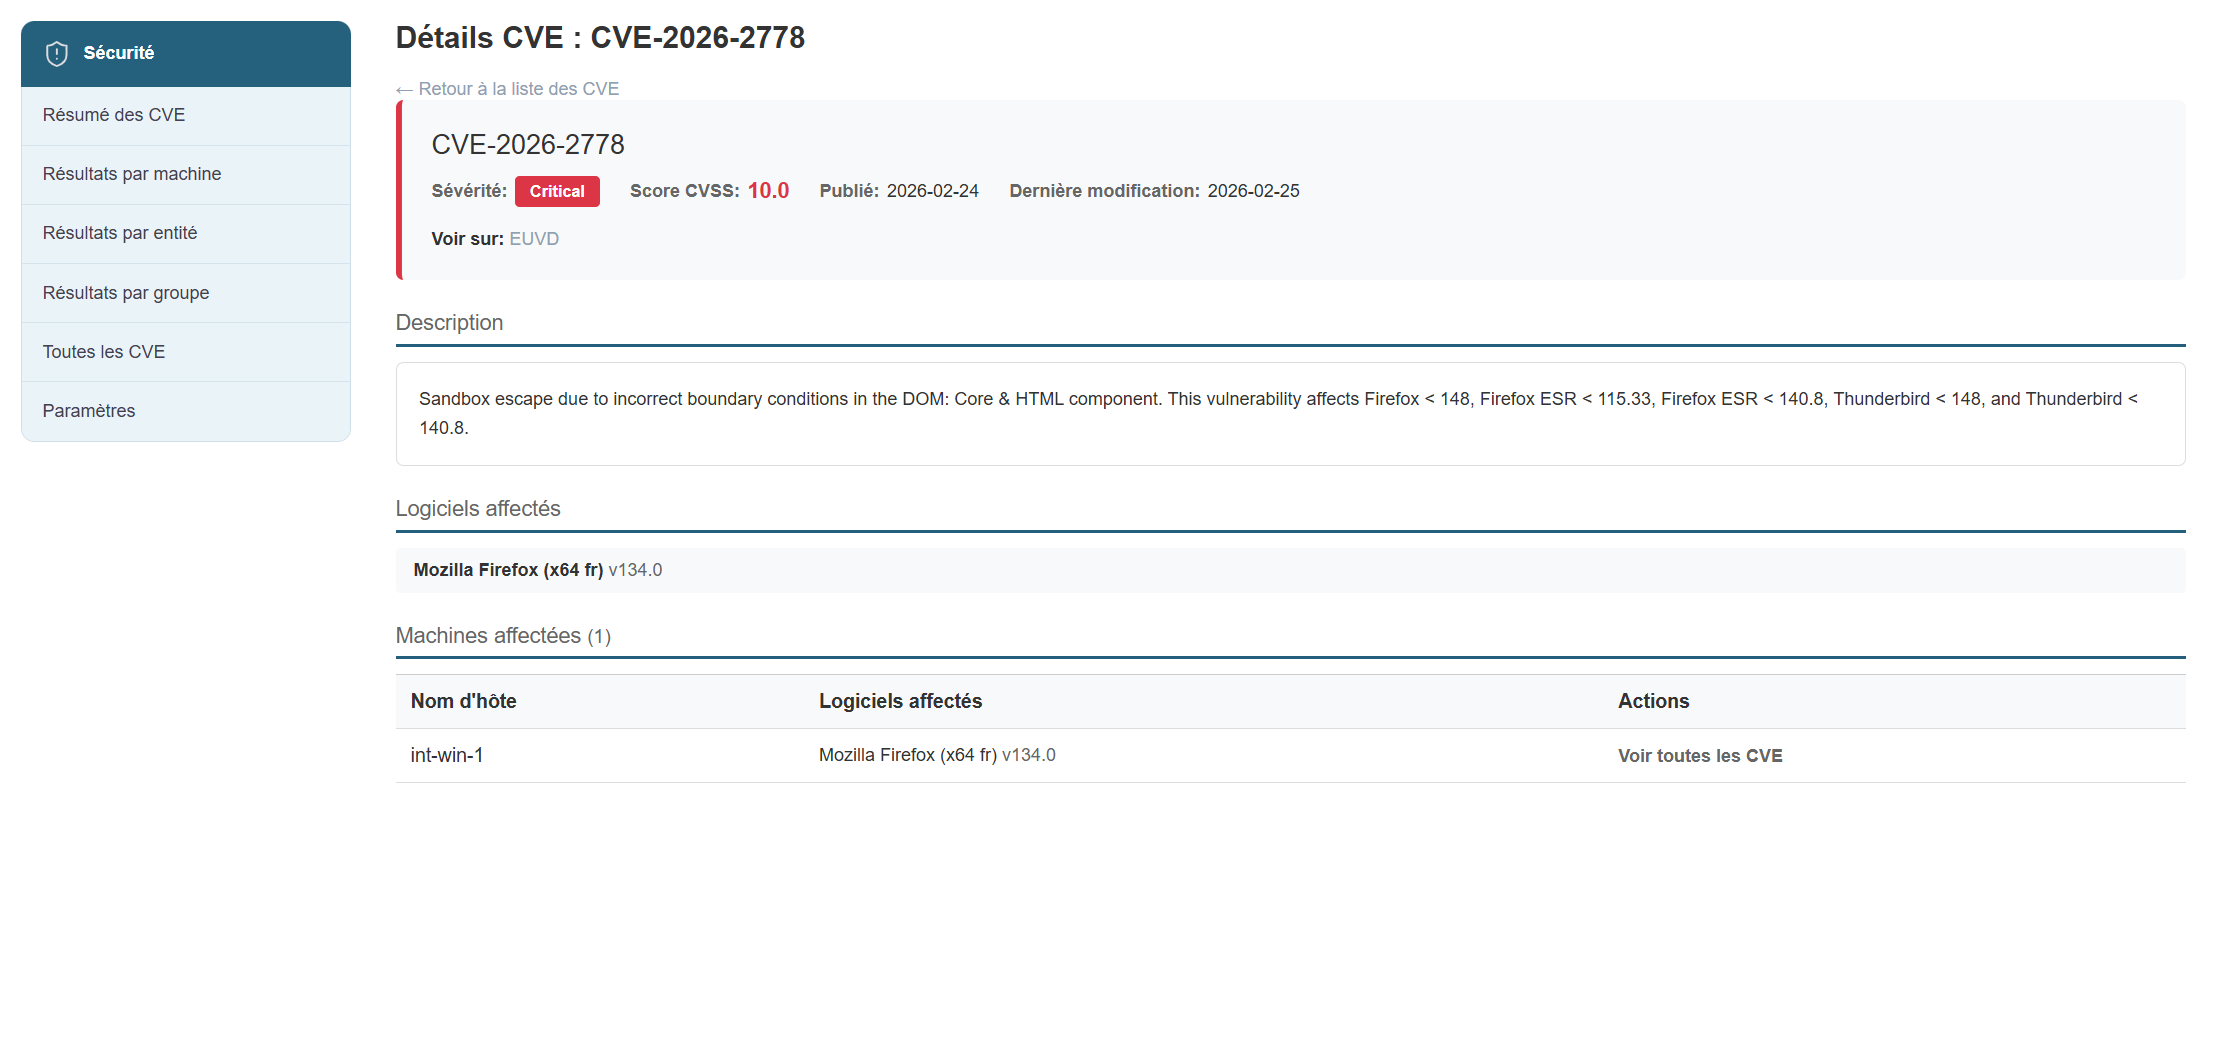
CVE settings.
- Display filters
- Software filters
- CVE filters
- Publisher filters
- Machine filters
- Group filters
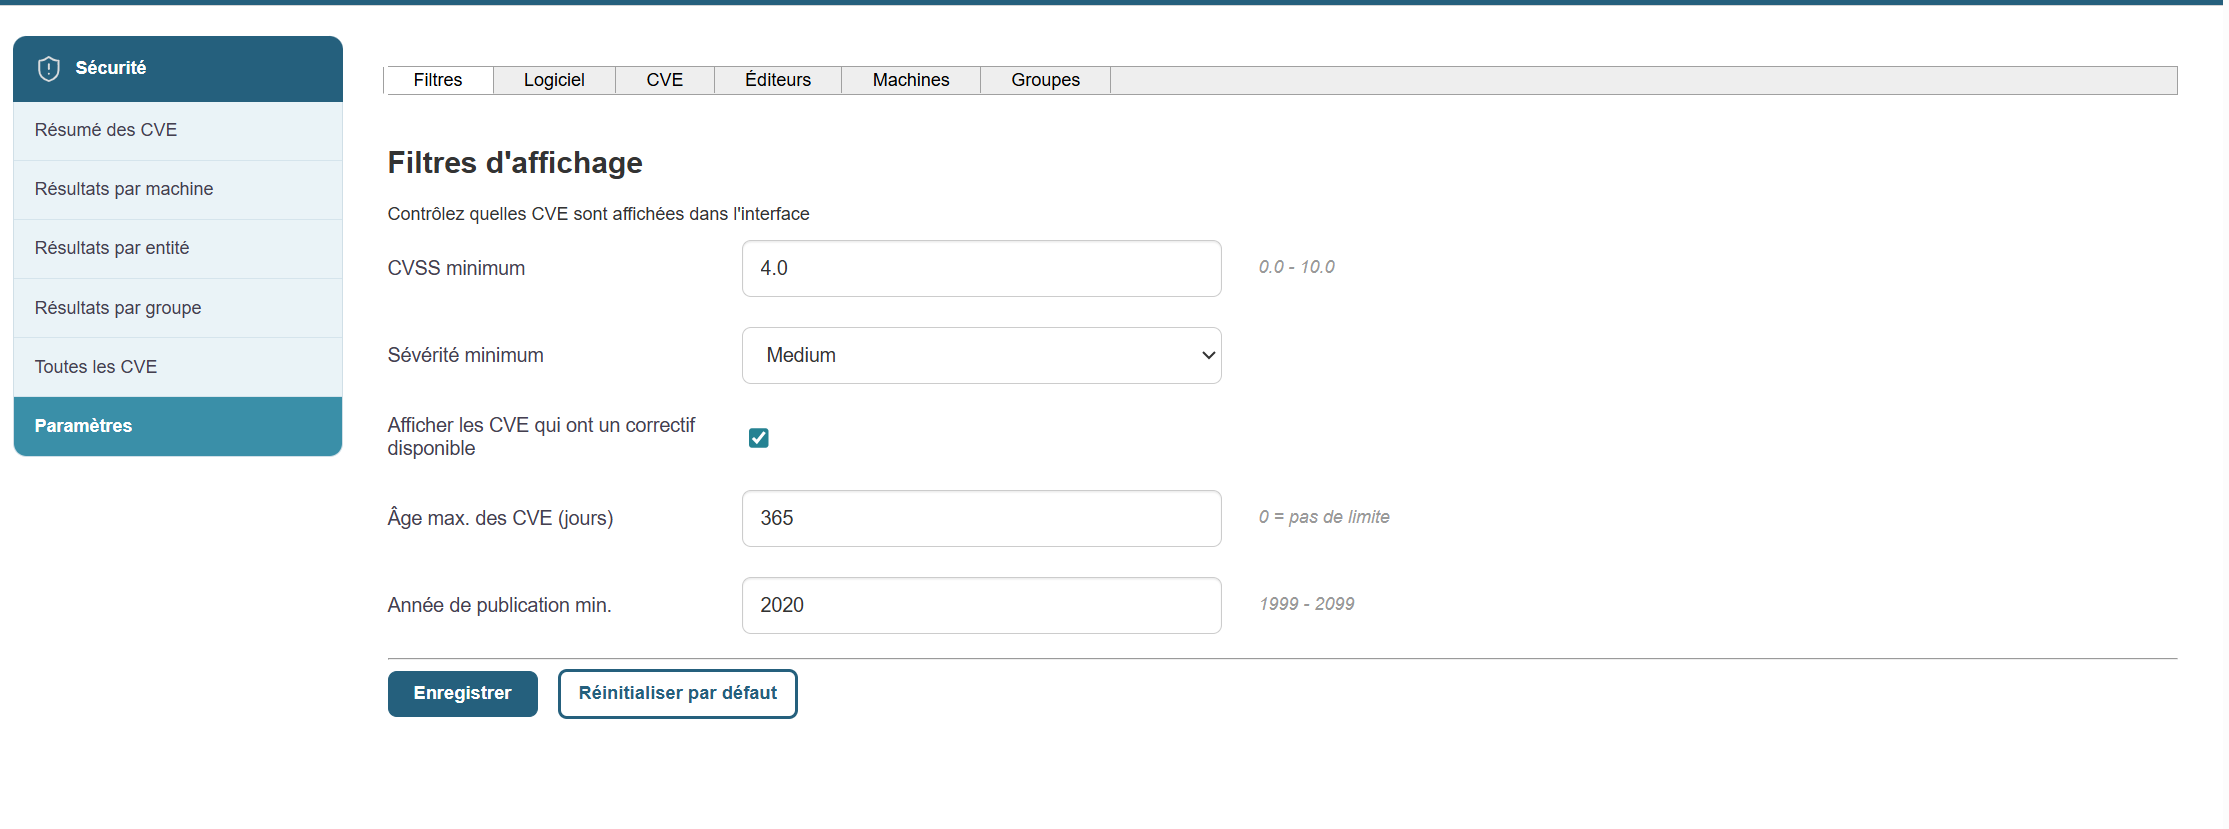
Display filters:
You can select display filters based on the following options:
- Minimum CVSS Score
- Minimum Severity
- Maximum Age of CVEs
- Minimum CVE Publication Year
Software Filters:
We can apply filters to the software we want to exclude from the list of CVEs. :
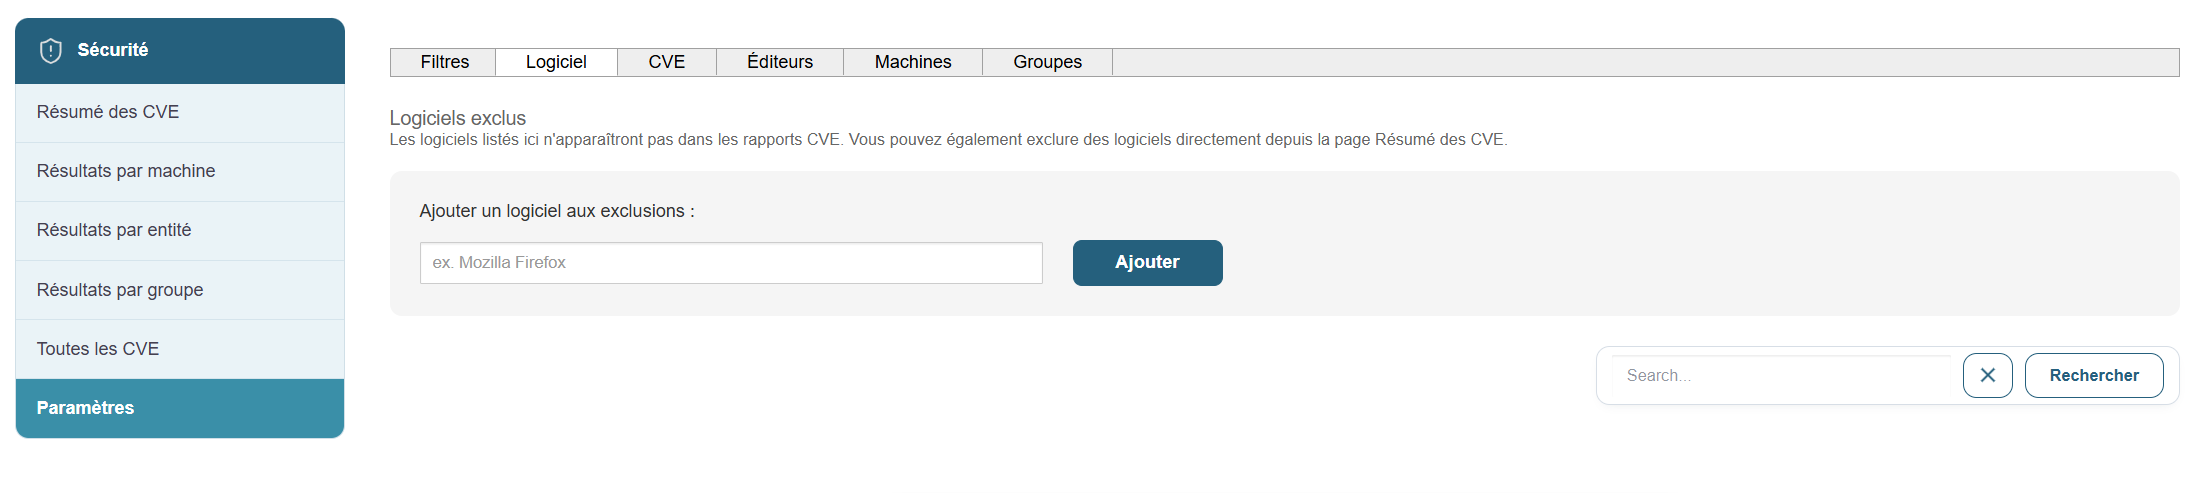
CVE filters:
We will apply filters to the CVEs we want to exclude from the list:
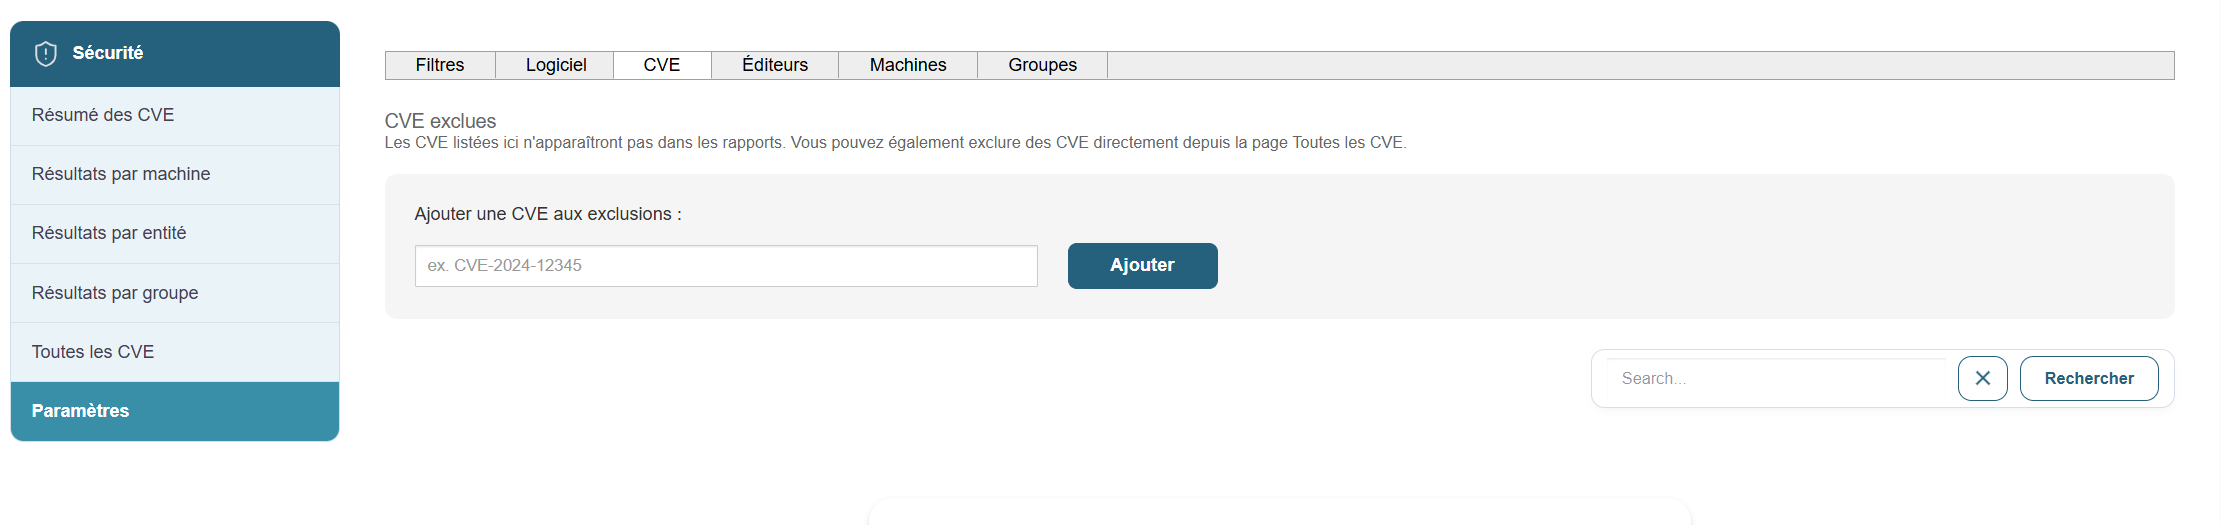
Vendor filters:
We will apply filters to the vendors we want to exclude from the CVE list.
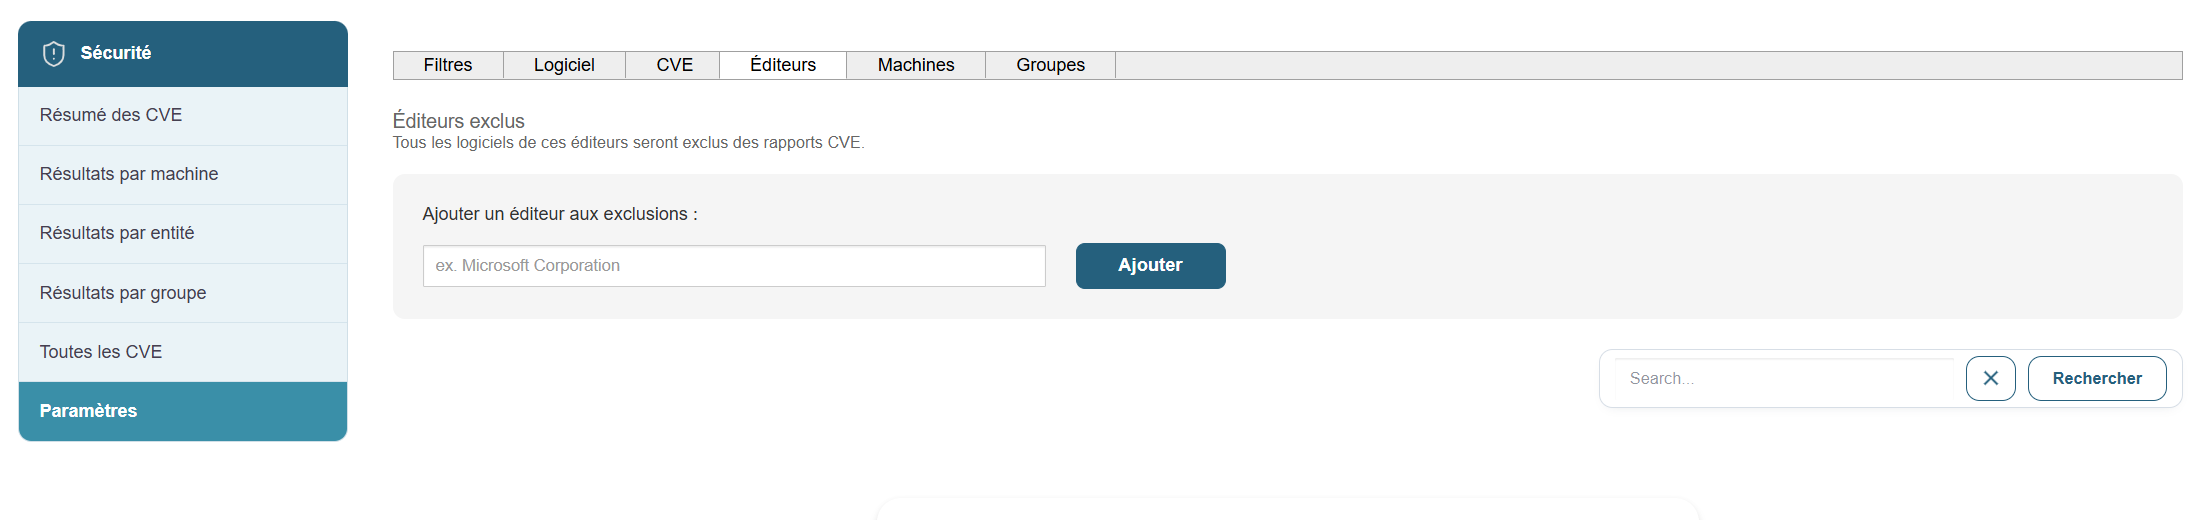
Machine filters:
We will set exclusions for the machines we want to exclude. To do this, simply click on the  in the list of machines.
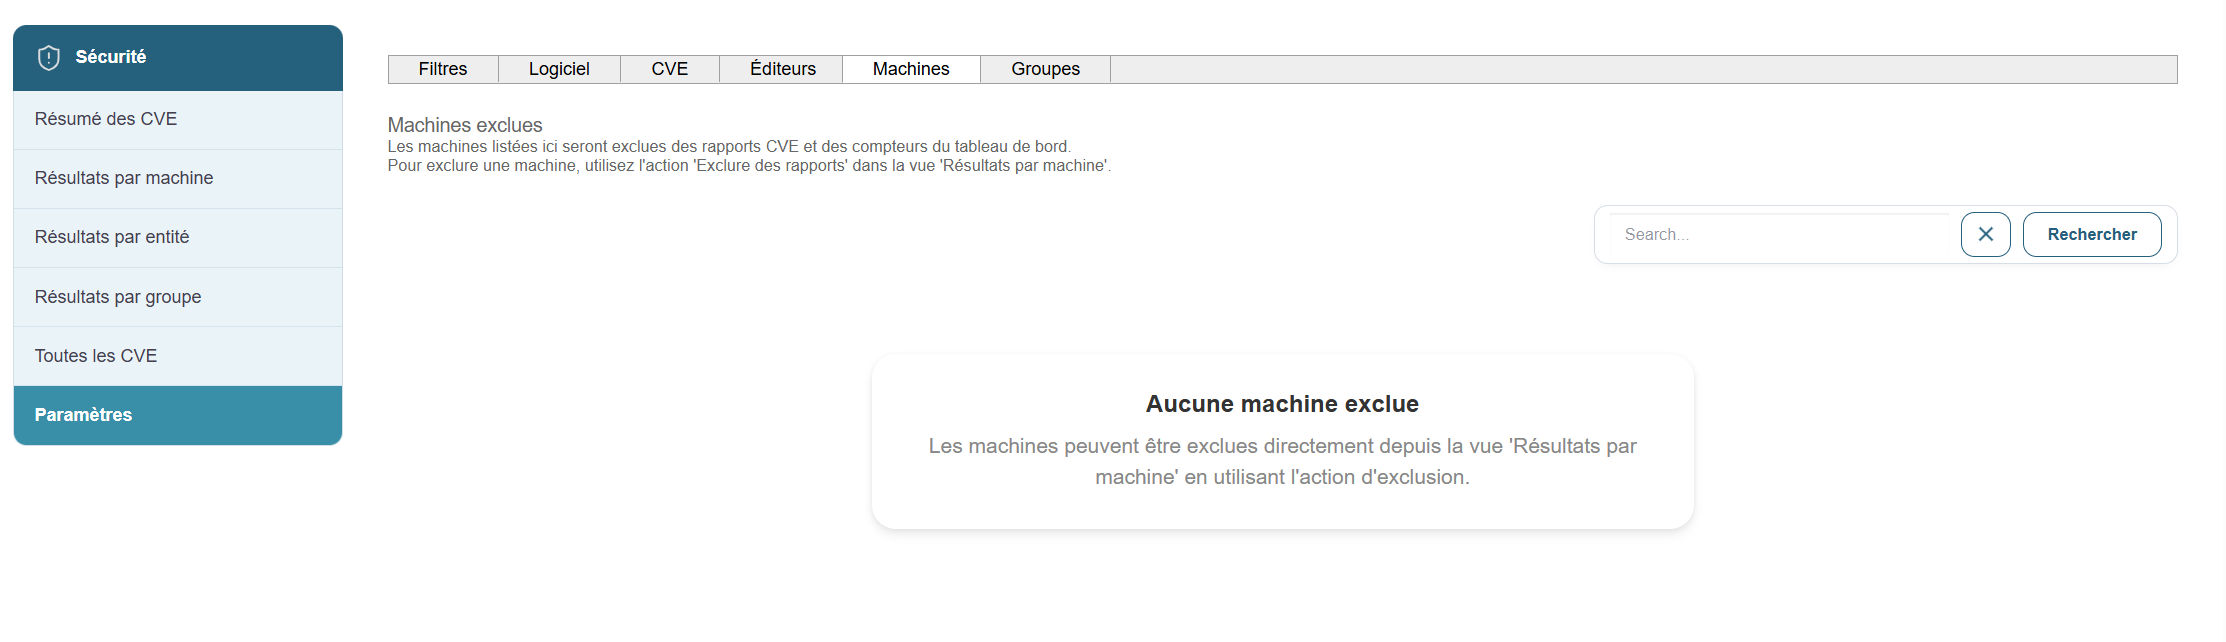
Group filters:
We will set exclusions for groups. To do this, simply click the button in the list of groups .
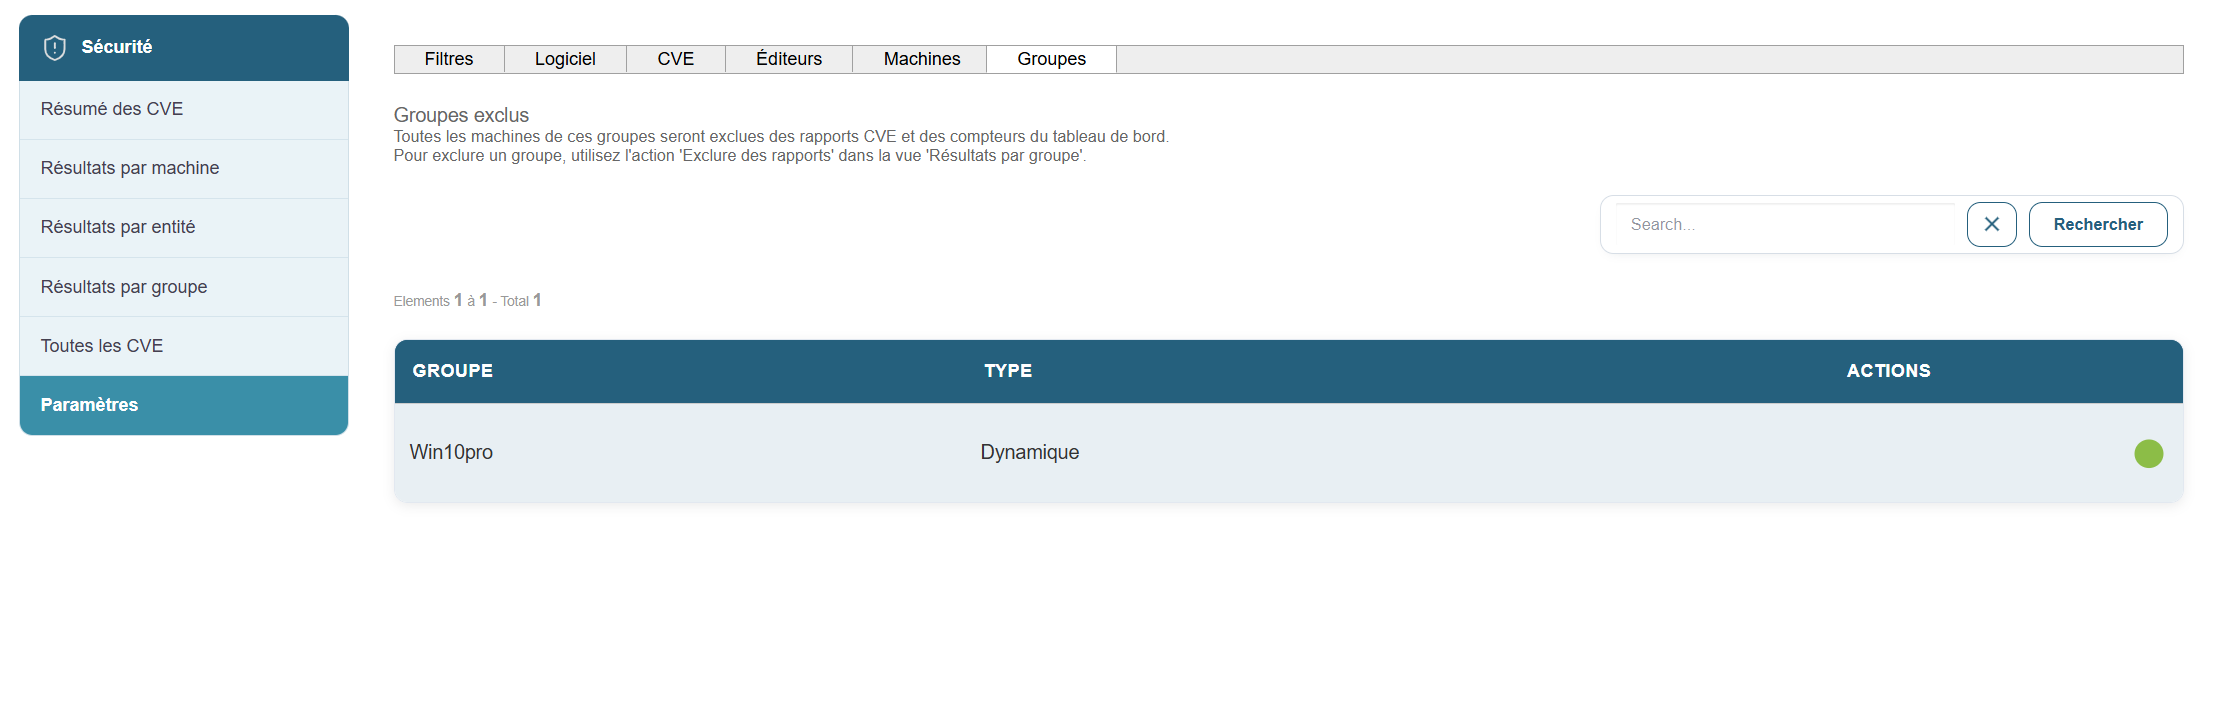
Case Studies
Dynamic group with multiple criteria
To update applications, we can create a dynamic group using a combination of criteria:
For example, I want to create a dynamic group that contains Windows 11 Pro machines, a specific software, and a specific software version.
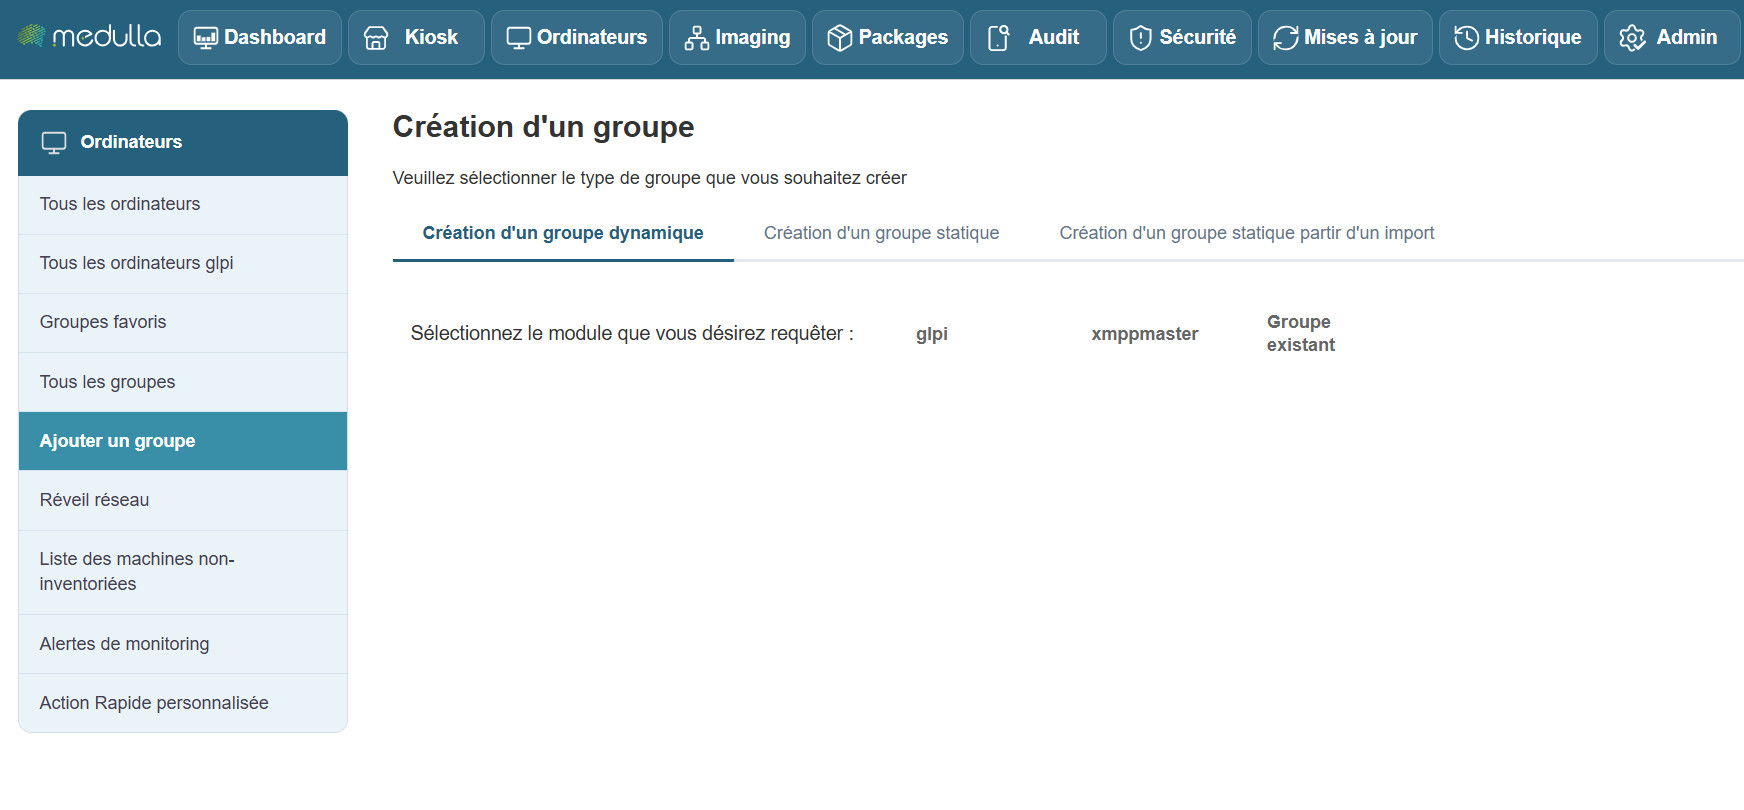
We add a section, "Installed Software," to our group:
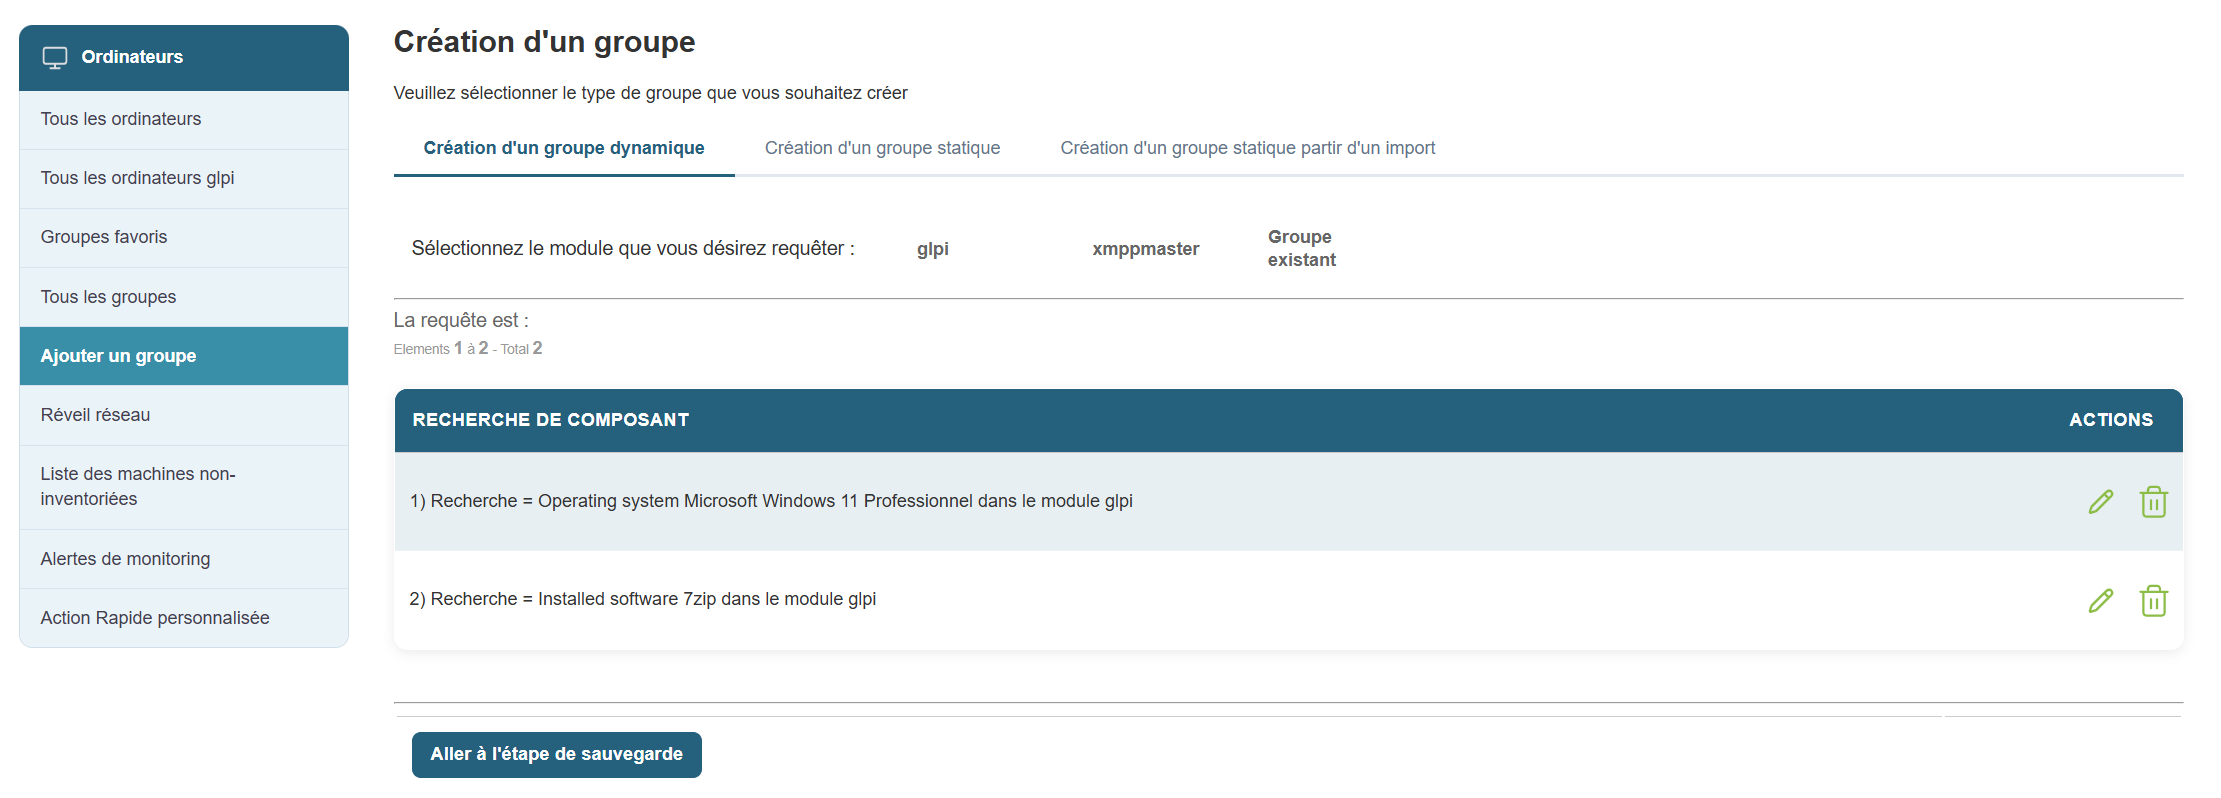
Then another section, "Software Version":
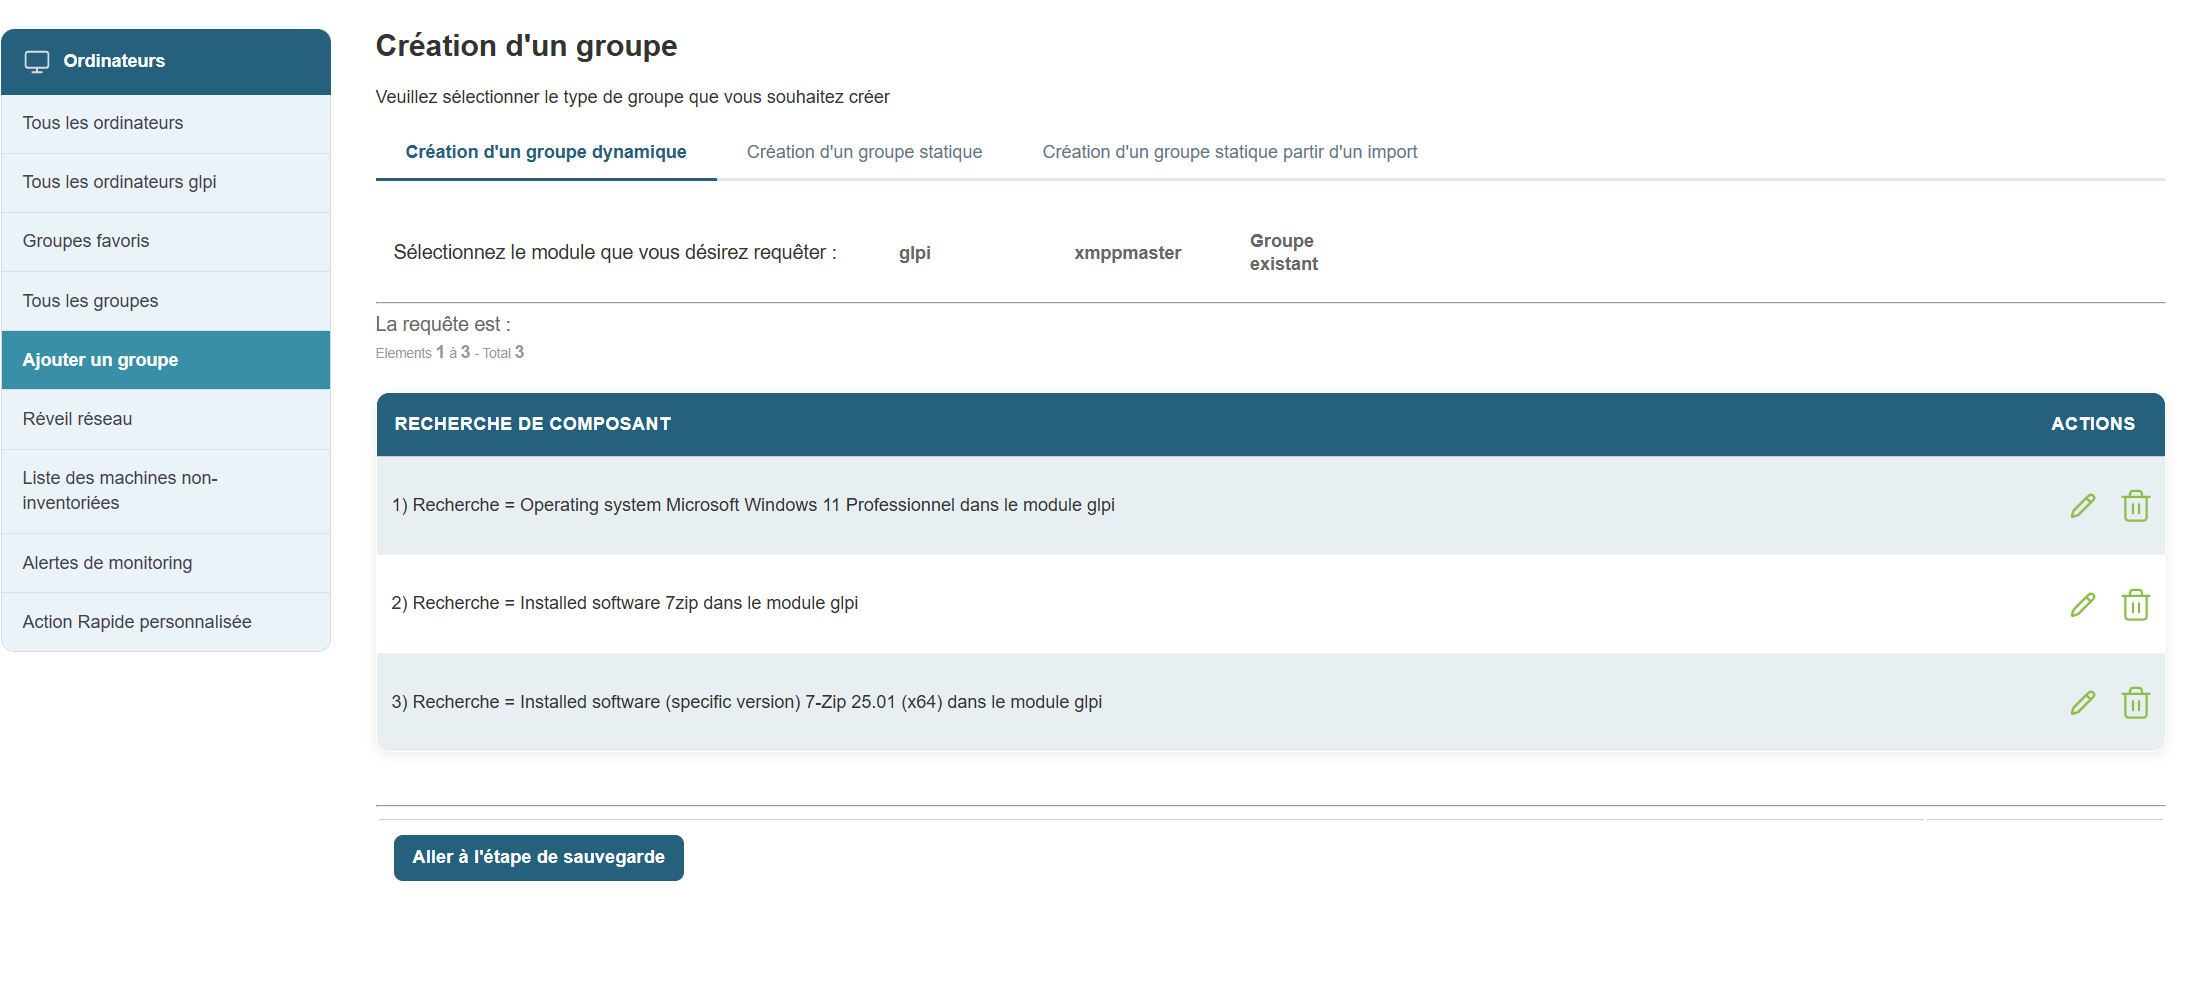
Next, we’ll save our group and orchestrate it by clicking “Go to Save Step.”
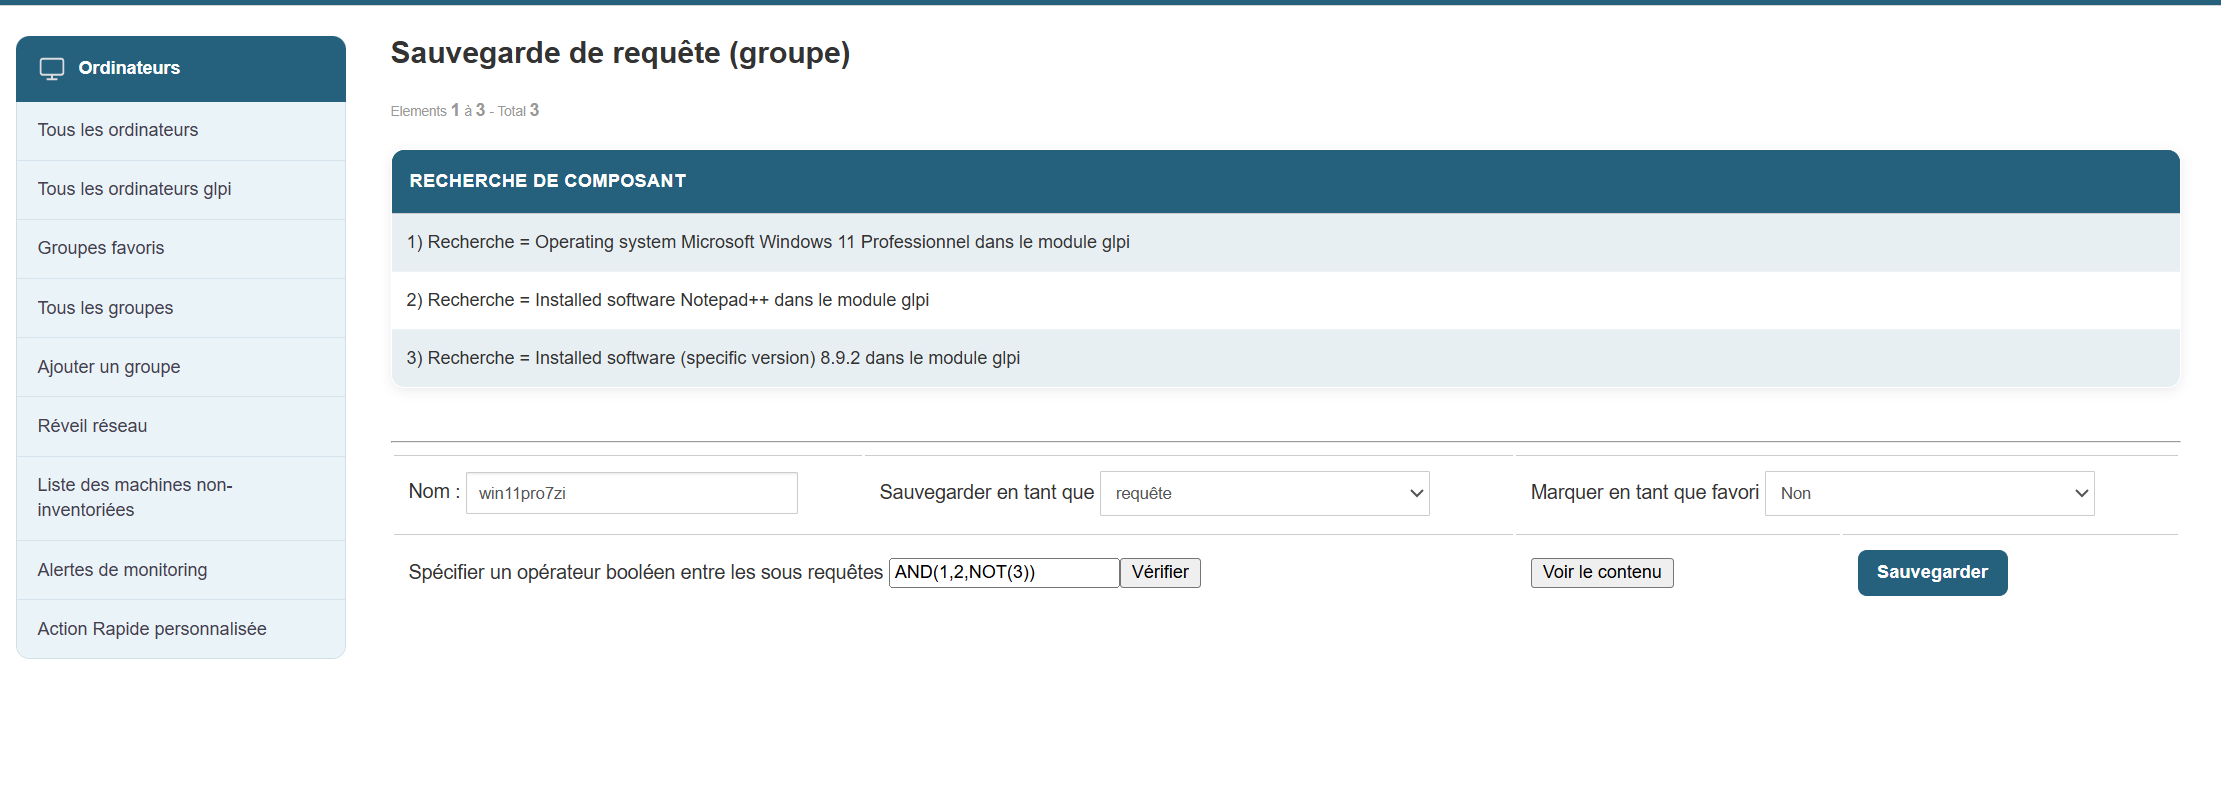
We’ll specify a Boolean operator in the sub-queries and then click “Save.”
Once my group is created, I can interact with it and initiate a deployment of a new version of Notepad++.
Application convergence (Positive convergence)
From the Medulla interface, you can deploy packages to a group, whether static or dynamic.
In the case of a dynamic group, you can enable application convergence.
What is application convergence? :
Application convergence is a deployment task that repeats every 24 hours to verify that the package(s) you have defined for convergence are properly deployed; if a new workstation or an existing workstation in the group does not have the package installed, it will deploy that package.
In summary, application convergence allows you to maintain application compliance across your fleet.
How does it work? :
First, once in the Médulla interface, go to the Computers tab. In the left-hand menu, select the group for which you want to enable application convergence.
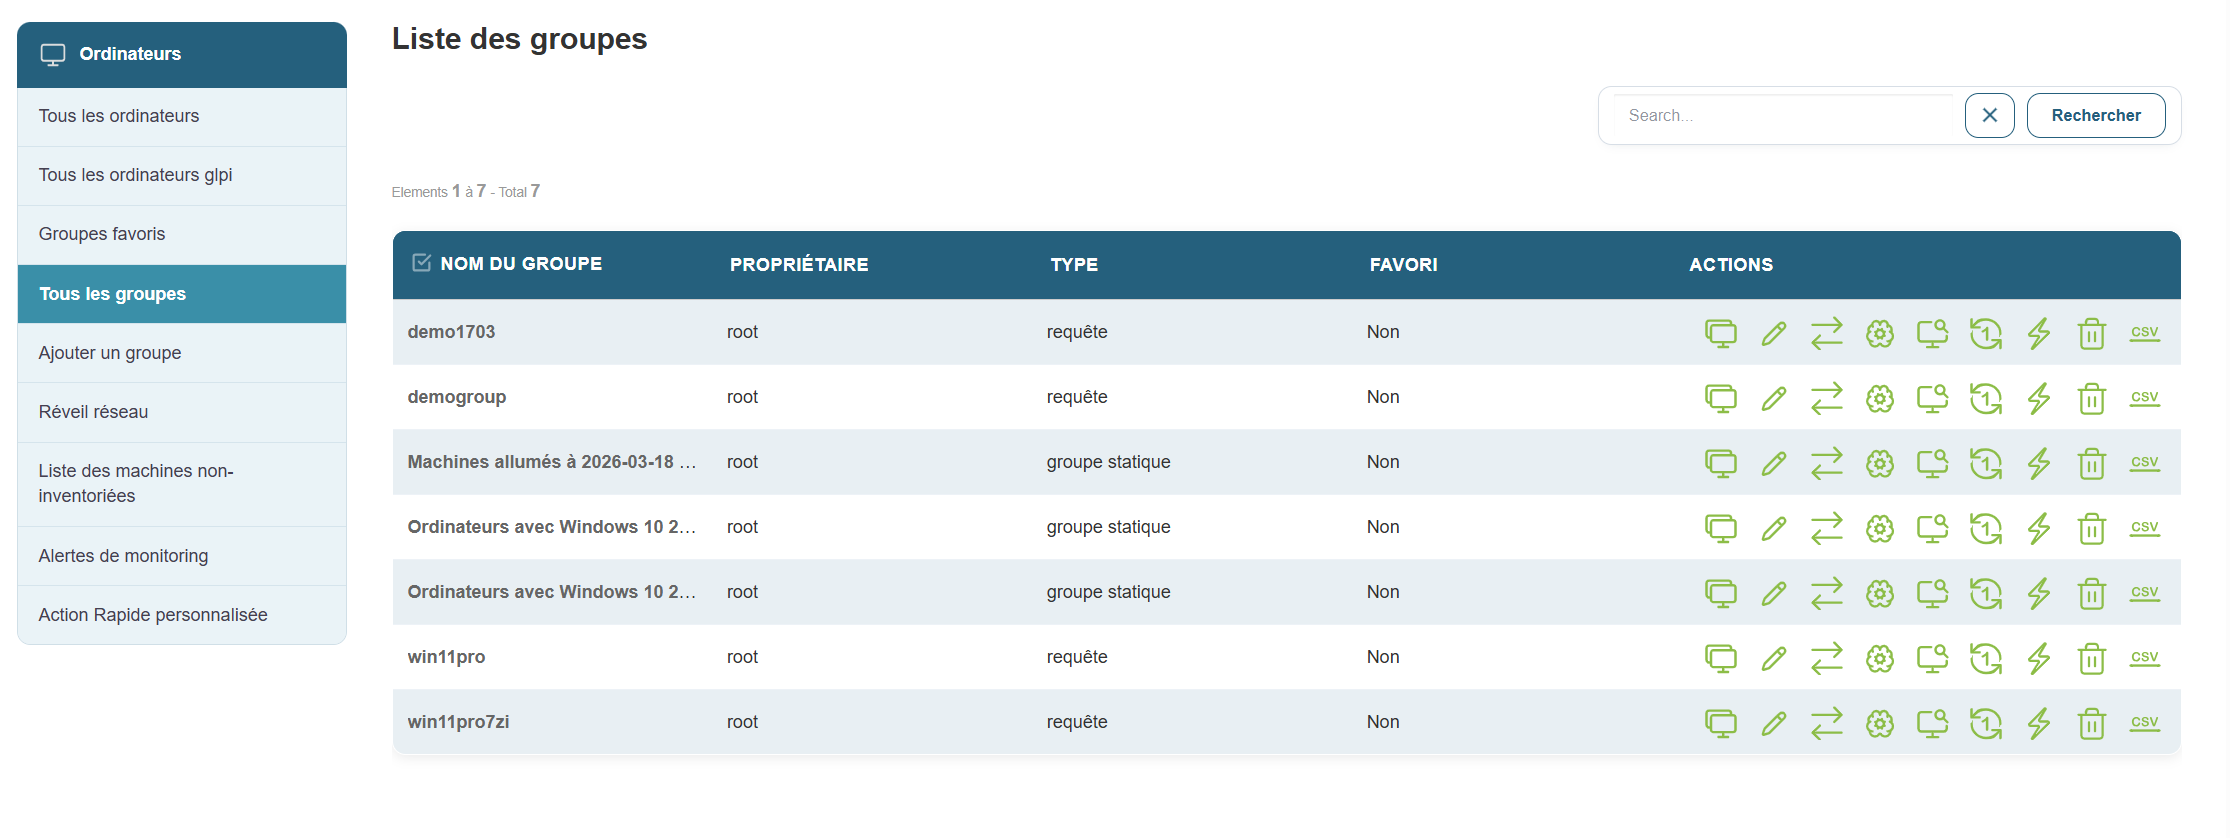
Click the Deployment button: ![]()
You will then enter the menu that allows you to select the package you want to converge:
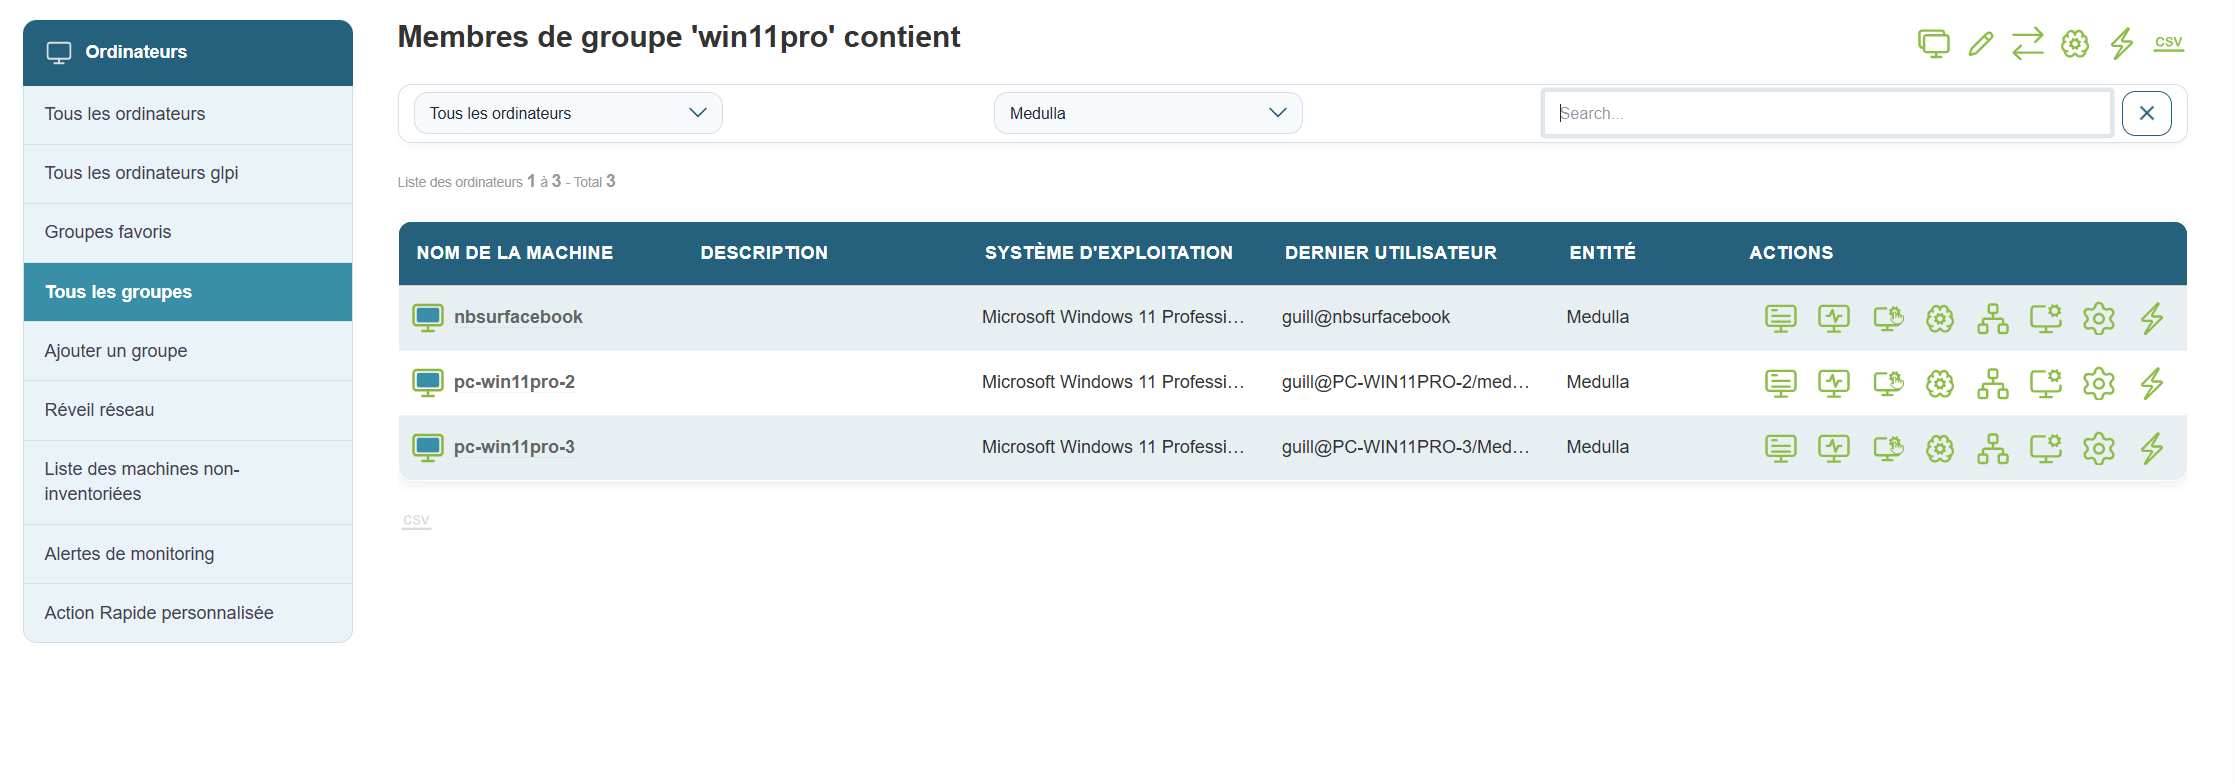
Click the Application Convergence button ![]()
You will then enter the convergence scheduling menu:
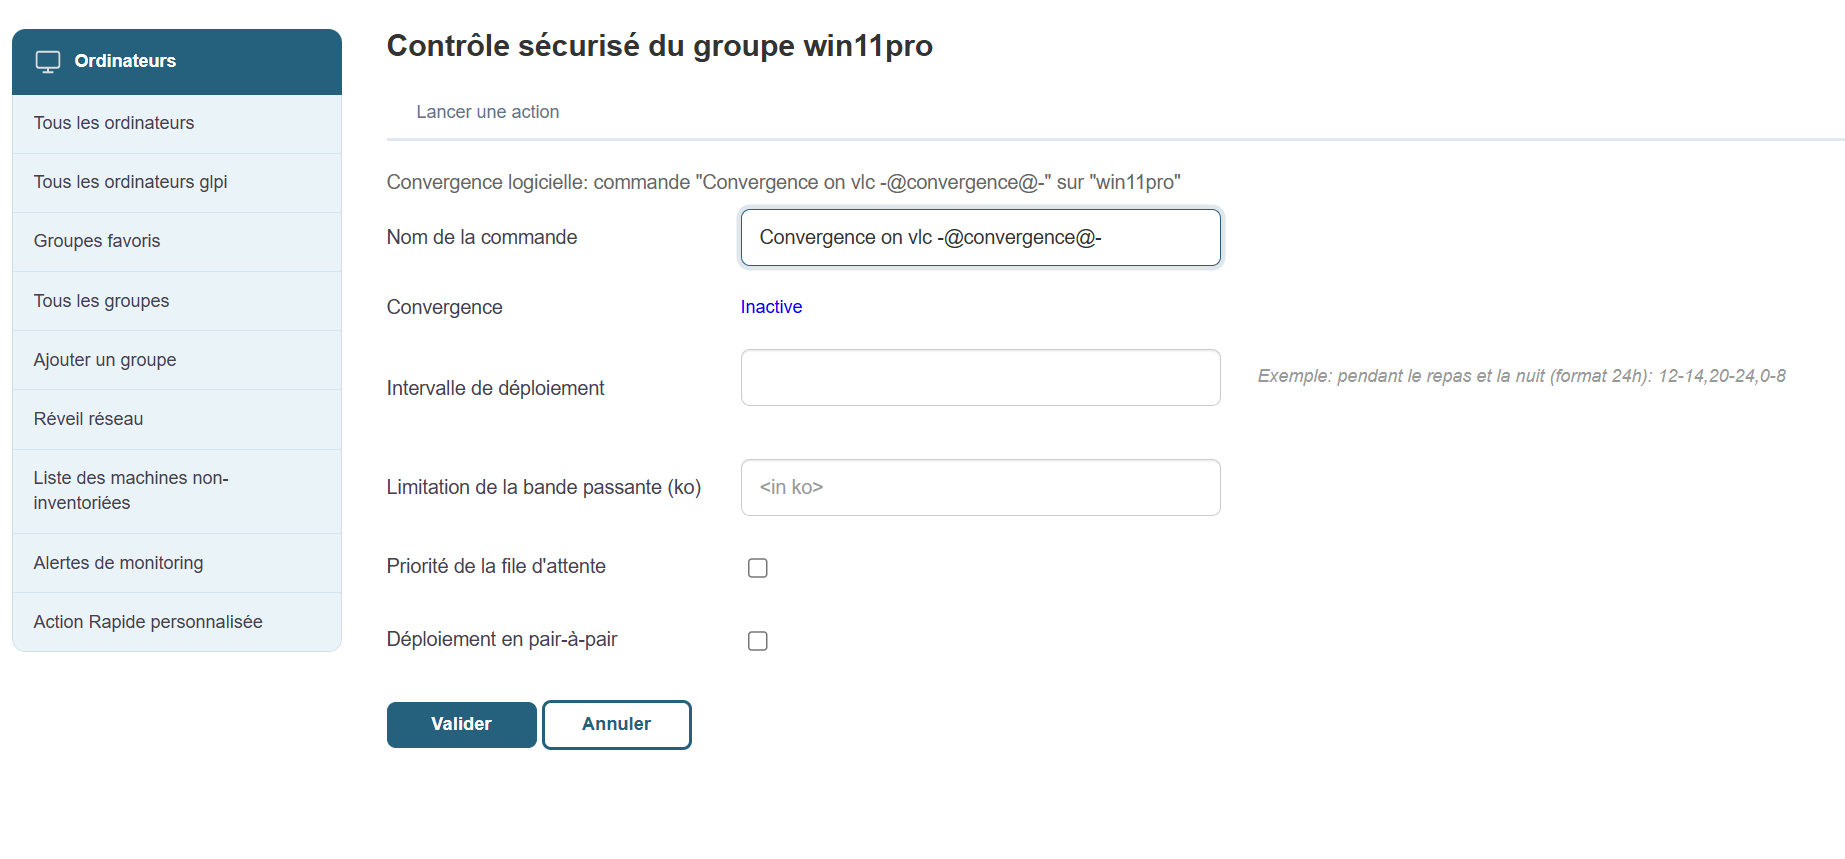
You can use the following available options:
Command name:
Deployment interval:
Queue priority:
Peer-to-peer deployment:
Then click "Confirm" and convergence will be activated.
Once enabled, convergence will begin.
You can find information about the execution of your convergences in the Audit tab:
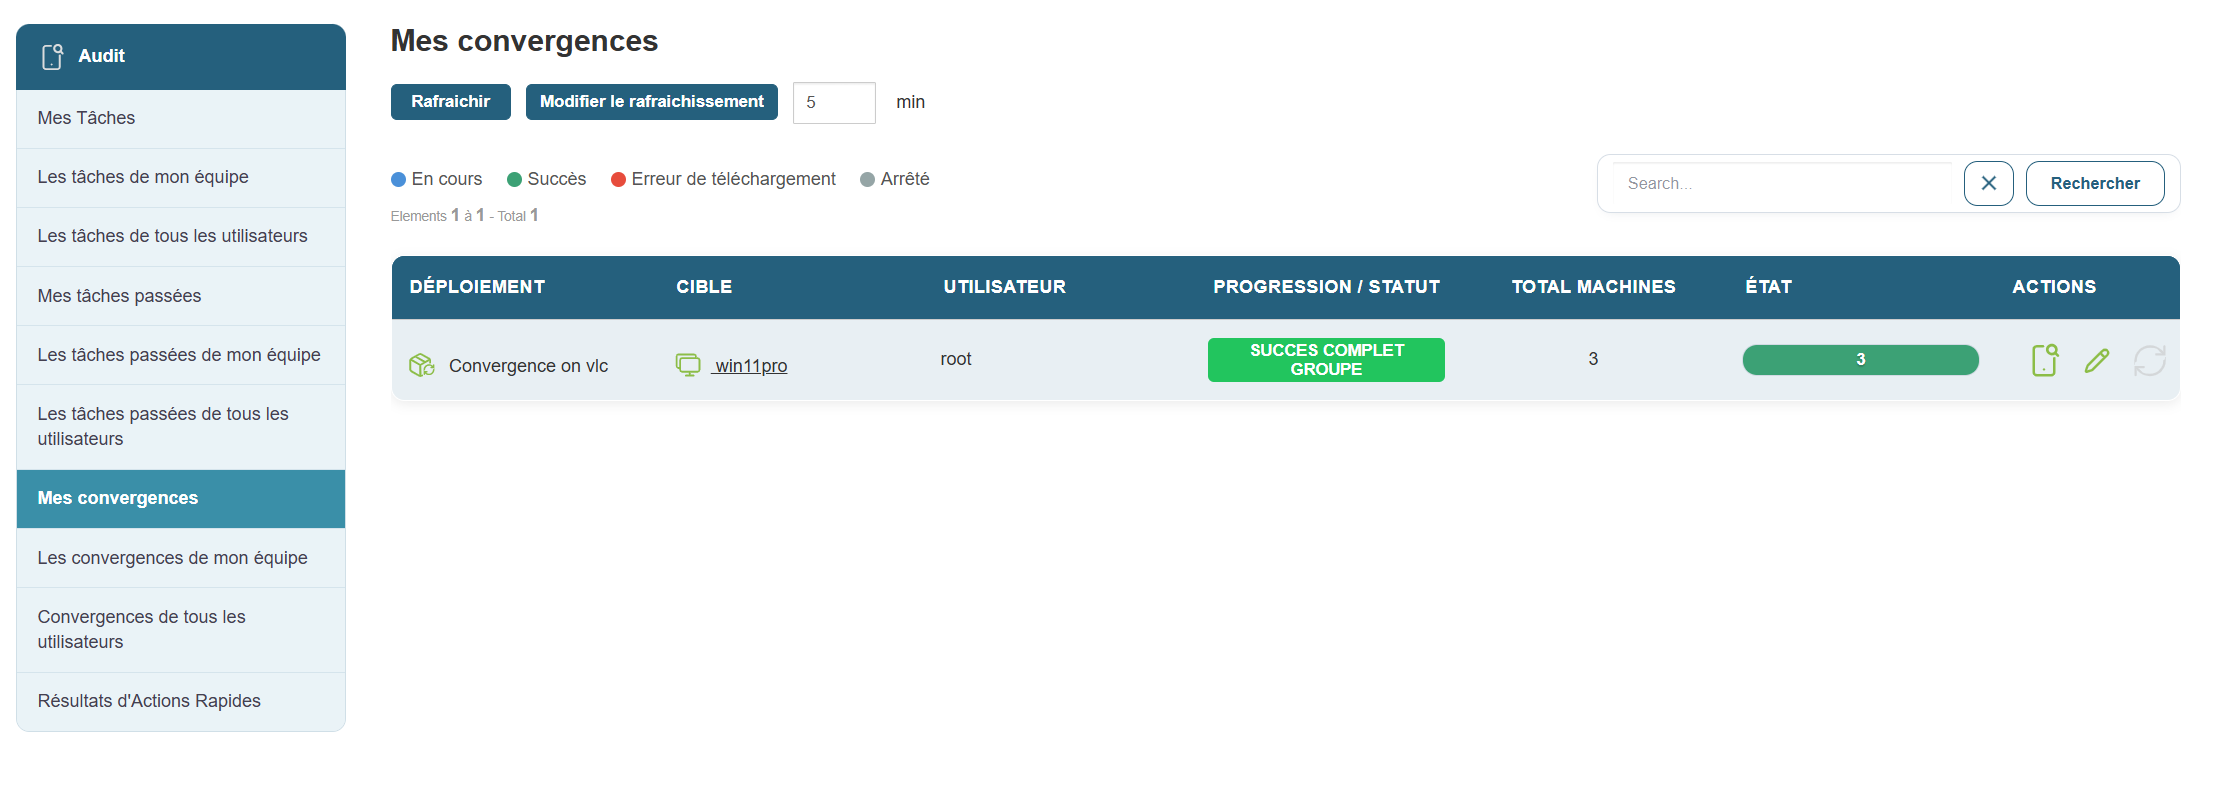
Three entries in the left-hand menu allow you to track your convergences:
My Convergences:
Allows you to view the convergences scheduled by the current user of the session.
Convergences for All Users:
If you have administrator rights, you can view all convergences that have been scheduled by Medulla users.
My Team's Convergences:
Allows you to view the appointments scheduled by users who are in the same group as you.
Application convergence (Negative convergence)
Negative convergence allows you to uninstall packages that have been installed in dynamic groups.
In the case of a dynamic group, you can enable negative convergence
What is negative convergence? :
Negative convergence is an uninstallation task that repeats every 24 hours to verify that the package(s) you have defined for negative convergence are not deployed; if a new workstation or an existing workstation in the group has the package installed, it will uninstall that package.
In summary, negative convergence allows you to maintain application compliance across your fleet.
How does it work? :
First, once in the Médulla interface, go to the Computers tab. In the left-hand menu, select the group on which you want to enable negative convergence.
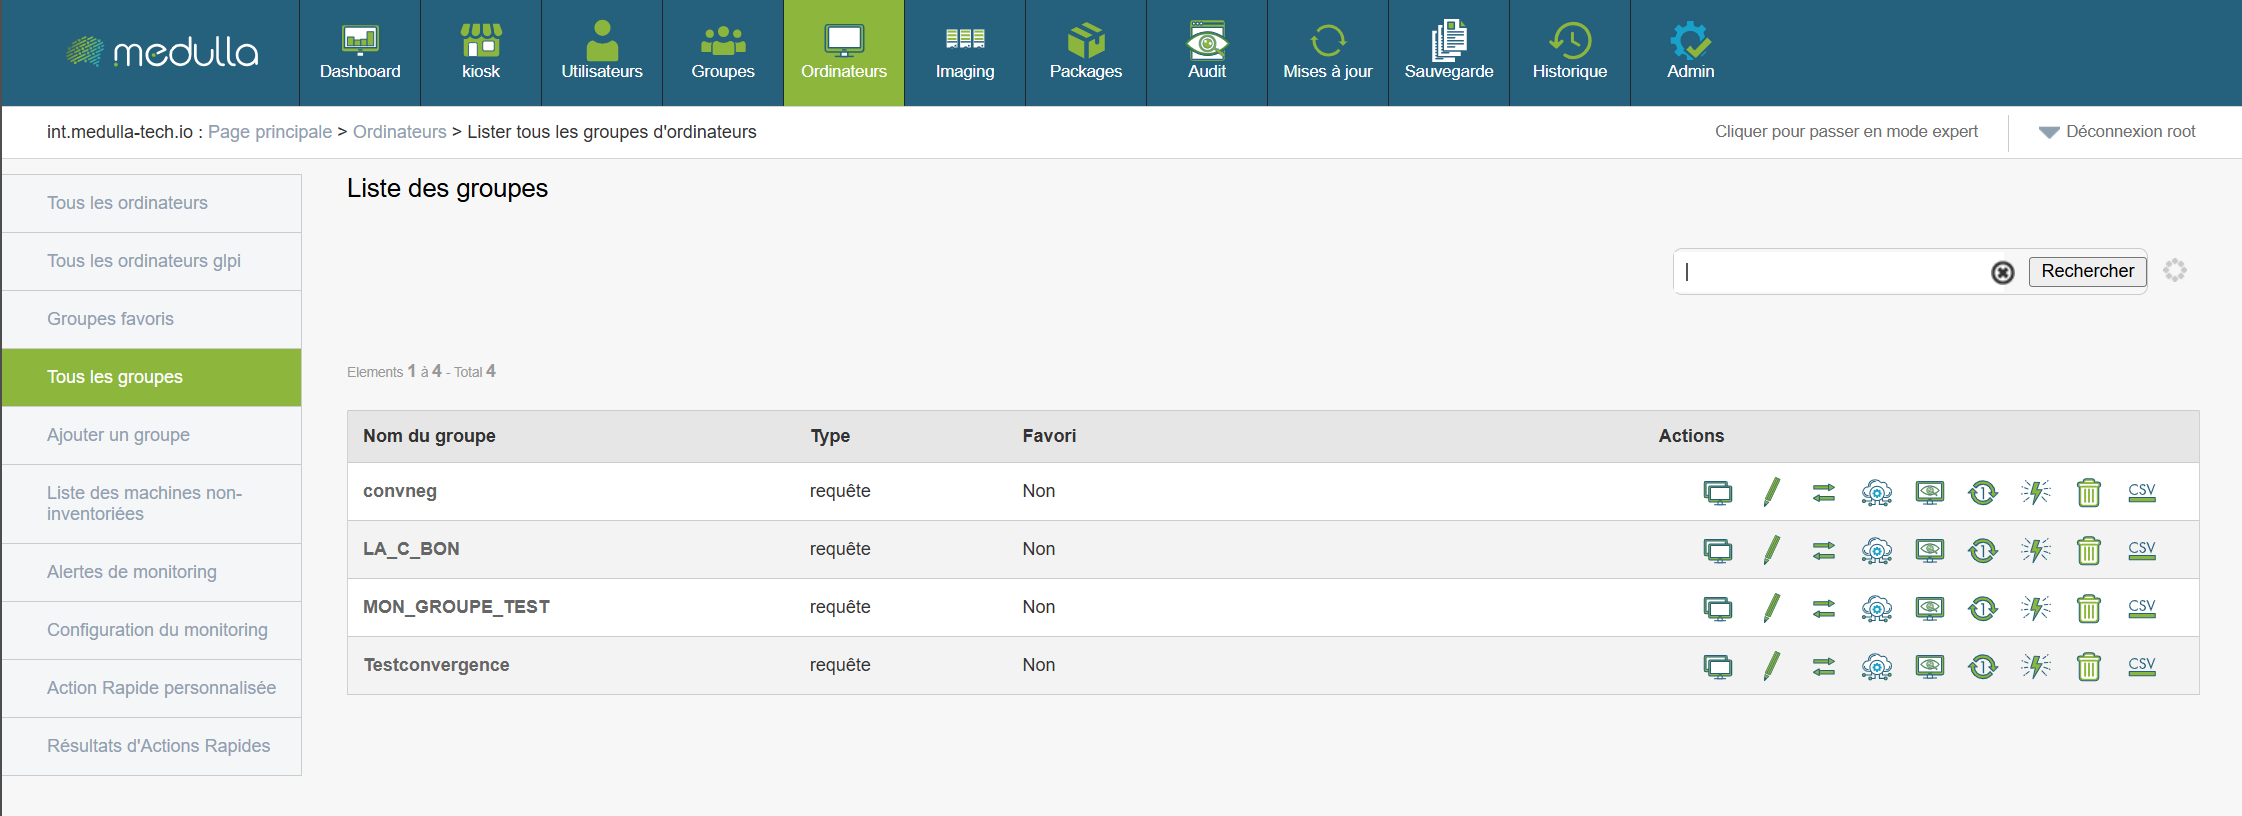
Click the Deployment button: ![]()
You will then enter the menu that allows you to select the package you want to apply negative convergence to:
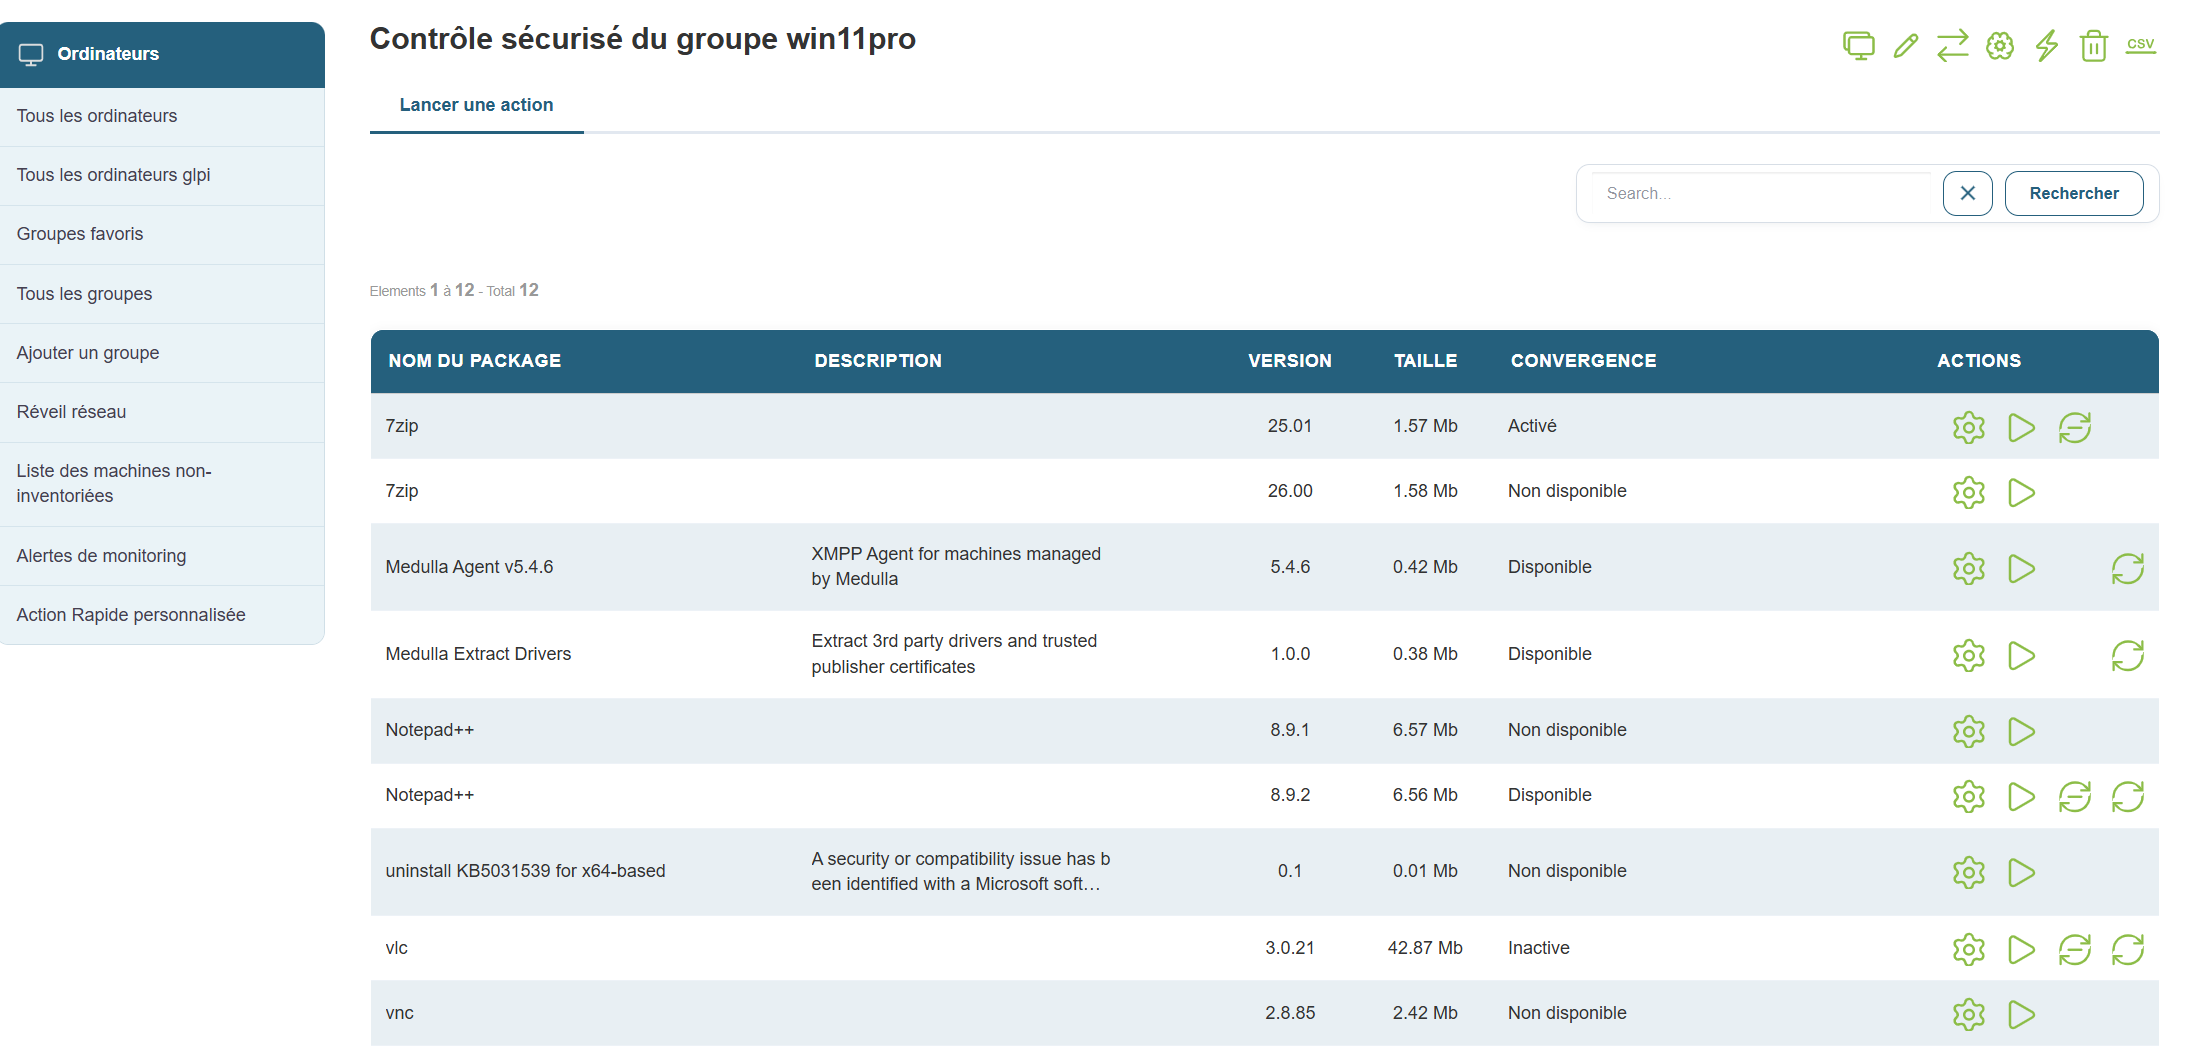
Click the Negative Convergence button ![]()
You will then enter the convergence configuration menu:
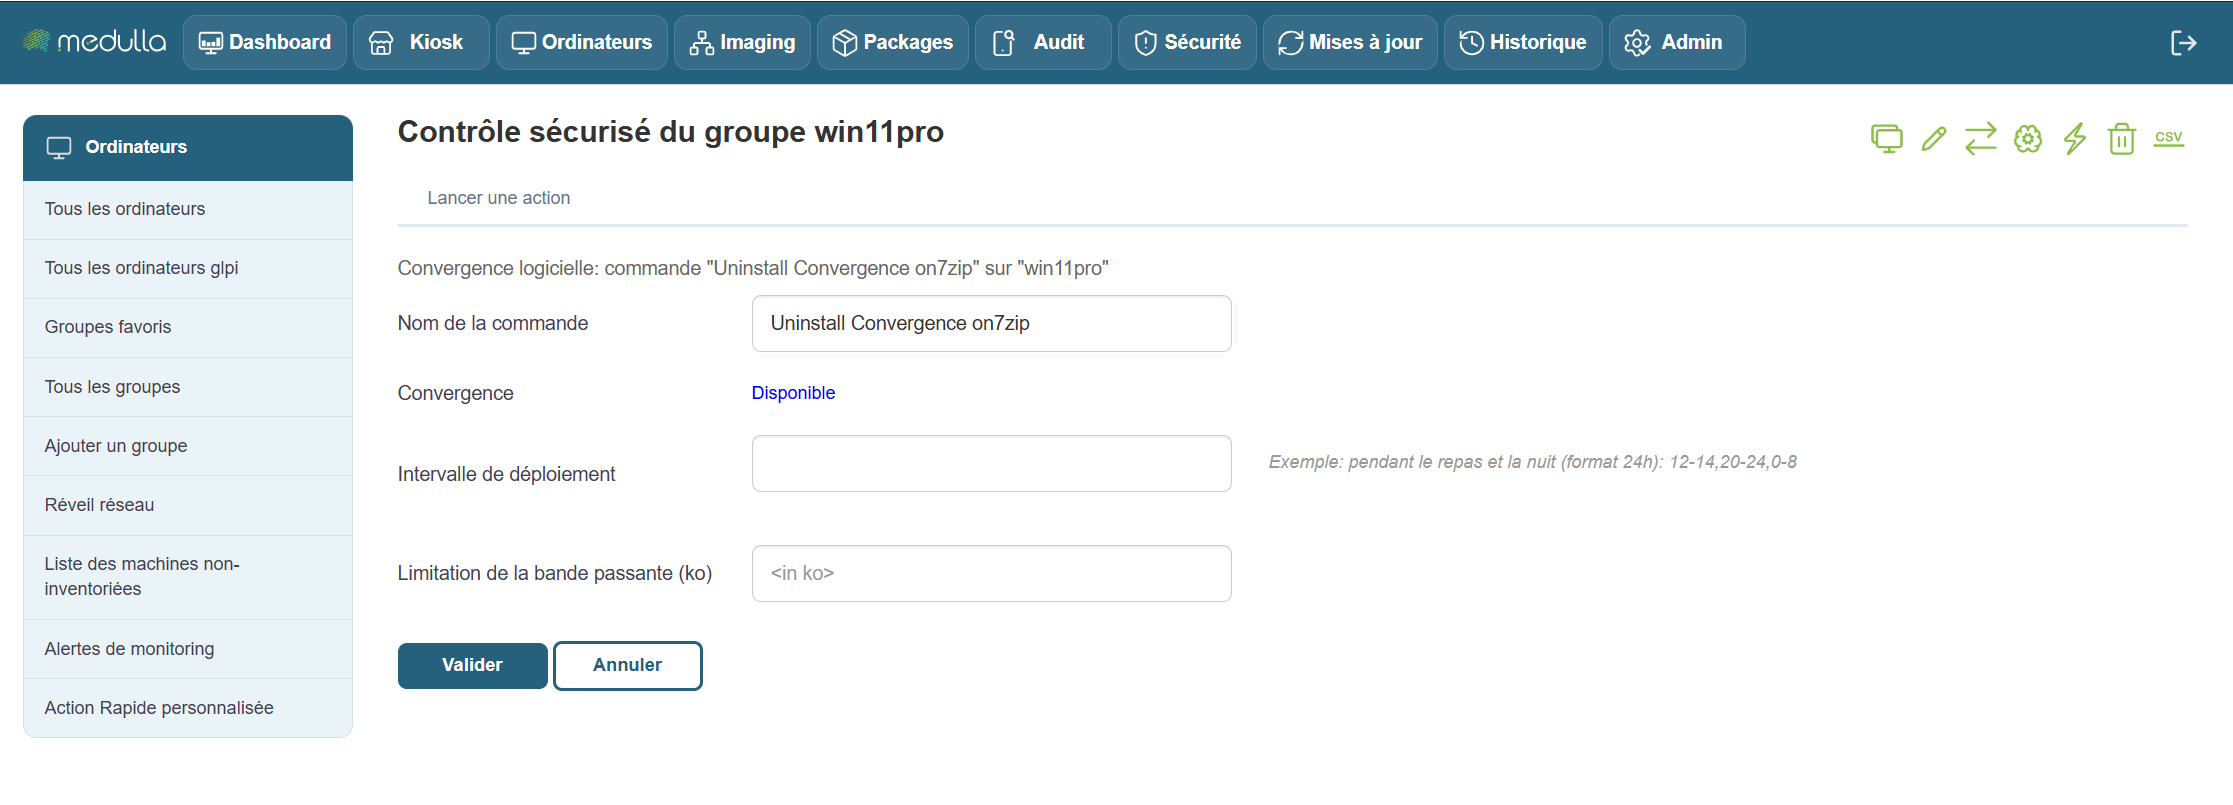
You can use the following available options:
Command name:
Deployment interval:
Then confirm, and negative convergence will be activated.
Once activated, negative convergence begins.
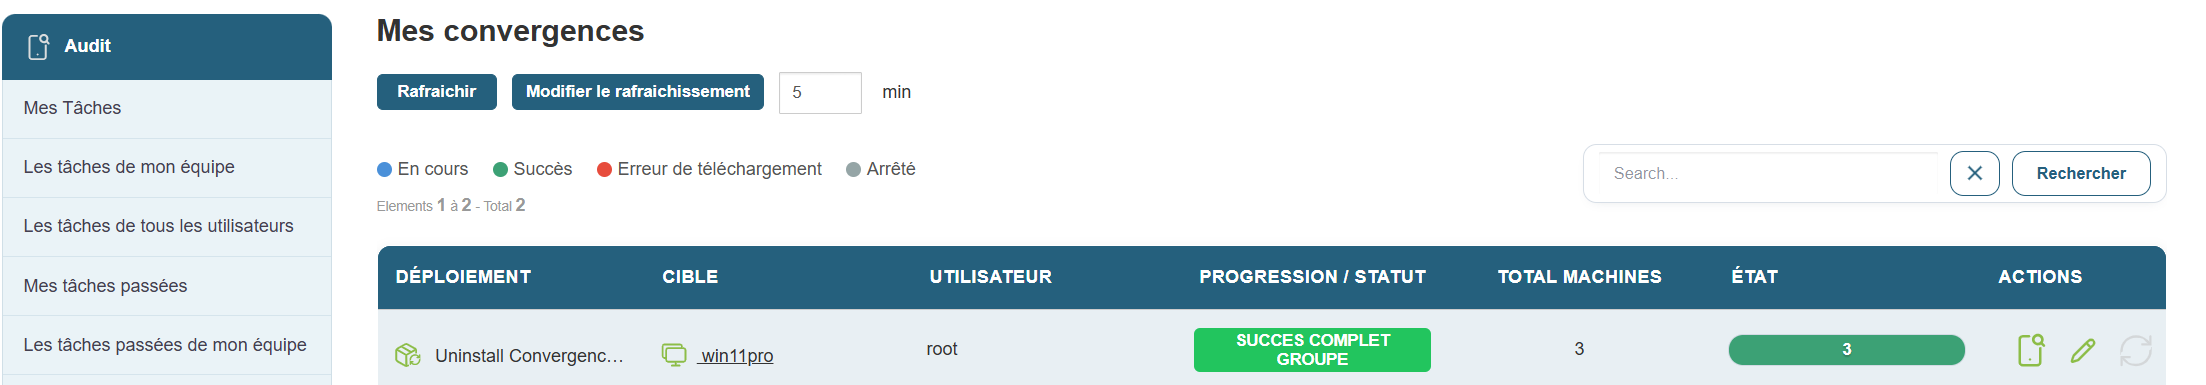
Three entries in the left-hand menu allow you to track your convergences:
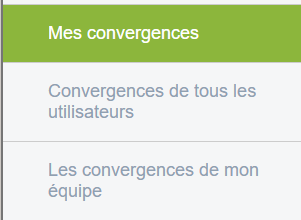
My Convergences:
Allows you to view the convergences scheduled by the current user of the session.
All Users' Convergences:
If you have administrator rights, you can view all the convergences that have been scheduled by Medulla users.
My Team's Convergences:
Allows you to view the appointments scheduled by users who are in the same group as you.
Software deployment
Once you have created a package in Medulla (doc: Create a package), you can deploy it to any computer.
Go to the Computer > Deployment view (quick action) ![]() OR, on a computer group, Deployment (quick action).
OR, on a computer group, Deployment (quick action).
The list of packages available for deployment is displayed, along with a " ![]() " button to start deploying the package:
" button to start deploying the package:

The deployment will start immediately and be available in the Audit view: Audit
The " ![]() " button allows you to customize the deployment launch:
" button allows you to customize the deployment launch:
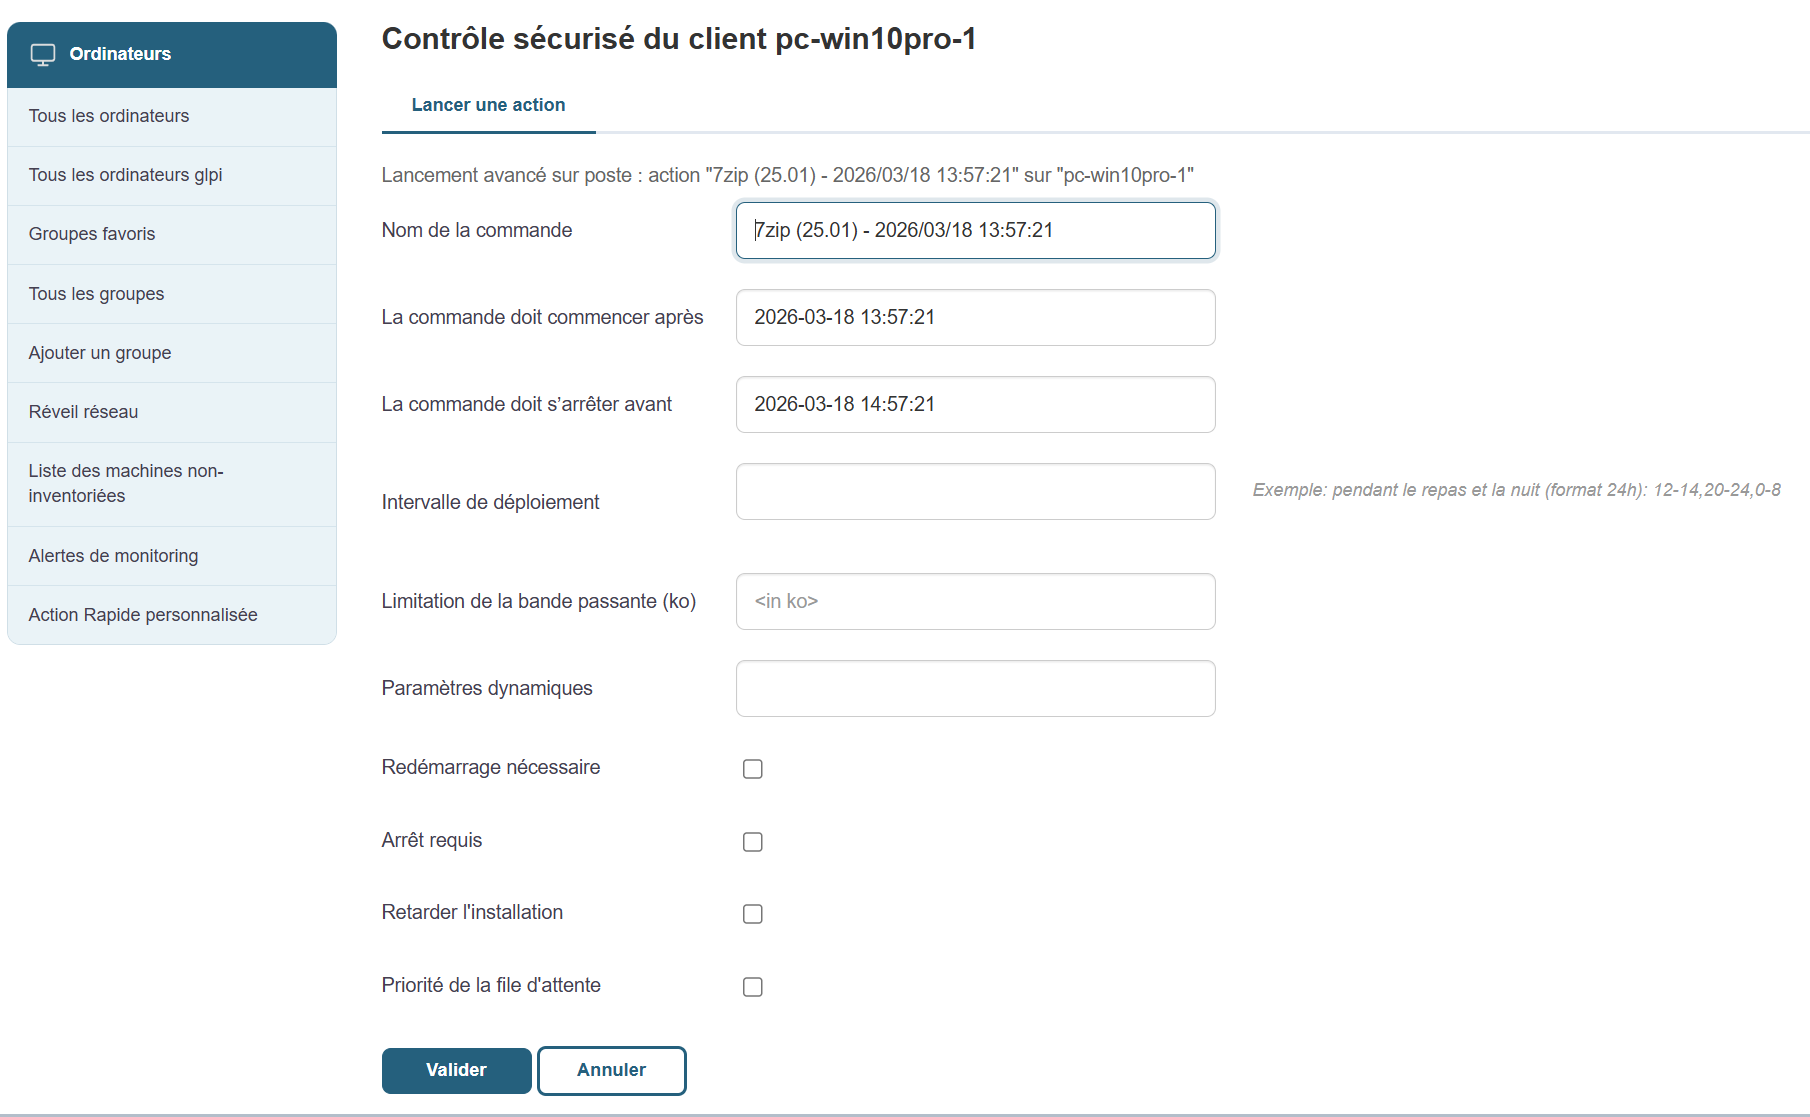
To launch a positive convergence, go here: Positive Convergence
To launch a negative convergence, go here: Negative convergence
Create a package
In the Packages view, click Add Package in the left-hand menu.
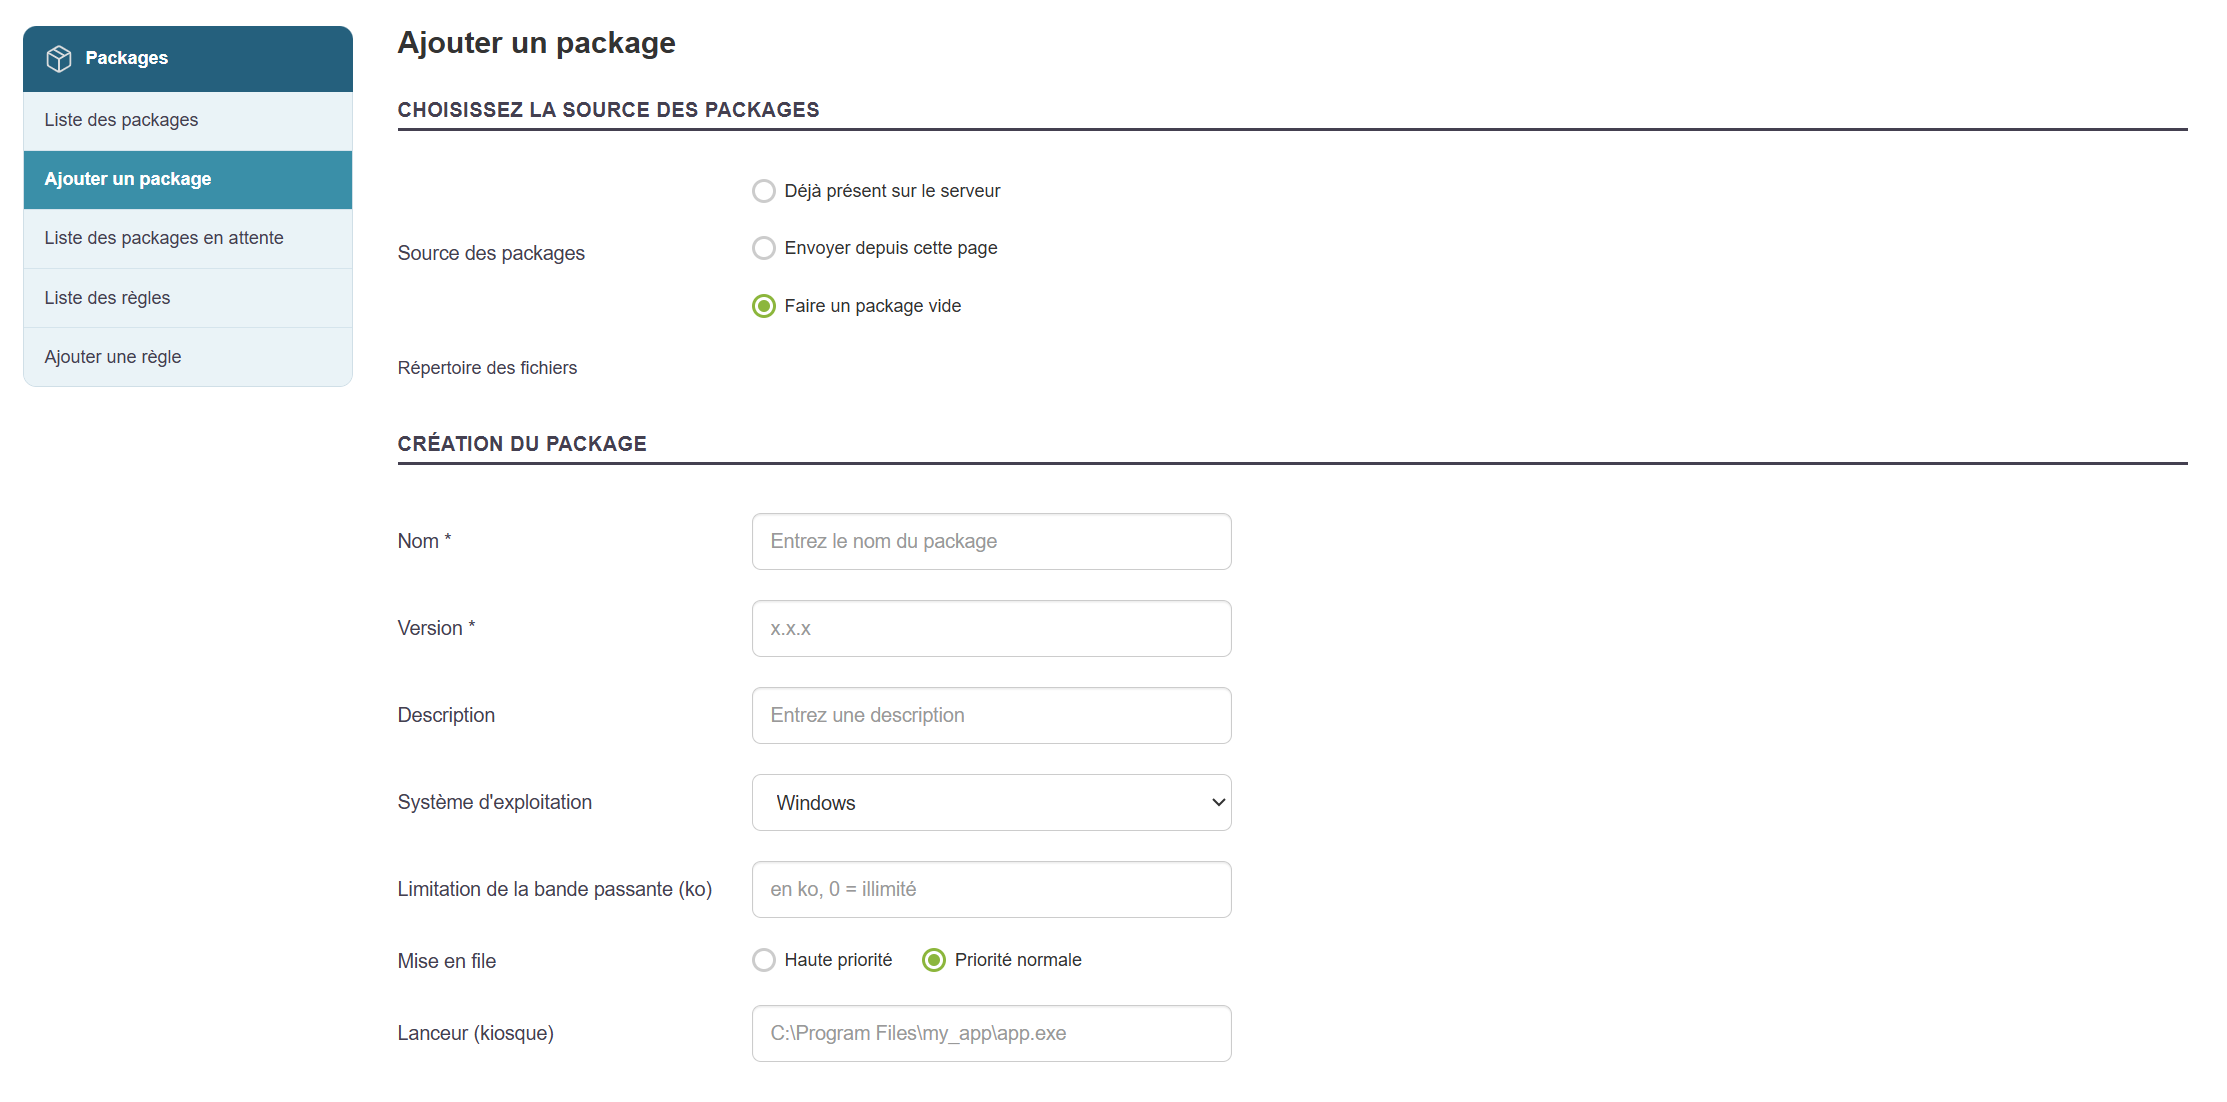
You may or may not assign an installation (setup) file, and click "Upload pending files" if necessary.
Fill out the various sections.
You can add other packages as dependencies.
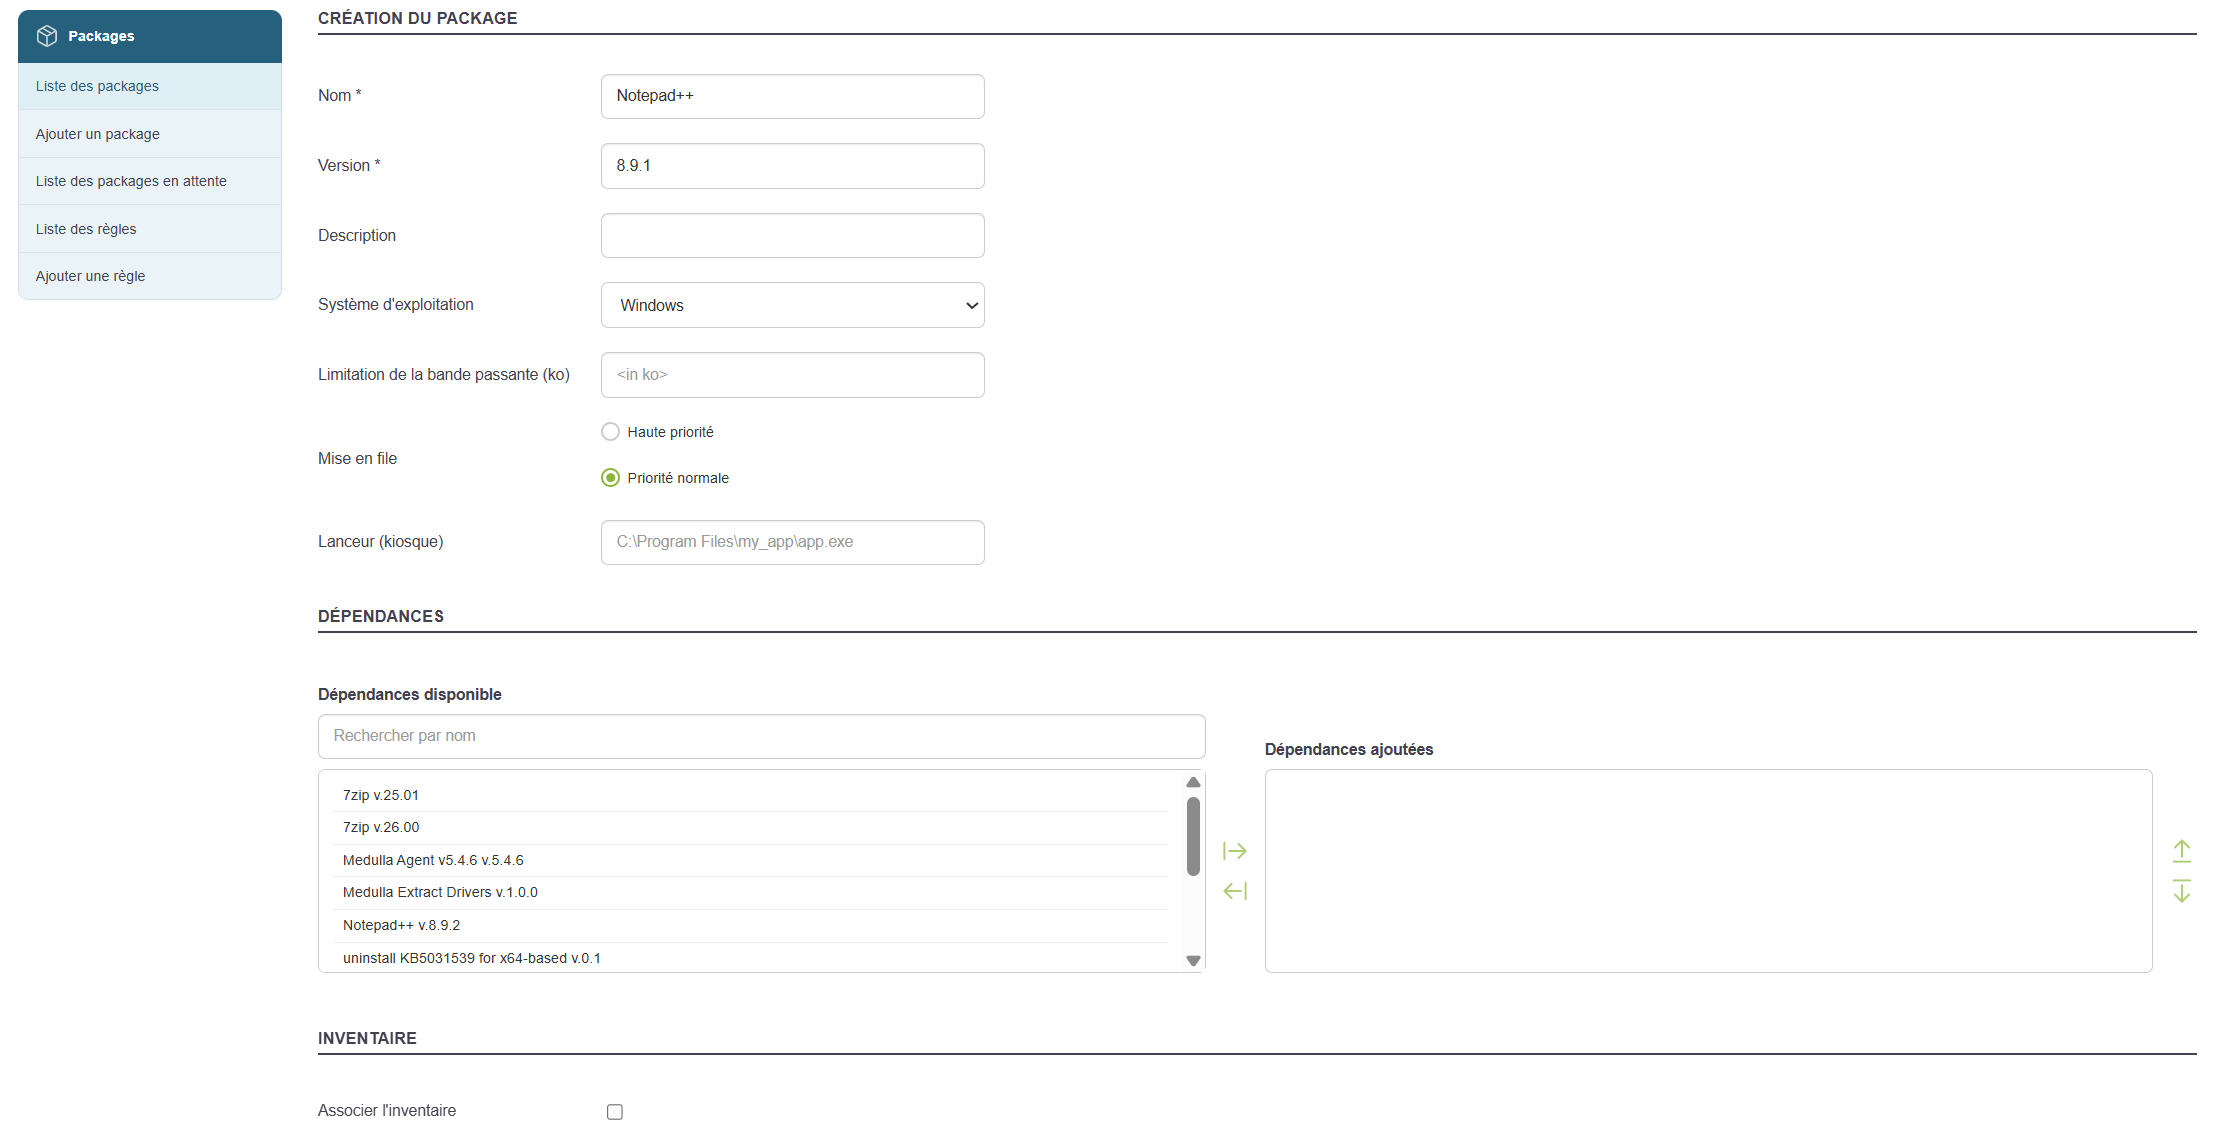
In the example above, I will enter the value for Launcher (Kiosk): "C:\Program Files\Notepad++\Notepad++.exe", if my package is intended for the Kiosk and to be installed in the default location "C:\Program Files\Notepad++\".
An auto-generated script allows you to silently run the installer file added earlier.
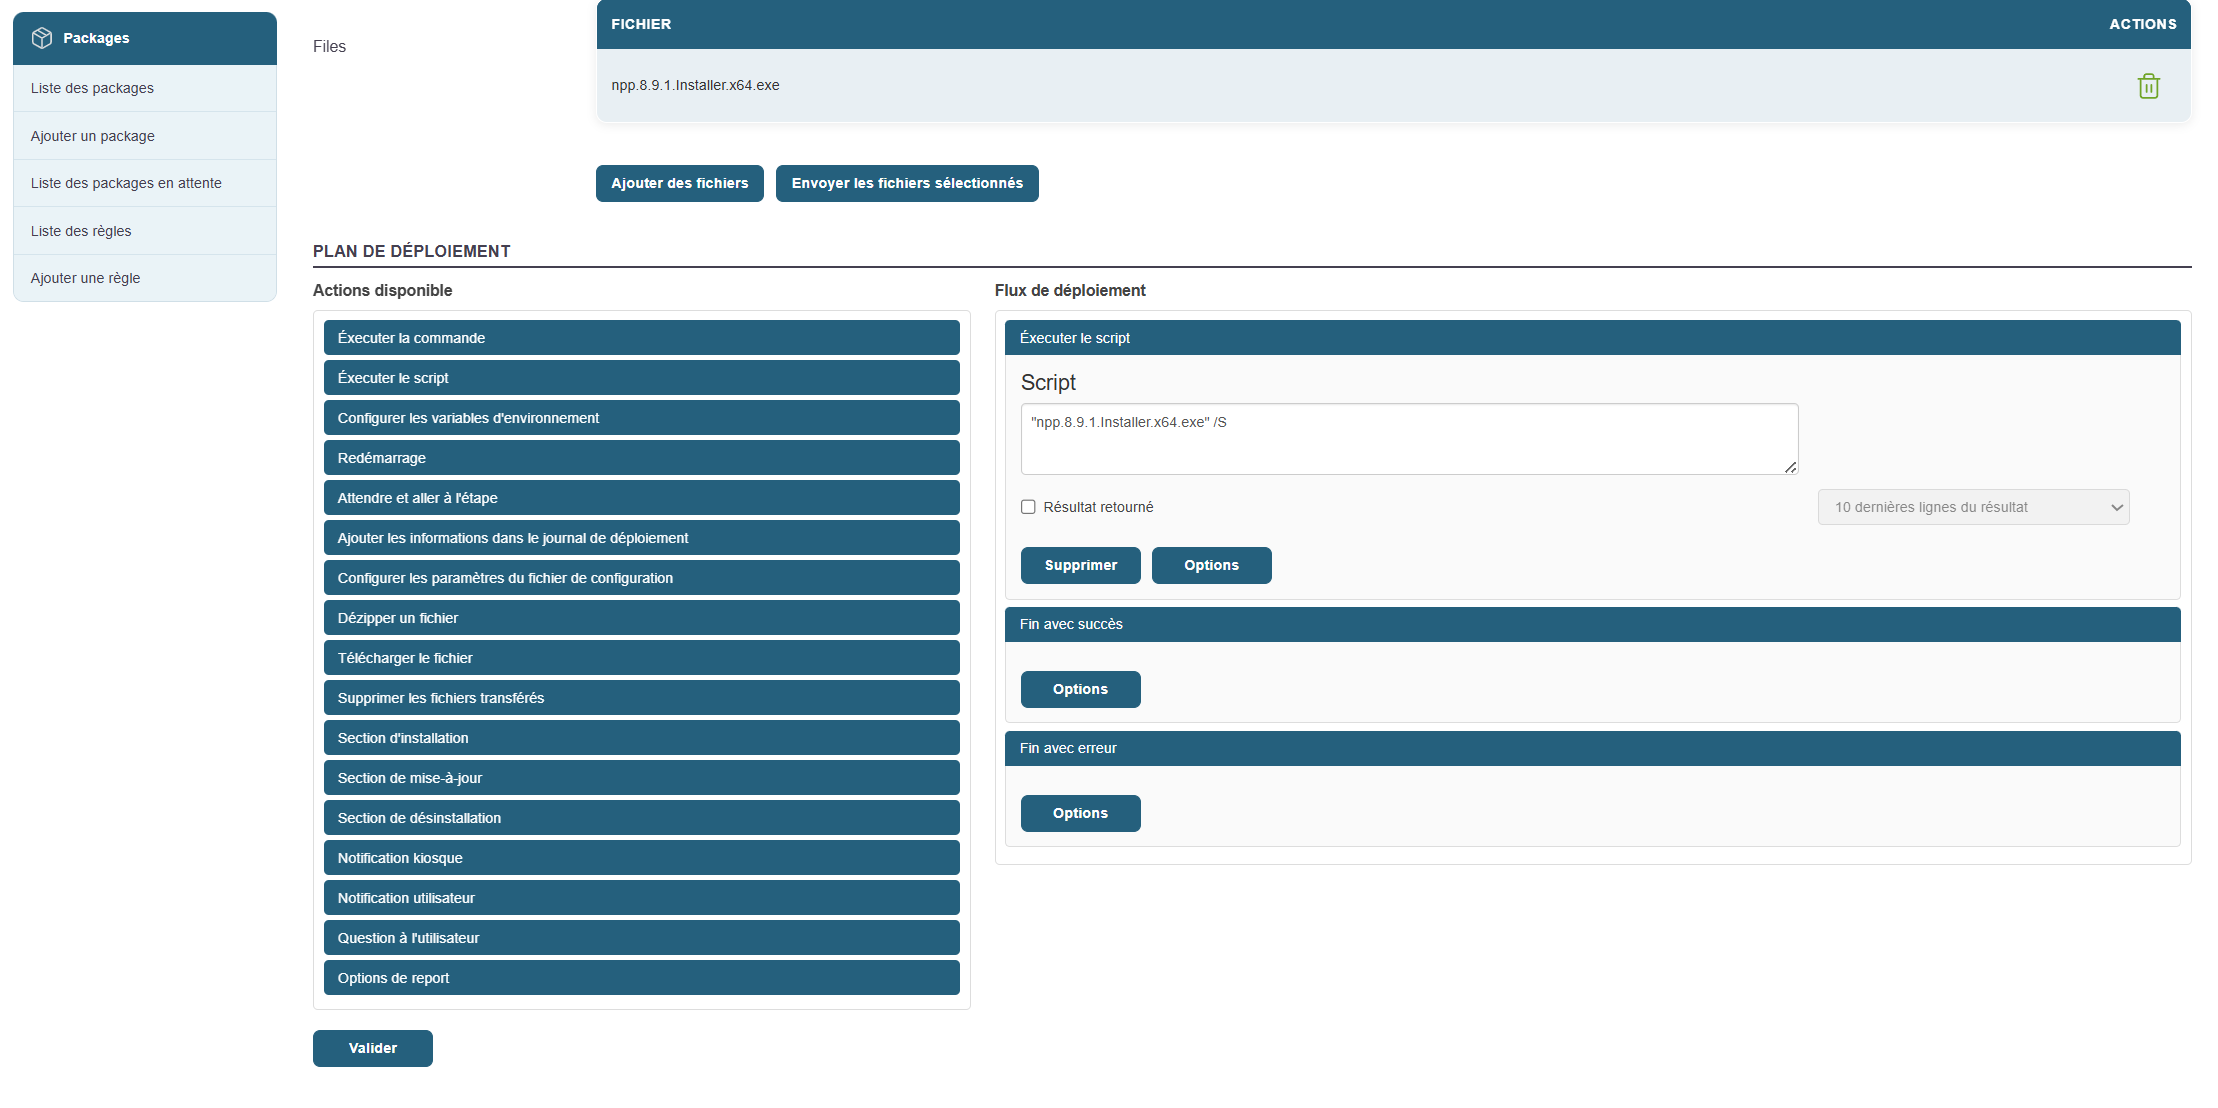
You can associate an inventory with the package using the "Associate Inventory" button, which will make it available in both Kiosk and Convergence.
Fill out the relevant section as follows (auto-completion will appear if other machines in your IT infrastructure have reported this software in their inventory):
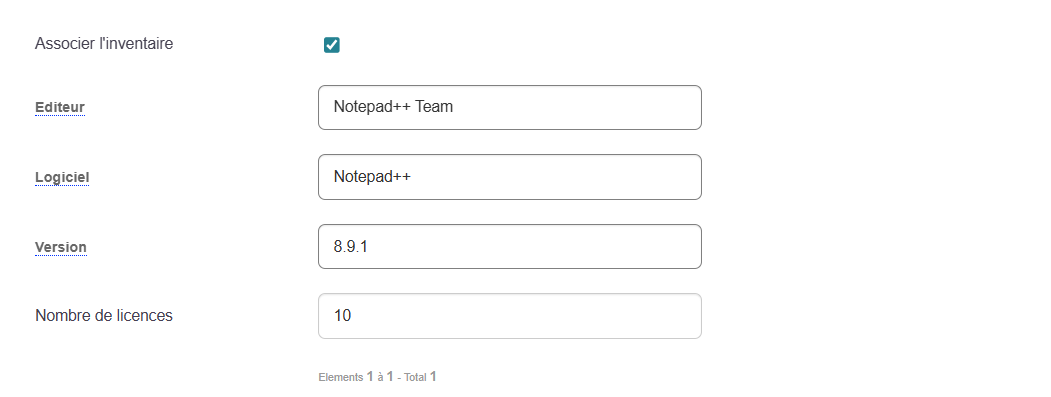
To perform a negative convergence with this package, or to make the package uninstall available via the Kiosk, you must perform the following actions:
- You can add uninstallation sections as follows if you want to be able to uninstall the application in the solution from the Kiosk.
- Add an uninstallation section in the left-hand menu.
- Then add a command and set the uninstall command.
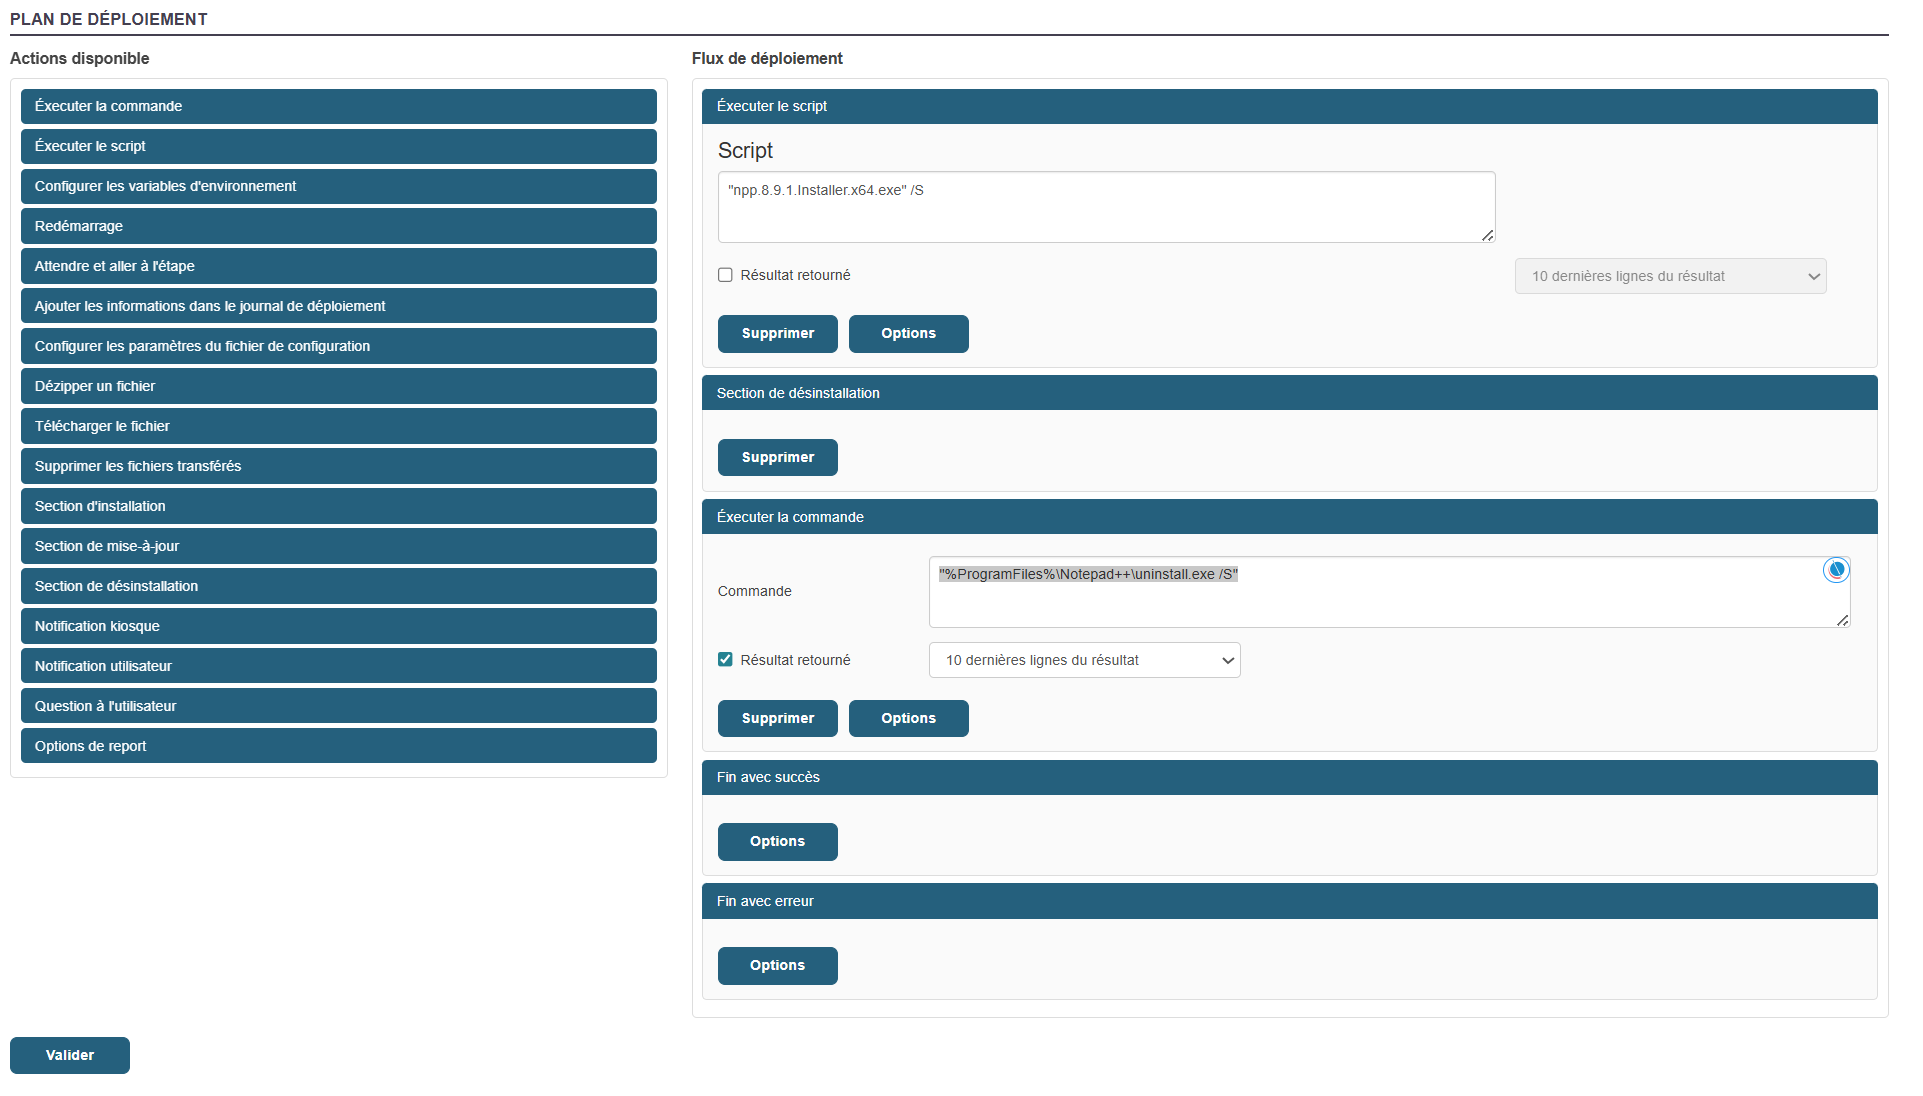
Many actions are possible within a package’s workflow.
Click "Validate".
The package is ready
Kiosk:
To add my application to the kiosk profiles and create a profile, click on this section of the documentation: Chapter 3: Kiosk
Convergence:
To deploy my package via Convergence, here is the Convergence deployment section: Convergence
Mastering via PXE
To master an image, follow the steps below:
- Boot the machine via PXE and register it:
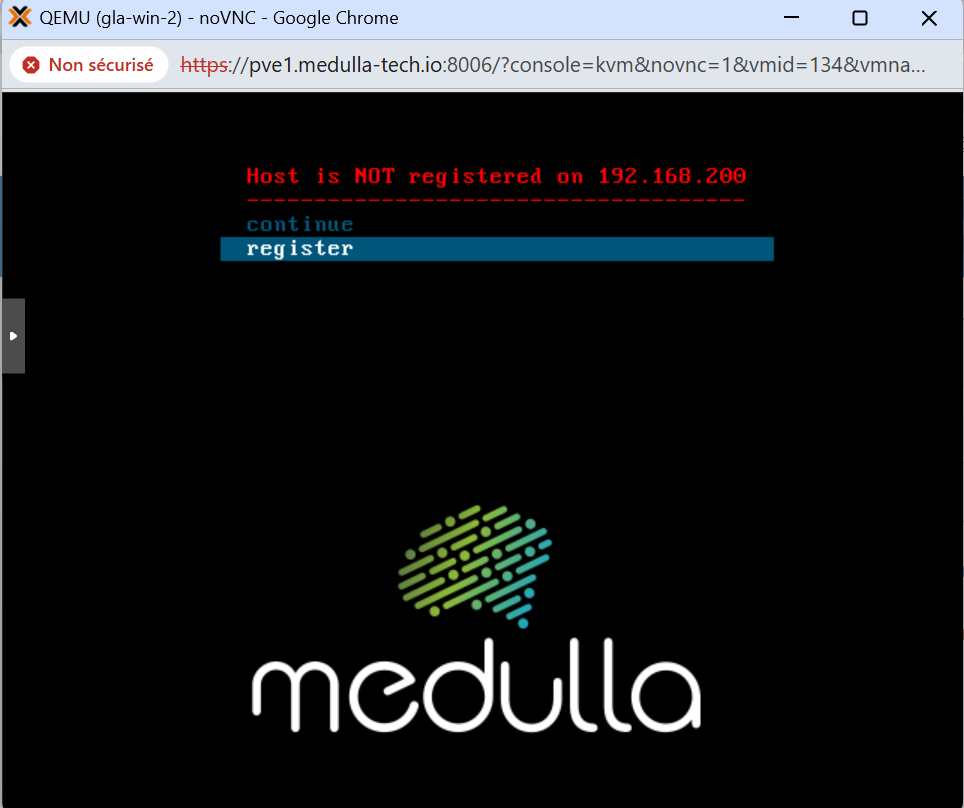
Type the machine name at the prompt:
In our example, I used the machine gla-win-2. Press Enter, then answer the question with Y if the name is correct or N if it is incorrect and you need to make changes.
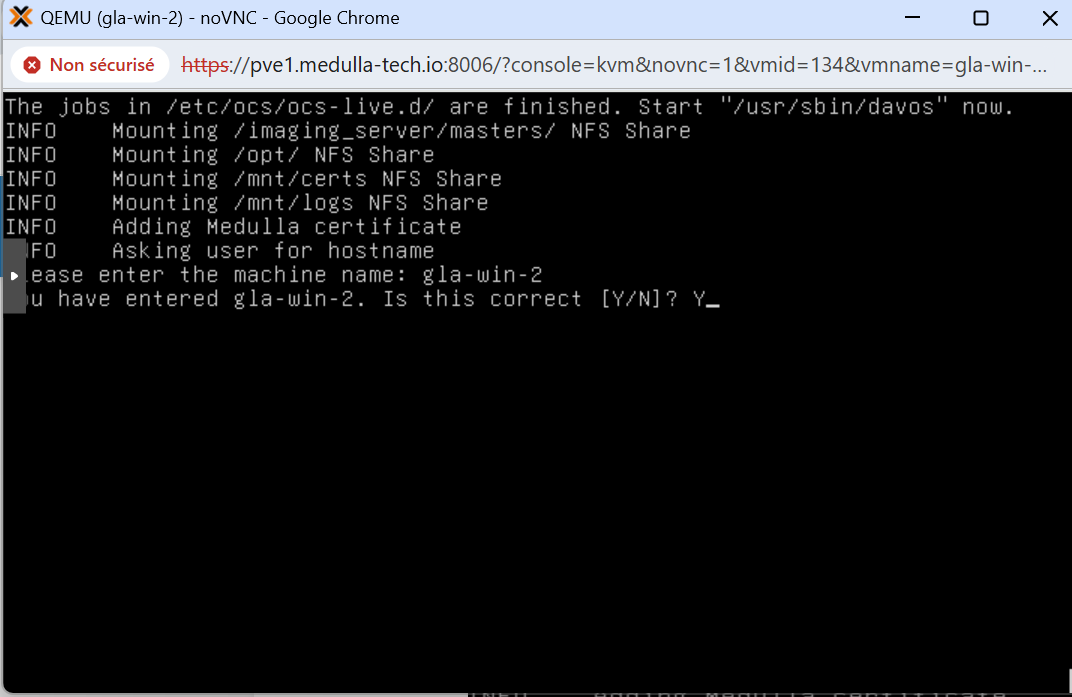
When the machine reboots, if you followed the steps in Imaging Profiles, simply select the master associated with the profile; or if you are using a standard post-install, you will see the master’s name along with the associated post-install.
Below, after the machine has been registered, you’ll see the menu with an additional line:
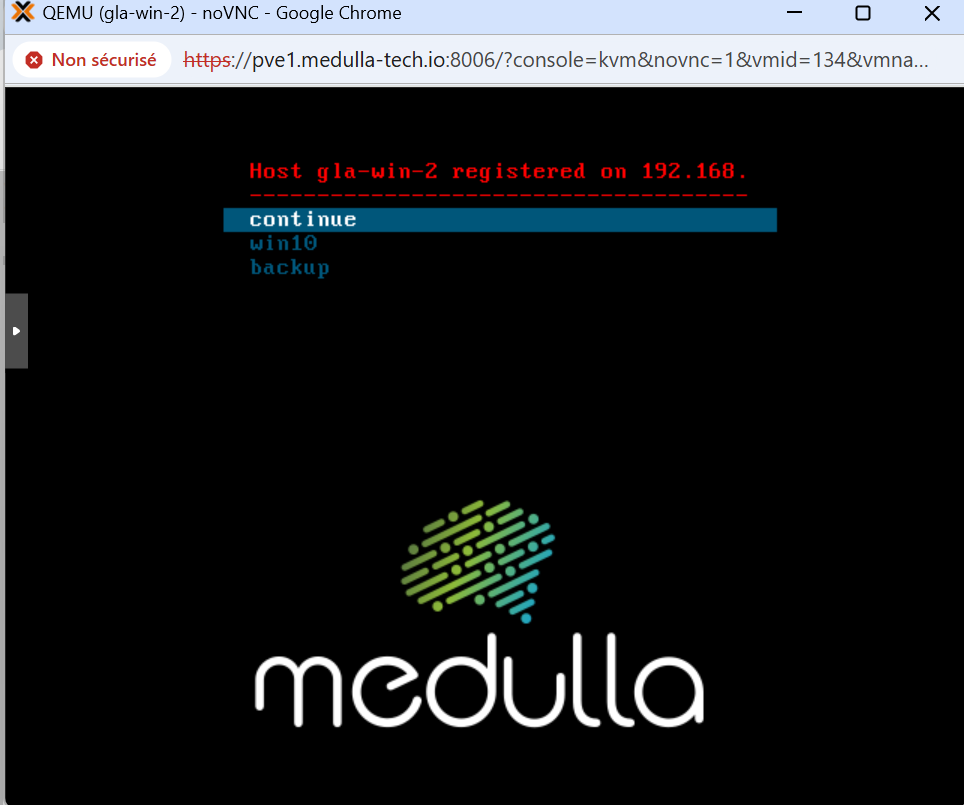
Click on your master and wait a few minutes; your machine will reboot and come back up in the Medulla console.
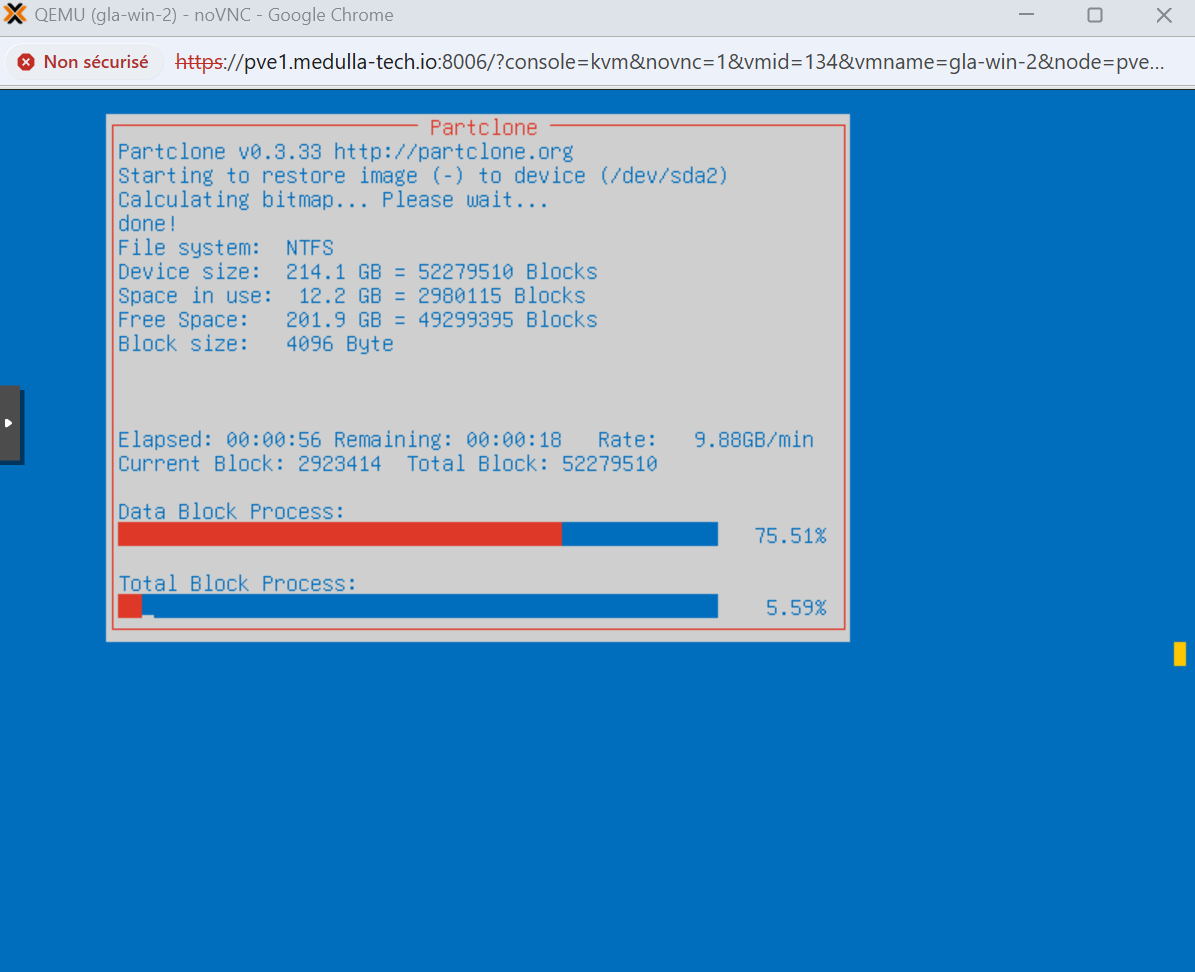
Getting Started with Remote Access
 Remote Access Direct access to machines to perform troubleshooting or maintenance tasks:
This allows you to take control of the remote machine in three possible ways:
Windows:
- CMD
- VNC
- RDP
When you click the button, a pop-up appears allowing you to choose which protocol you want to use:
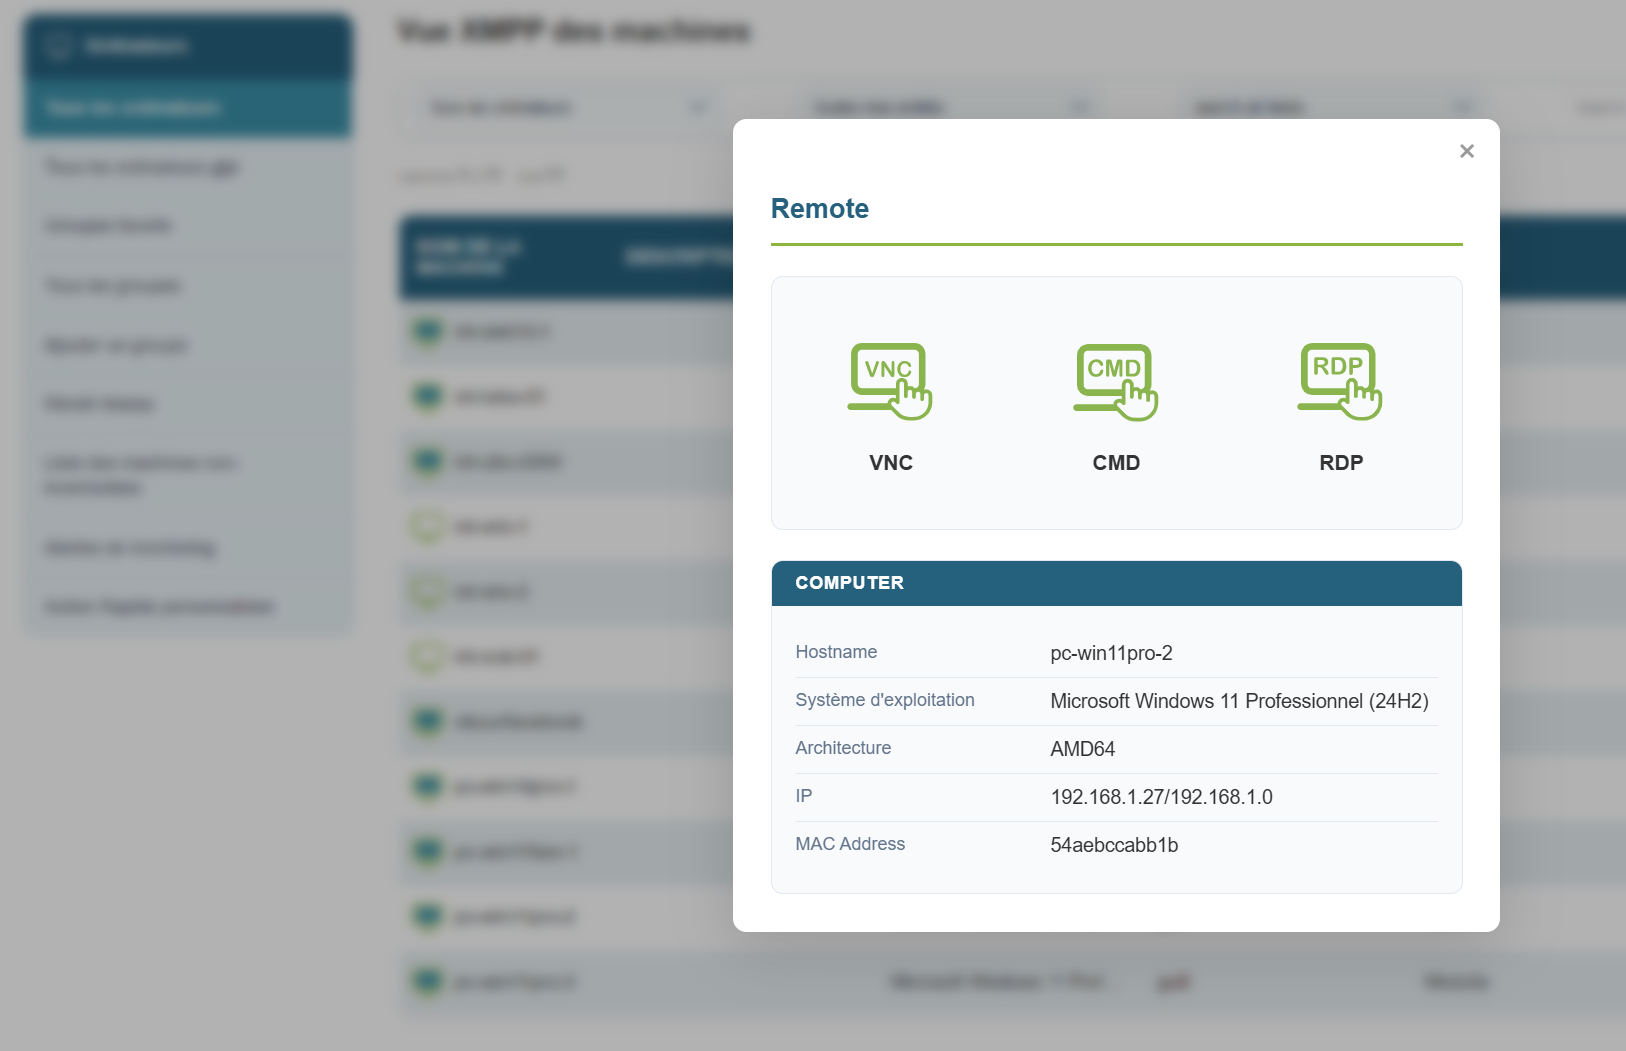
For VNC, by default, an authorization request is sent to the user, and the user must grant you permission.
If you need to temporarily disable the authorization request for a maintenance operation while the user is away from their workstation, you can do so for the duration of the session:
Click the quick action button, uncheck the " Ask user approval " box, then click the take control button.
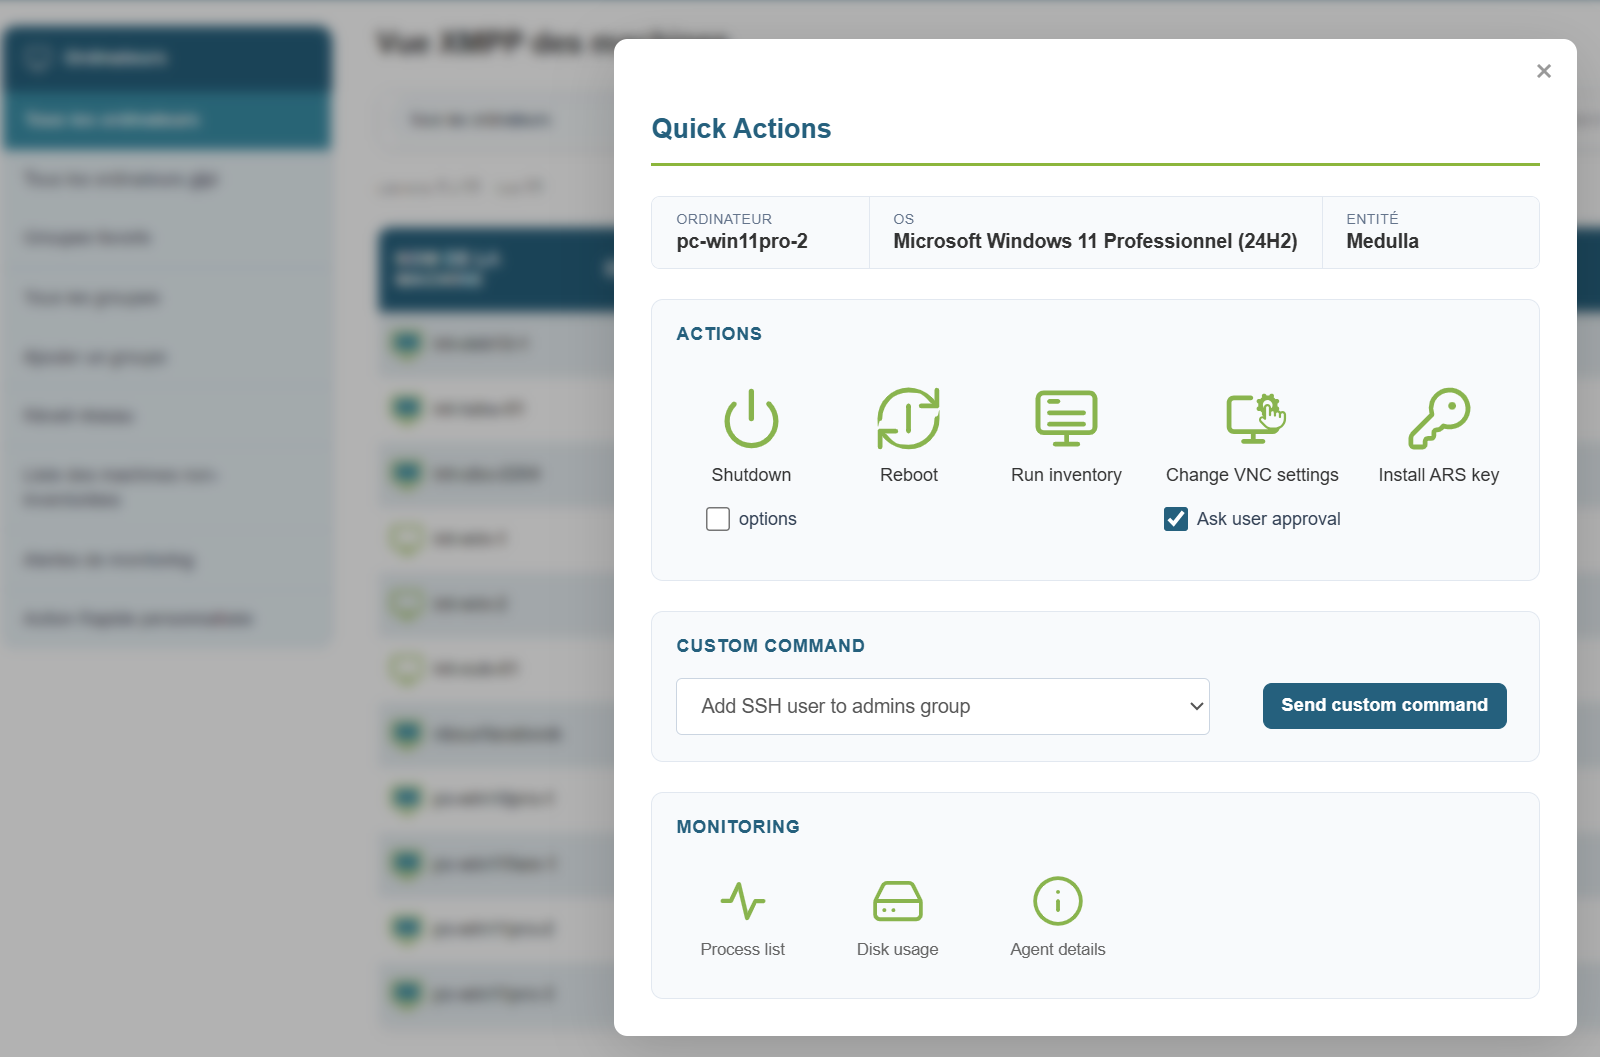
Remote access via CMD:
Remote access via VNC:
Remote access via RDP:
XMPP Console
The Medulla solution is a client/server solution based on the XMPP protocol.
This protocol allows Medulla to provide users with an XMPP console, enabling them to execute non-interactive commands directly on workstations.
This console allows for initial diagnostics or retrieving information about the workstations from the server.
How to do it:
Click on the console icon: ![]()
The following screen appears:
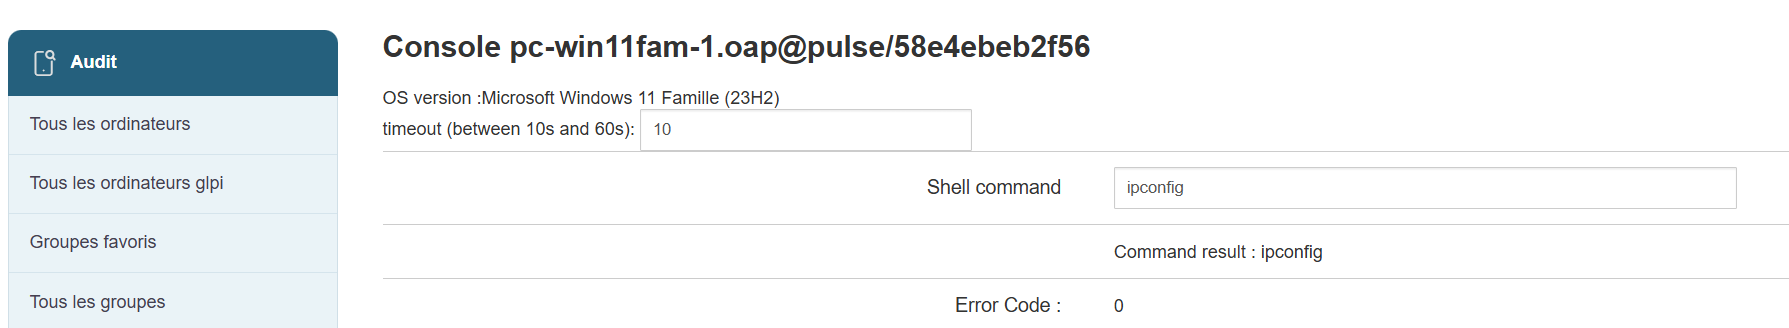
Type your command and get the result instantly:
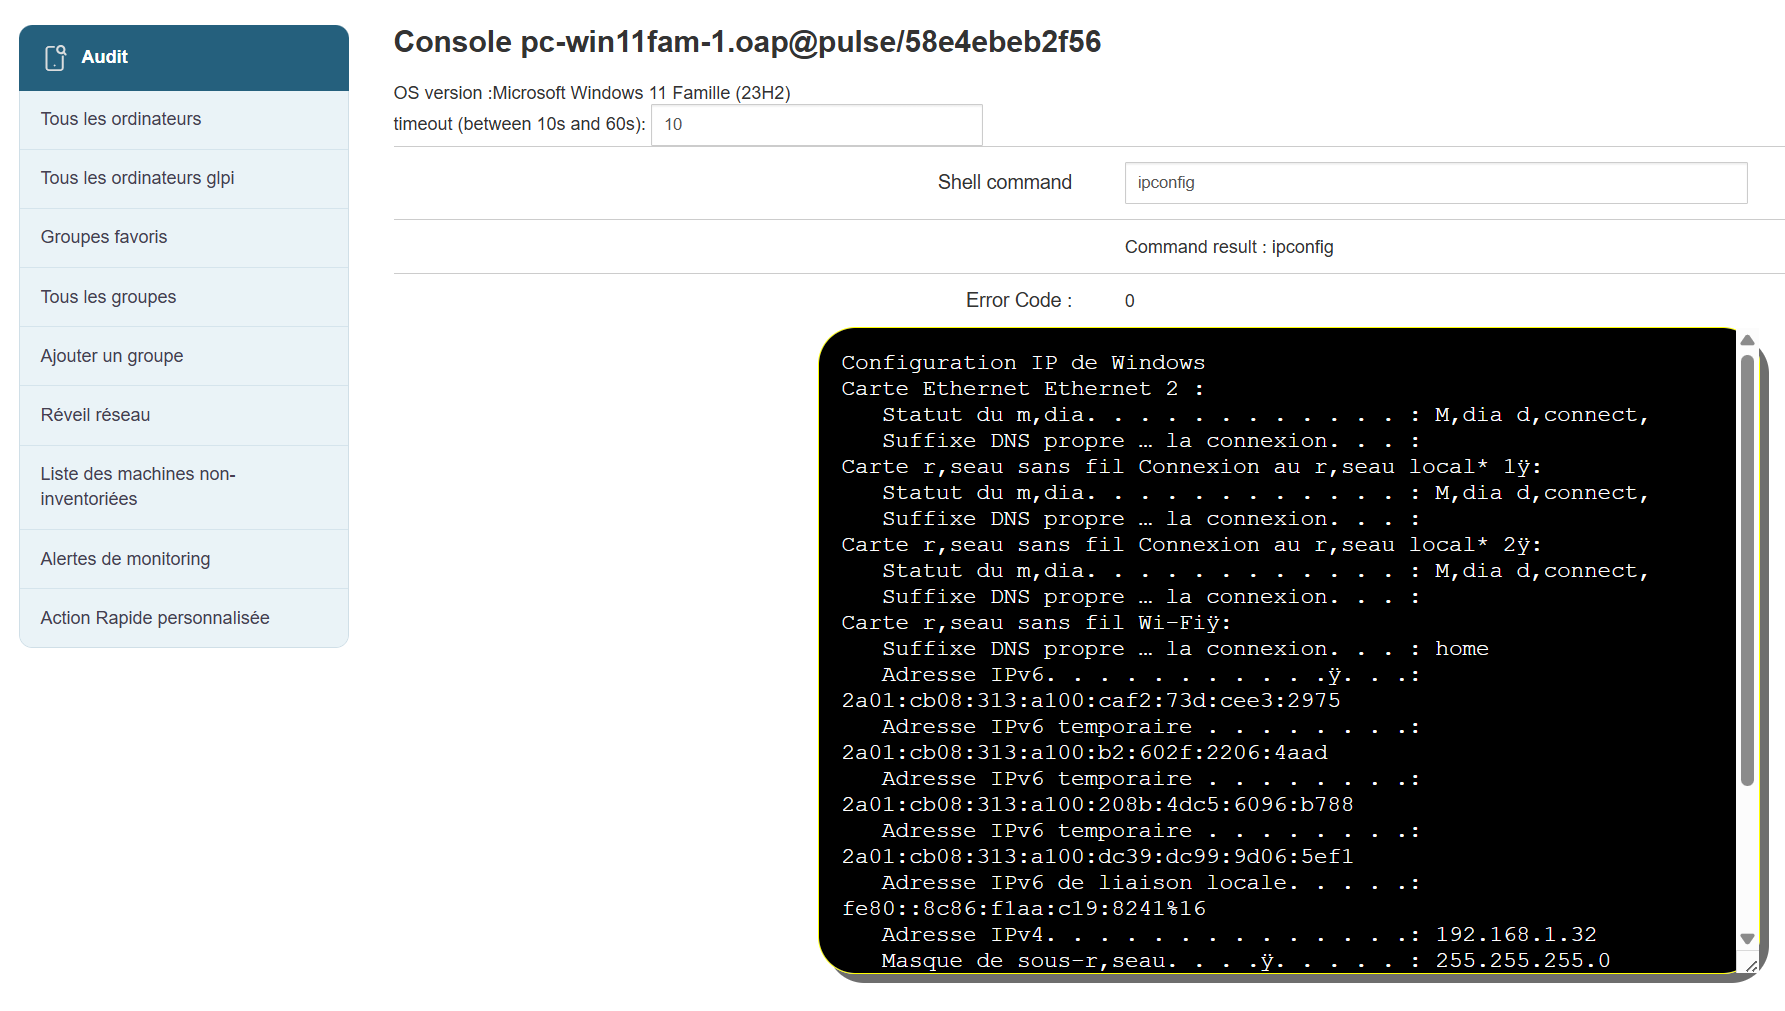
Agent inventory
To view a machine's inventory, go to the Computer view.
Select the computer whose inventory you wish to view, then in the Actions menu to the right of the row, click the button: ![]()
You will then see a tabbed panel displaying the complete inventory of a machine:
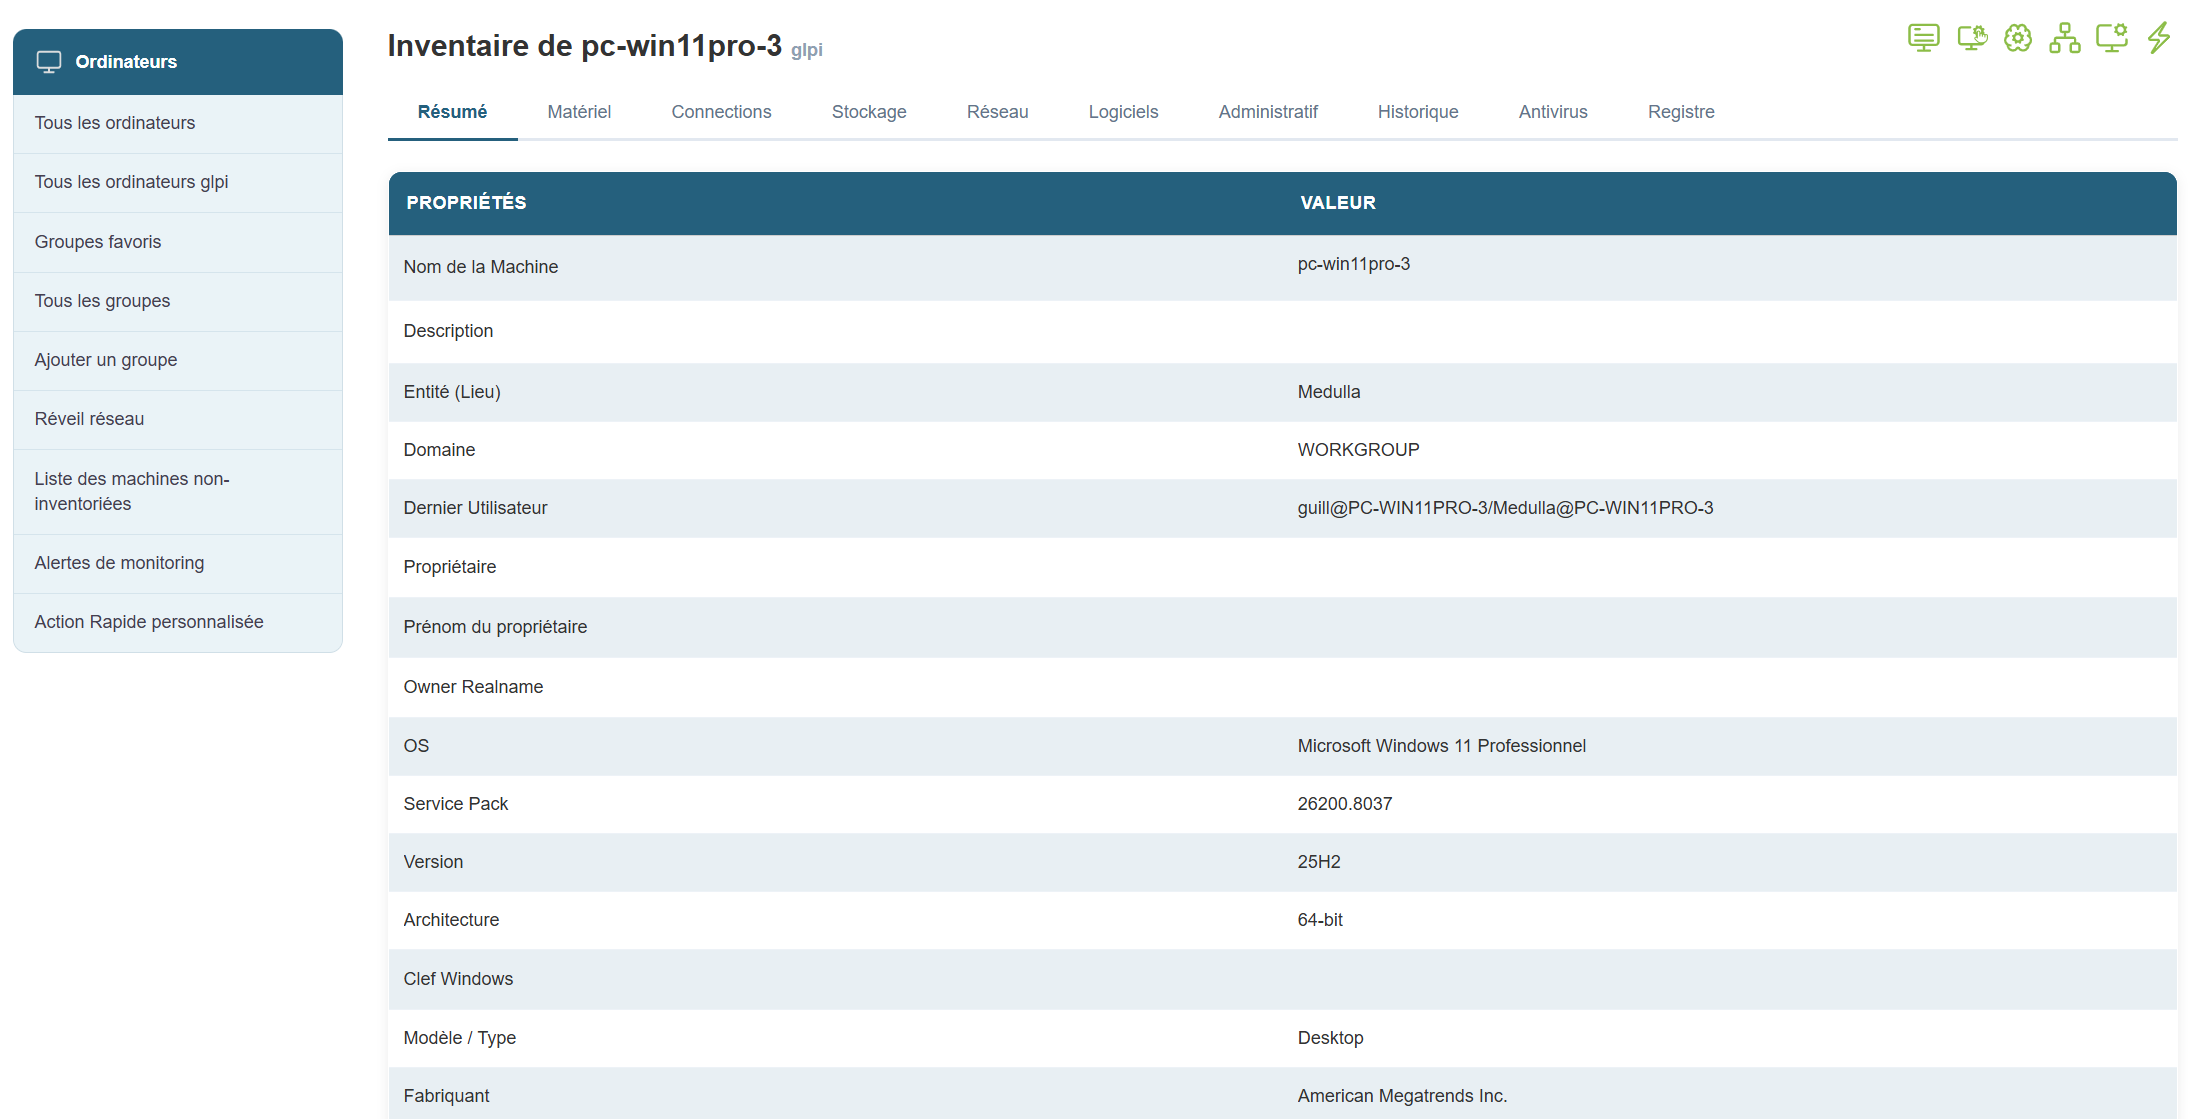
Imaging menus
Applies to: Medulla – Imaging
Version:5.4.3 or later
Environment: On-Premise / Private SaaS with imaging relay.
Category: Usage
This document focuses on the management and generation of imaging menus.
What is an imaging menu?
- The machine has no associated menu: the server assigns it a default menu
- The machine is part of a group of machines: the server sends it the menu associated with that group.
- The machine is not part of a group and has an associated menu: the server sends it that menu.
The rest of the imaging process depends on the contents of this menu.
There are different levels of menus:
The imaging server menus:
Each imaging server receives a default menu. This menu consists of the following services:
- `continue`: This service allows you to boot the machine normally.
- `backup`: creates a copy of the machine's disk in the imaging system.
- Modifications
Changes to the default menu do not affect the menus of machines or groups. For machines to benefit from changes to the default menu, it is necessary to perform a "reset" of the entity's menus.
- Add / Remove a Service
Several services that can be added to the menu are available.
The page defining the services available in a menu is as follows:
MMC > Imaging > Manage Menu Services.
On this page, services are associated with the selected entity. Changing the entity modifies the list of services associated with that entity.
- Add / Remove a Master
This section does not cover how to convert an image into a master.
Masters present on the imaging server can be associated with the default menu.
The page for associating masters with the default menu is as follows:
MMC > Imaging > Manage Masters.
- Change the order of services and masters
The various services and masters associated with the default menu can be viewed on the following page:
MMC > Imaging > Default Startup Menu.
On this page, you can change the order of menu items. You can also modify settings specific to the associated items.
- Minimum services for a menu
Currently, a menu must contain at least one service (or one image). Generally, the `continue` service is required for the menu to function.
The minimum service must have the following options enabled:
- Default enabled so that this service is selected by default
- Visible enabled so that this service is visible in the startup menu
- Default WOL enabled to prevent a traceback, even though I don’t know what this option is for.
A fix is being considered to prevent the removal of the last service from a menu.
This page is organized into three tabs:
- Startup Menu: This tab allows you to view and edit the menu.
- Menu Services: This tab allows you to associate services with the machine menu.
- Images and Masters: This tab allows you to associate masters with the machine menu.
To access it, go to the following page:
MMC > Imaging > All Imaging Groups > action:Imaging Management.
In this case, the machine displays its own custom menu, not the group’s menu. This can cause confusion for the administrator.