Dashboard
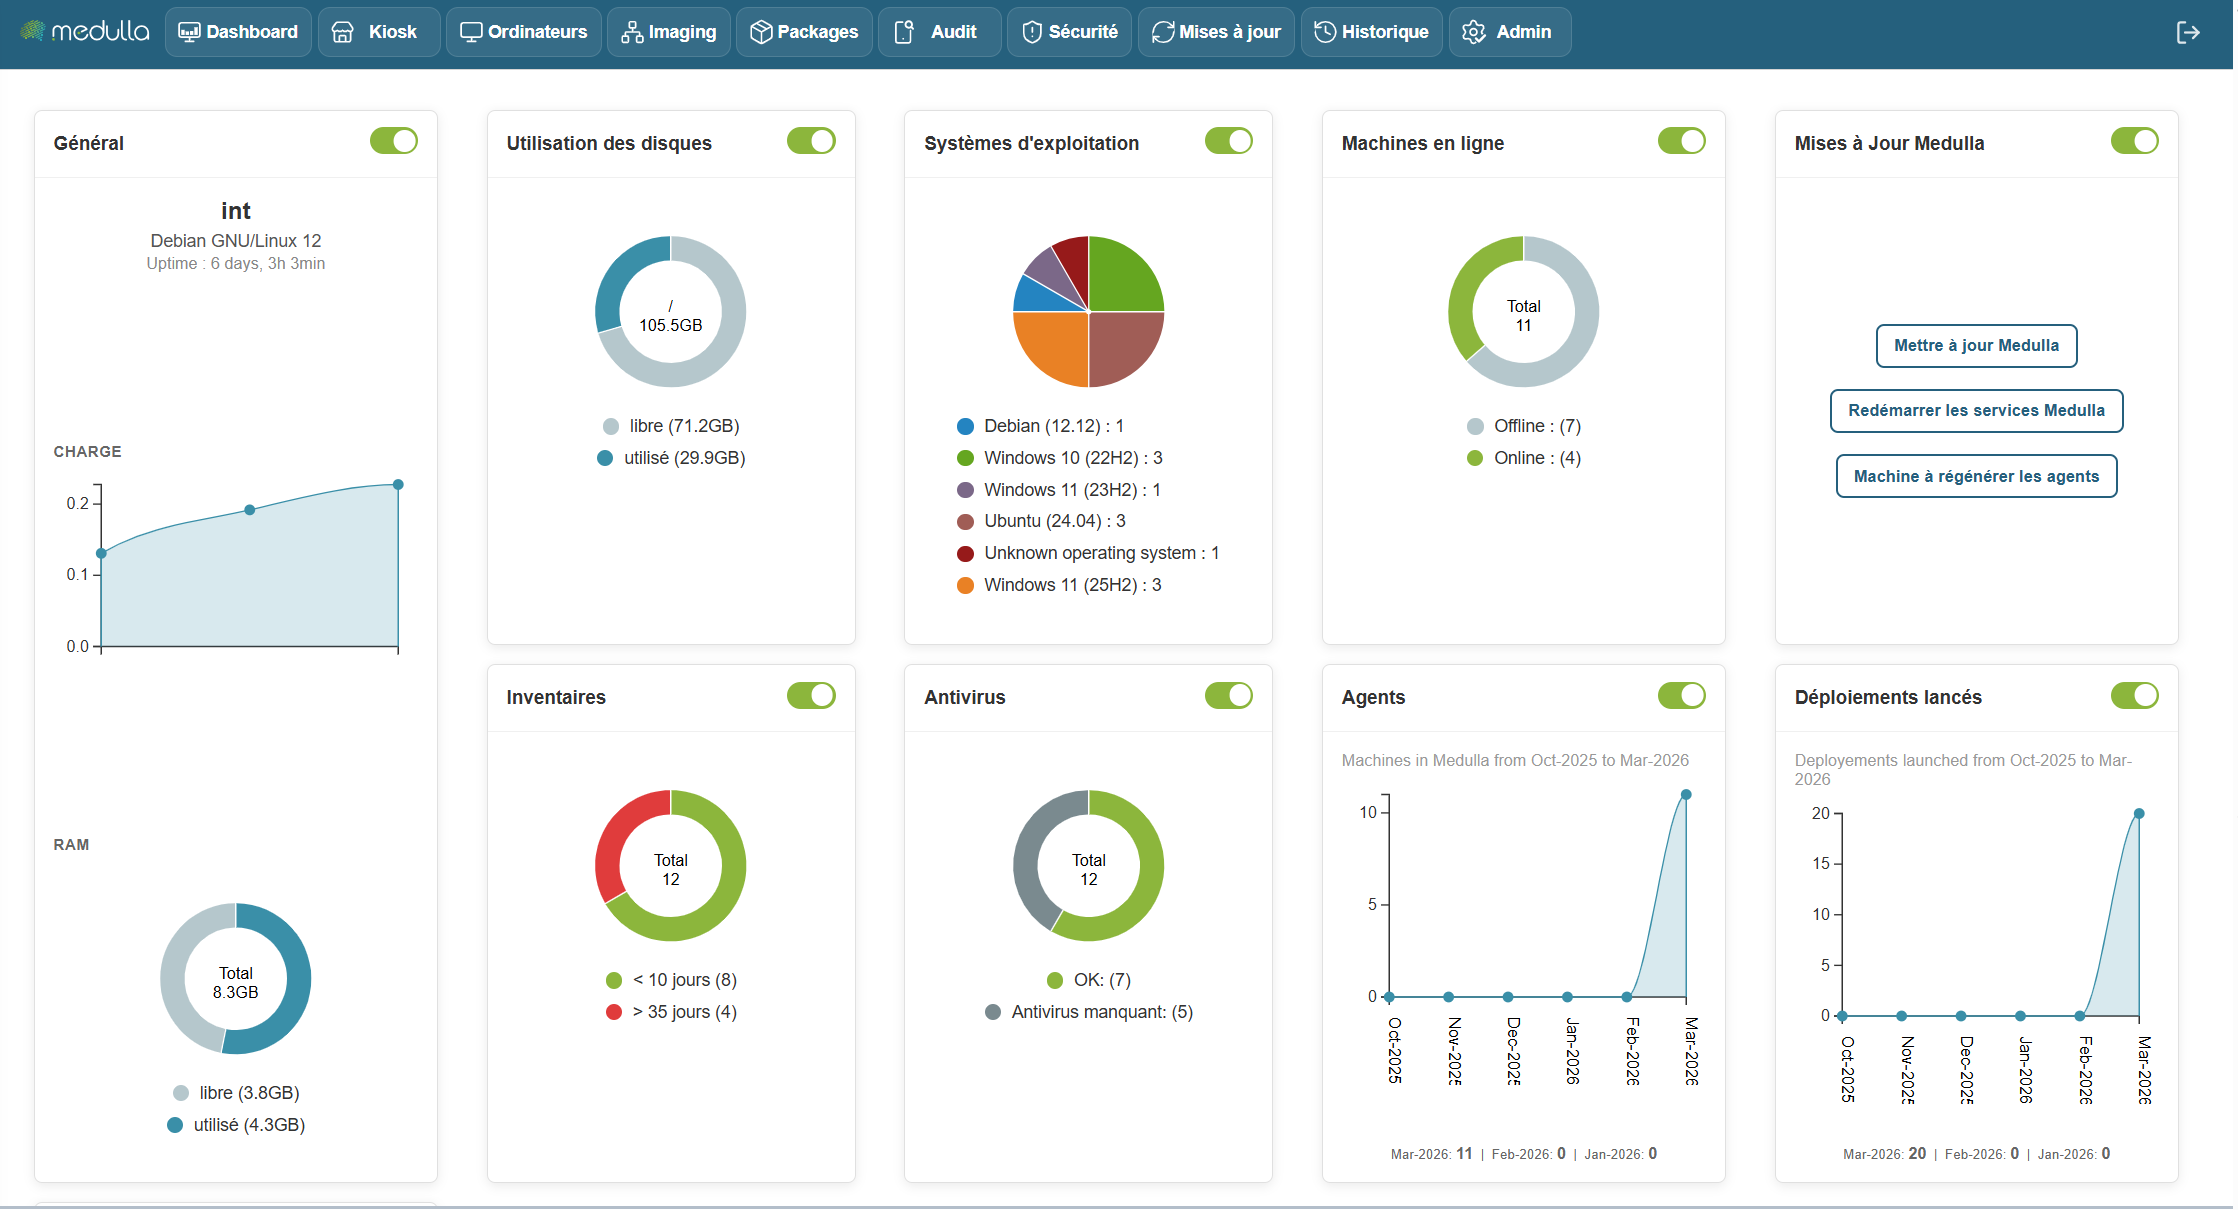
The Medulla dashboard allows you to monitor the real-time status of your infrastructure using customizable widgets. You can move, resize, and arrange the widgets as you wish. Each widget also has a button to show or hide it, depending on your needs.
Some widgets include dynamic charts that update in real time to help you better understand the data.
The following widgets allow you to create static groups directly so you can perform actions on them by clicking on them:
Inventory Widget, Operating System Widget, Online Machines Widget, Antivirus Widget
Available Widgets
Widgets are organized by category and allow you to view various information about your infrastructure. Here are the main categories:
General
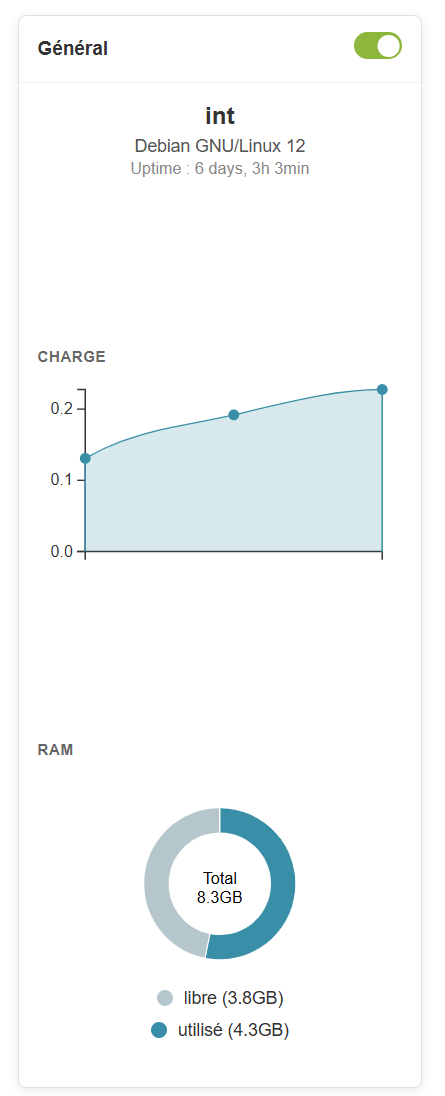
Information Provided
-
Server name (example: devdemo.siveo.net on Debian GNU/Linux 12)
-
Uptime (time elapsed since the last system reboot)
-
TotalRAM, available RAM, and used RAM
Customization
This widget can be moved anywhere you like, and it is resizable to display more or less information depending on your needs. You can also hide it using the toggle if you don’t need to see this information all the time.
Graphical representation
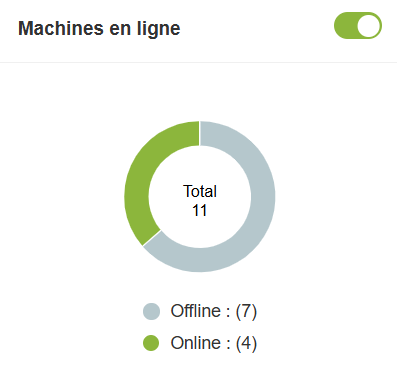
Online Machines
Information Provided
- Total number of online and offline machines.
Customization
This widget can be moved and resized as you like. The toggle lets you show or hide it according to your preference.
Graphical representation
Pie chart to visualize the distribution of online and offline machines.
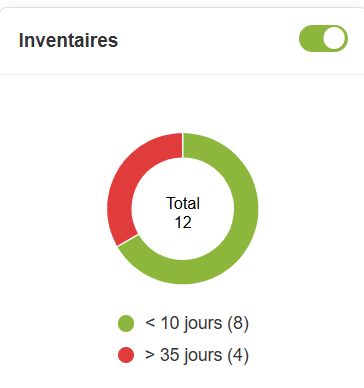
Inventory
Information Provided
- Total number of items in the inventory and those that haven’t been updated in over 10 days.
Customization
The widget is customizable and can be moved and resized. You can also hide it if you don’t need it.
Graphical representation
A pie chartdisplays the items in the inventory and highlights those that need updates, providing an Overview of the inventory’s status
In summary, the Dashboard is your centralized hub for managing and monitoring the status of your IT infrastructure. It is designed to be flexible and responsive, providing an Overview of the performance of your machines and resources, while allowing you to respond quickly to any alerts or necessary updates.
With this set of tools and graphical visualizations, the dashboard gives you optimal control to manage your systems efficiently, while providing a clear and detailed view of your entire IT environment.