Dashboard
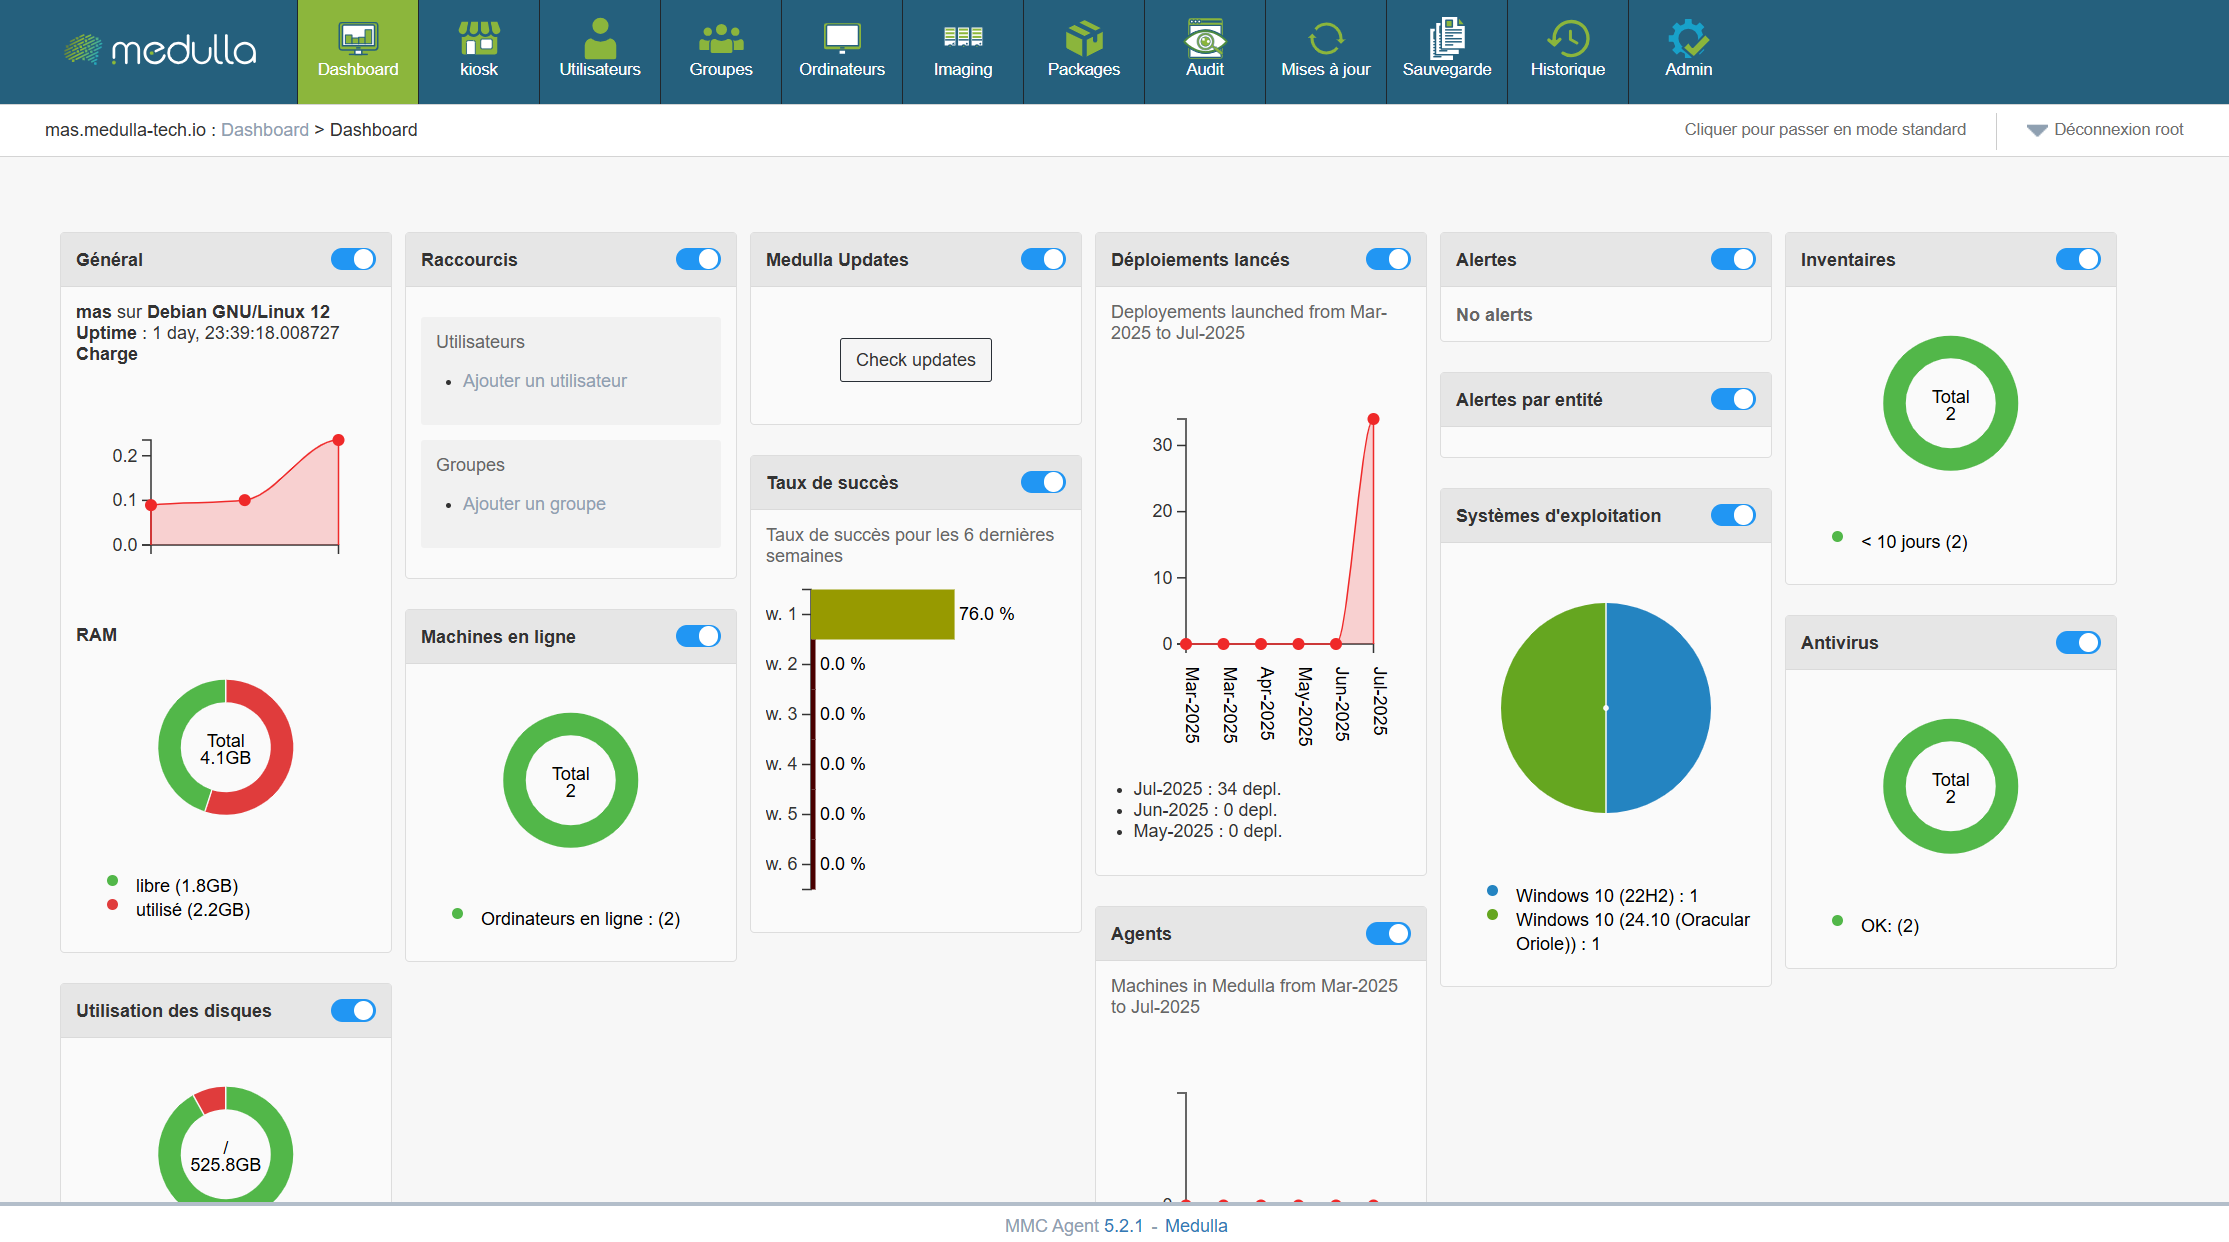
The Medulla dashboard allows you to monitor the real-time status of your infrastructure using customizable widgets. You can move, resize, and arrange the widgets as you wish. Each widget also has a button to show or hide it, depending on your needs.
Some widgets include dynamic charts that update in real time to help you better understand the data.
The following widgets allow you to create static groups directly so you can perform actions on them by clicking on them:
Inventory, Operating System, Online Machines, Antivirus
In summary, the Dashboard is your centralized hub for managing and monitoring the status of your IT infrastructure. It is designed to be flexible and responsive, providing an Overview of the performance of your machines and resources, while allowing you to react quickly to any alerts or necessary Updates.
With this set of tools and graphical visualizations, the dashboard gives you optimal control to manage your systems efficiently, while providing a clear and detailed view of your entire IT environment.