Scoreboard
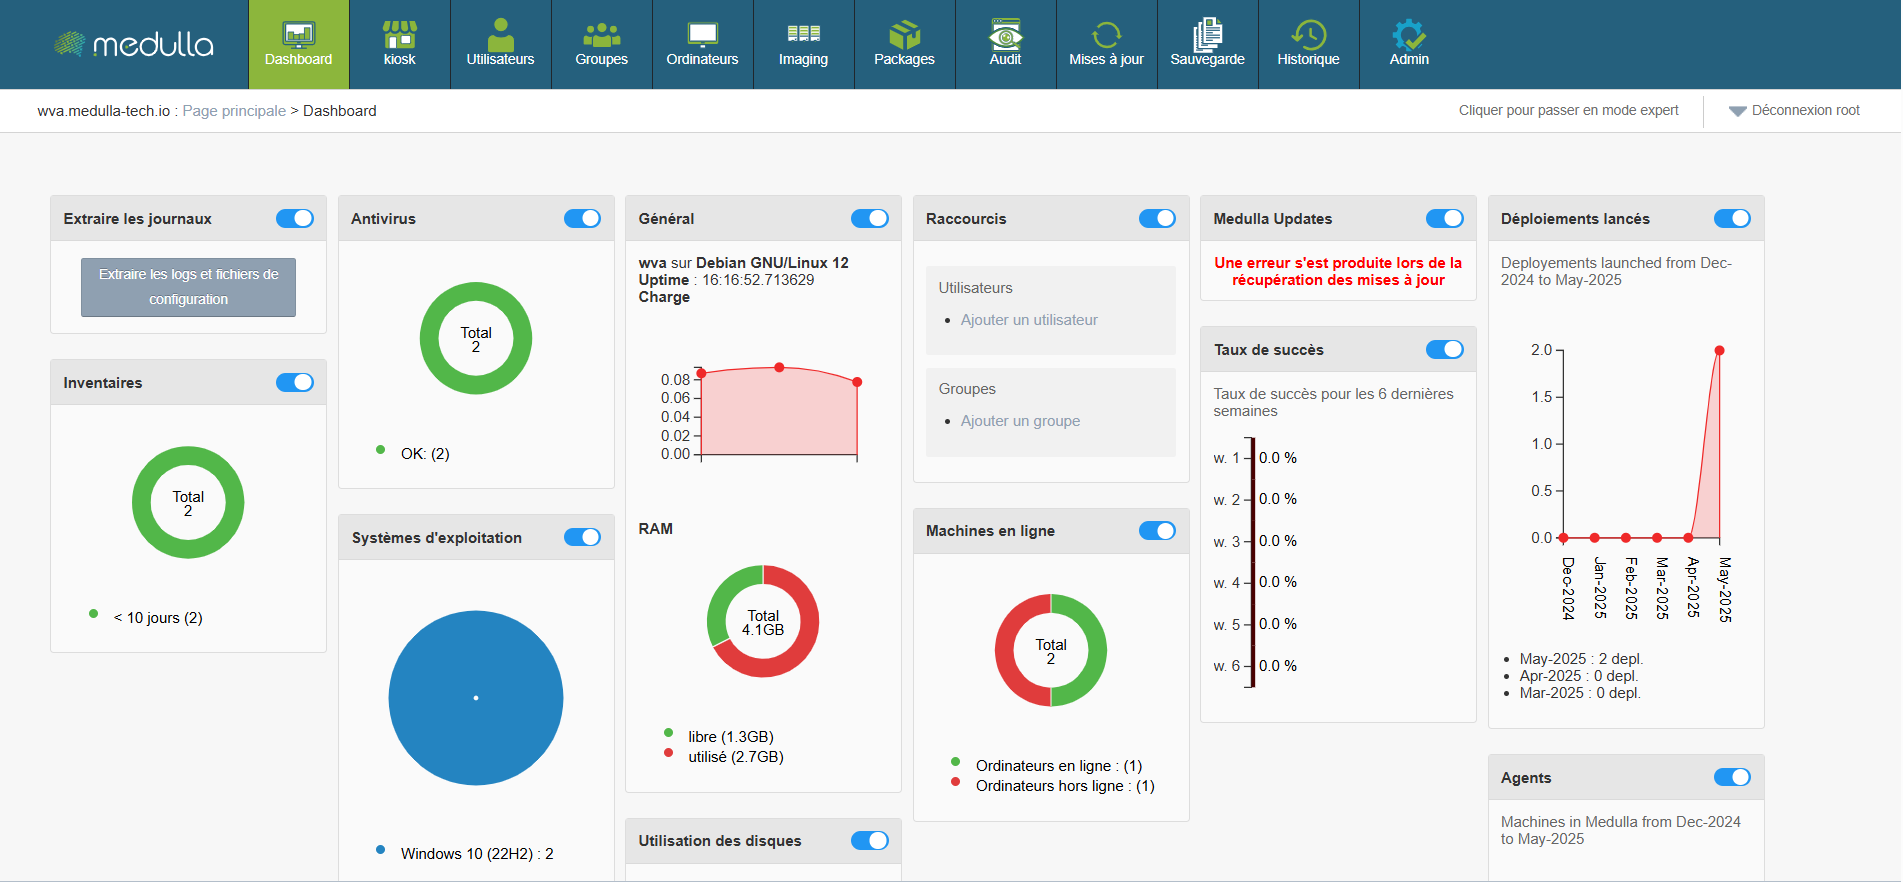
The Medulla dashboard allows you to track the real-time status of your infrastructure with customizable widgets. You can move, resize and organize widgets as you wish. Each widget also has a button to display or hide it, according to your needs.
Some widgets incorporate dynamic graphics for a better understanding of data, updating in real time.
Widgets available
Widgets are categorized by categories and allow you to view various information about your infrastructure. The following are the main categories:
General
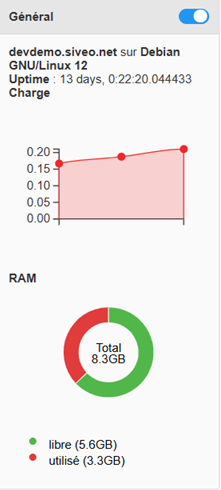
Information provided
-
Server name (example: devdemo.siveo.net on Debian GNU/Linux 12)
-
Uptime (time since last system restart)
-
RAM Total RAM available, free and used
Customization
This widget can be moved wherever you want, and it is resizeable to display more or less information according to your needs. You can also hide it with the toggle if you do not need to see this information permanently.
Graphical representation
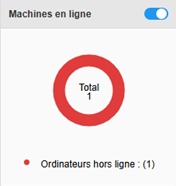
Online machines
Information provided
- Total number of machines online and offline.
Customization
This widget can be moved and resized as desired. The toggle allows you to display or hide it according to your preference.
Graphical representation
Circular graph to see the distribution of machines online and offline.
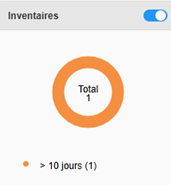
Inventory
Information provided
- Total number of items in the inventory and those not updated for more than 10 days.
Customization
The widget is customizable and can be moved and resized. You can also hide it if you don't need it.
Graphical representation
One circular chartshows the items in the inventory, and highlights those requiring updating, thus providing an overview of the inventory status
In summary, the Dashboard is your central entry point to manage and monitor the status of your IT infrastructure. It is designed to be flexible and reactive, providing an overview of the performance of your machines and resources, while allowing you to react quickly to any necessary alerts or updates.
With this set of tools and graphical visualizations, the dashboard gives you optimal control for managing your systems effectively, while having a clear and detailed view of your entire IT environment.