Task Analysis
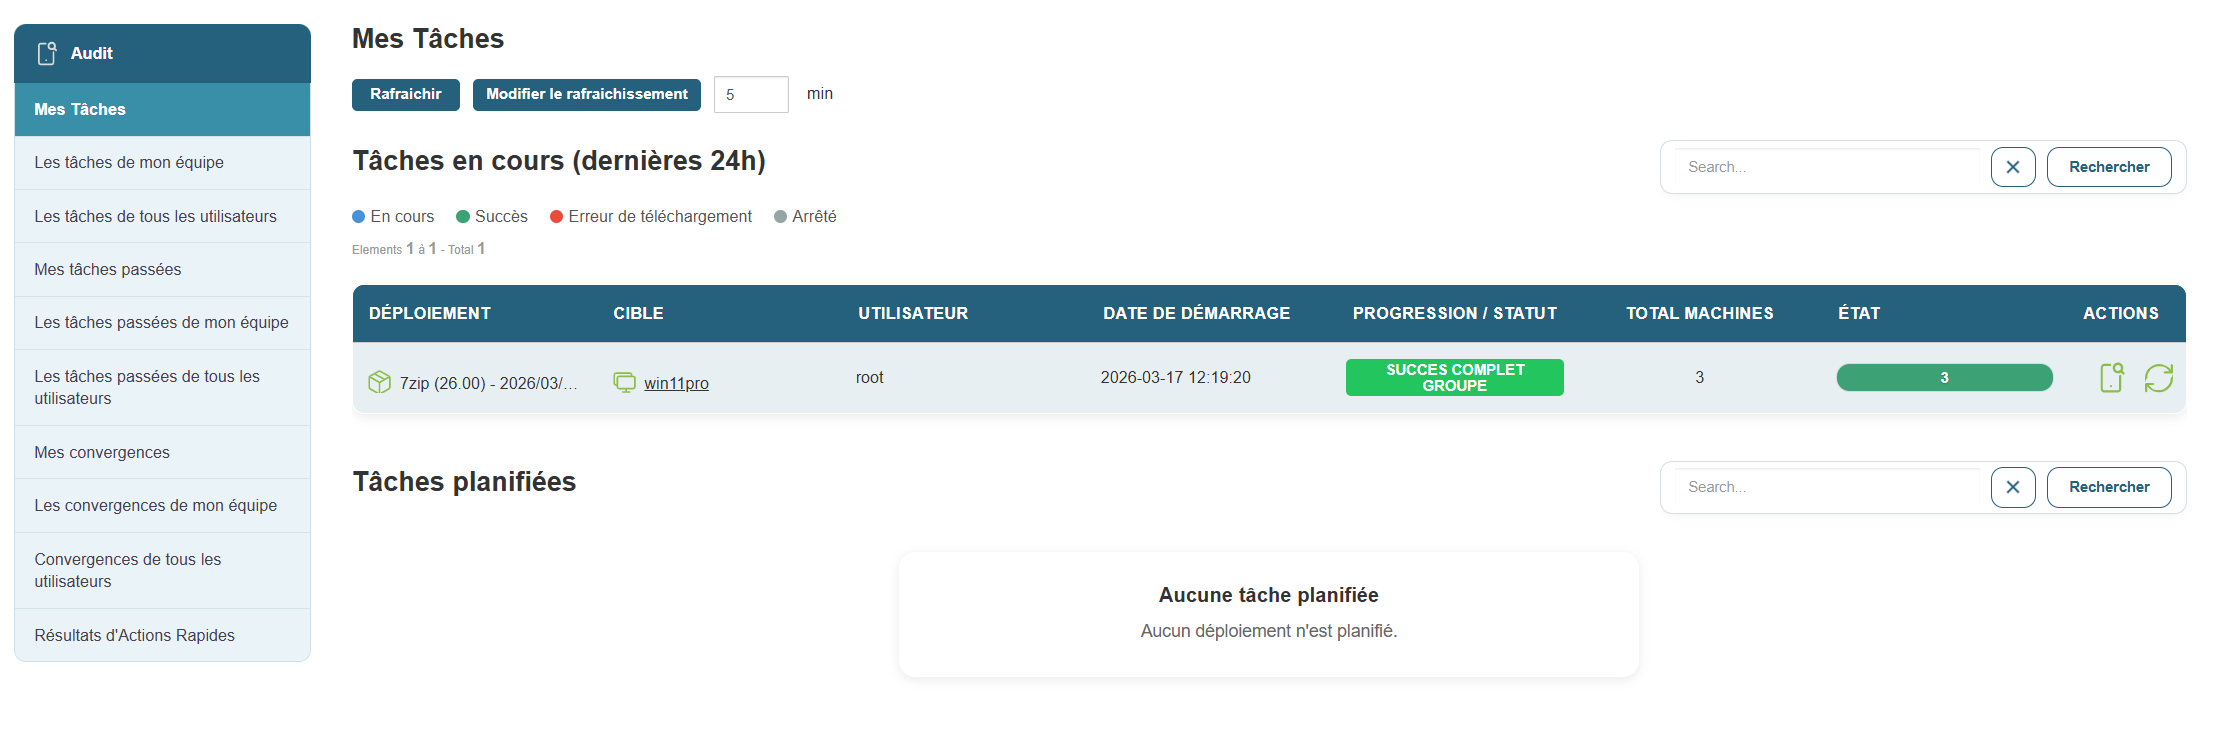
For each task listed, you can accesscomplete details, including:
-
The total number of affected machines
-
The progress rate (successes, errors, stopped transfers)
-
Download or permission errors
-
The associated execution log
This data is essential for:
-
Diagnosing incidents
-
Justify an intervention
-
Verifying deployment compliance
-
Documenting processes for audit purposes
To access these details, simply click the 
A Refresh button (with a configurable interval; default is 5 minutes) keeps the view constantly up to date.
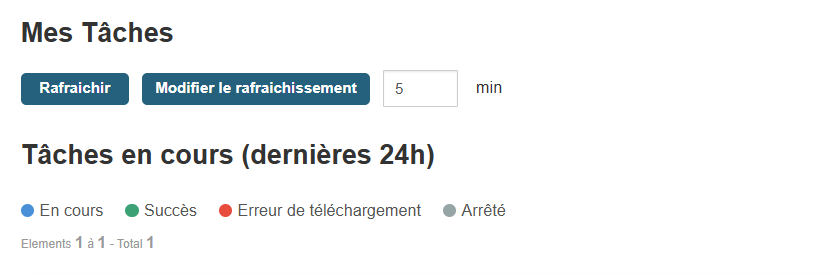
This facilitates active management by allowing you to:
-
Respond quickly in the event of a failure or blockage
-
Identify tasks that are taking an unusually long time
-
Follow a precise schedule in real time
The audit and task management interface serves as a comprehensive, retrospective, and collaborative dashboard. It helps you understand what was done, by whom, on which machine, and with what results. This traceability is essential for strengthening security, improving internal procedures, and ensuring reliable and controlled administration of your IT environment.
Group Deployment Analysis:
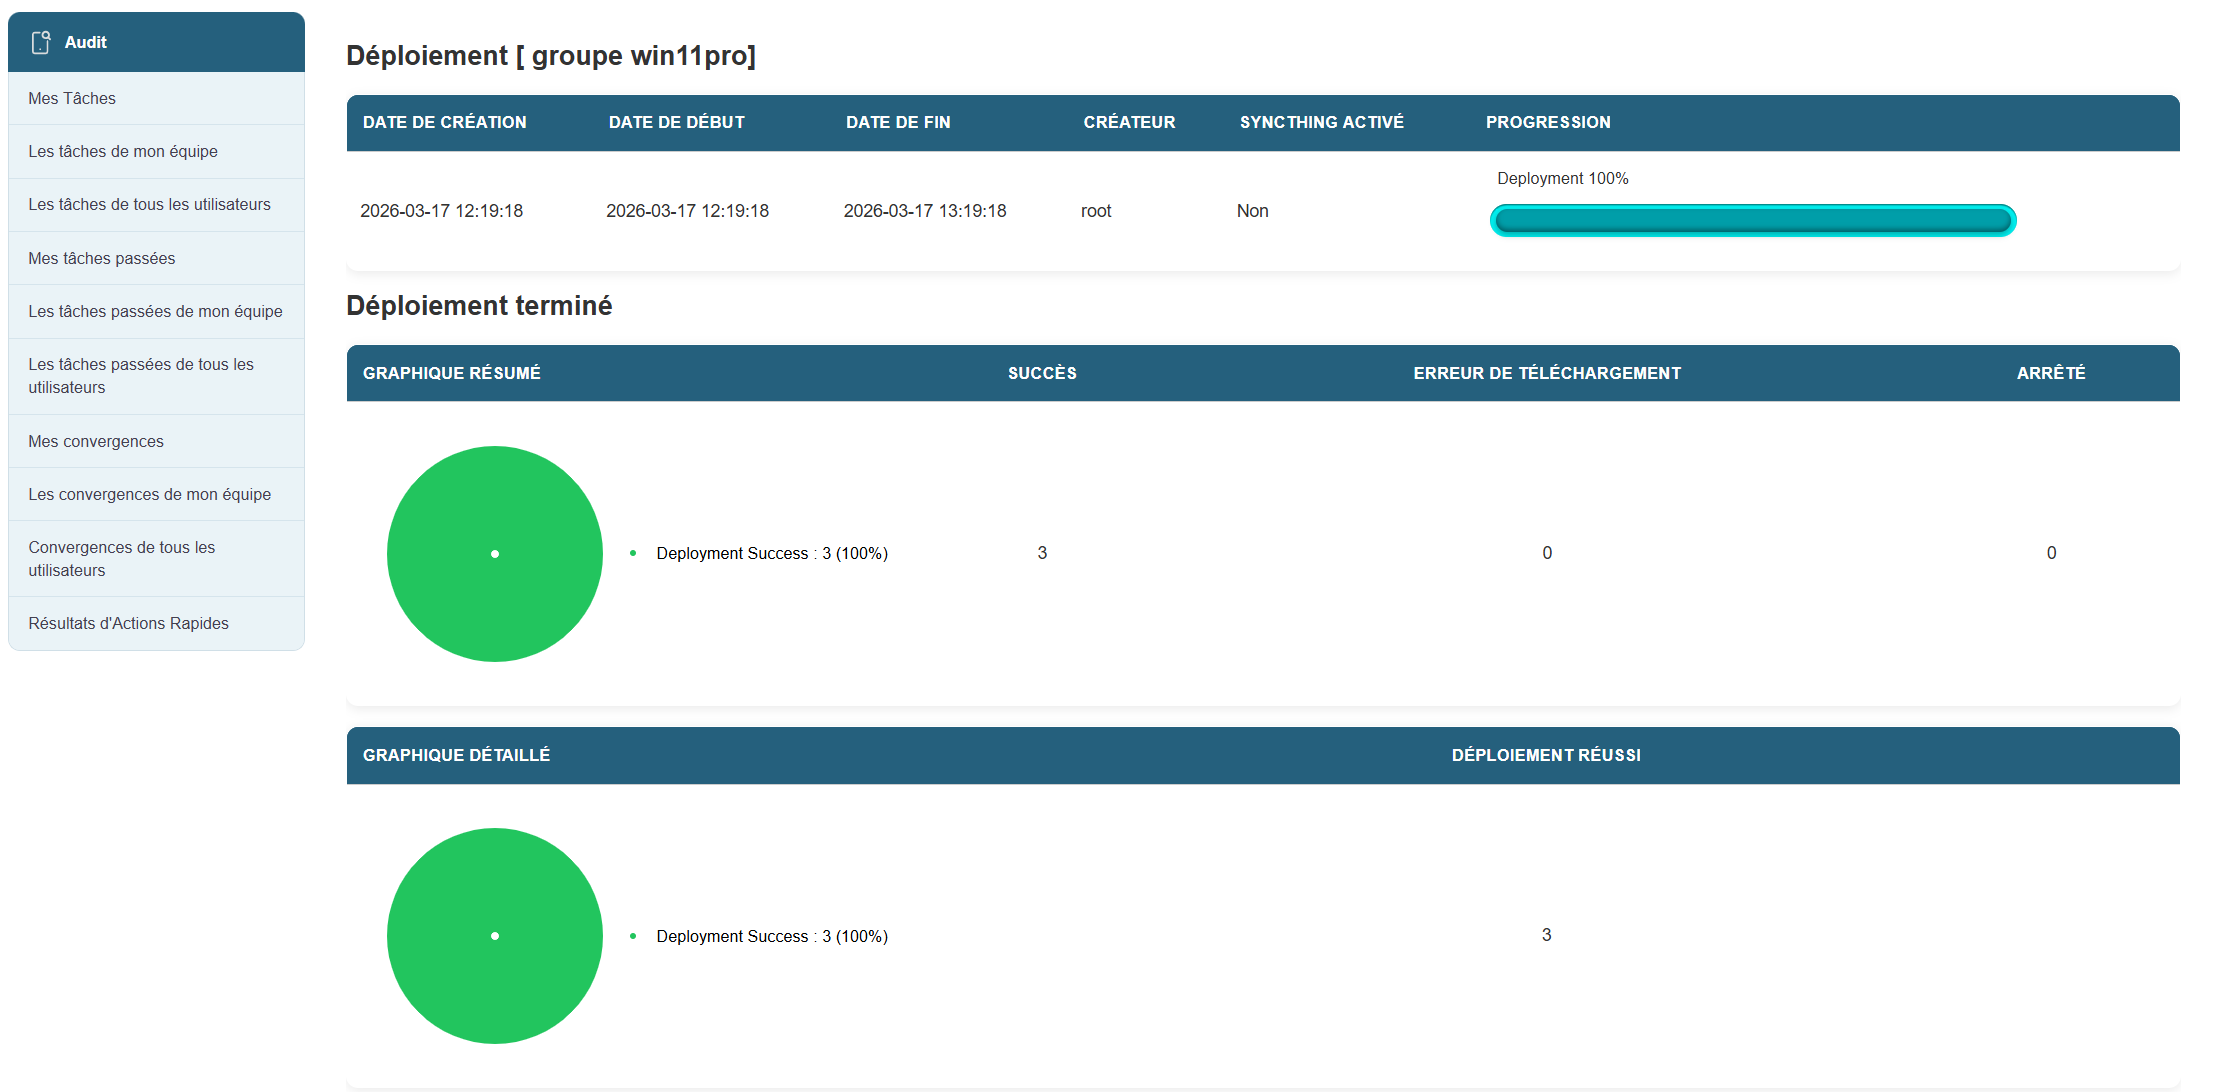
When you open Group Deployment, you’ll see an interface that displays the pie charts from the home screen.
You can then click on each pie chart segment to create a group based on the type of error.
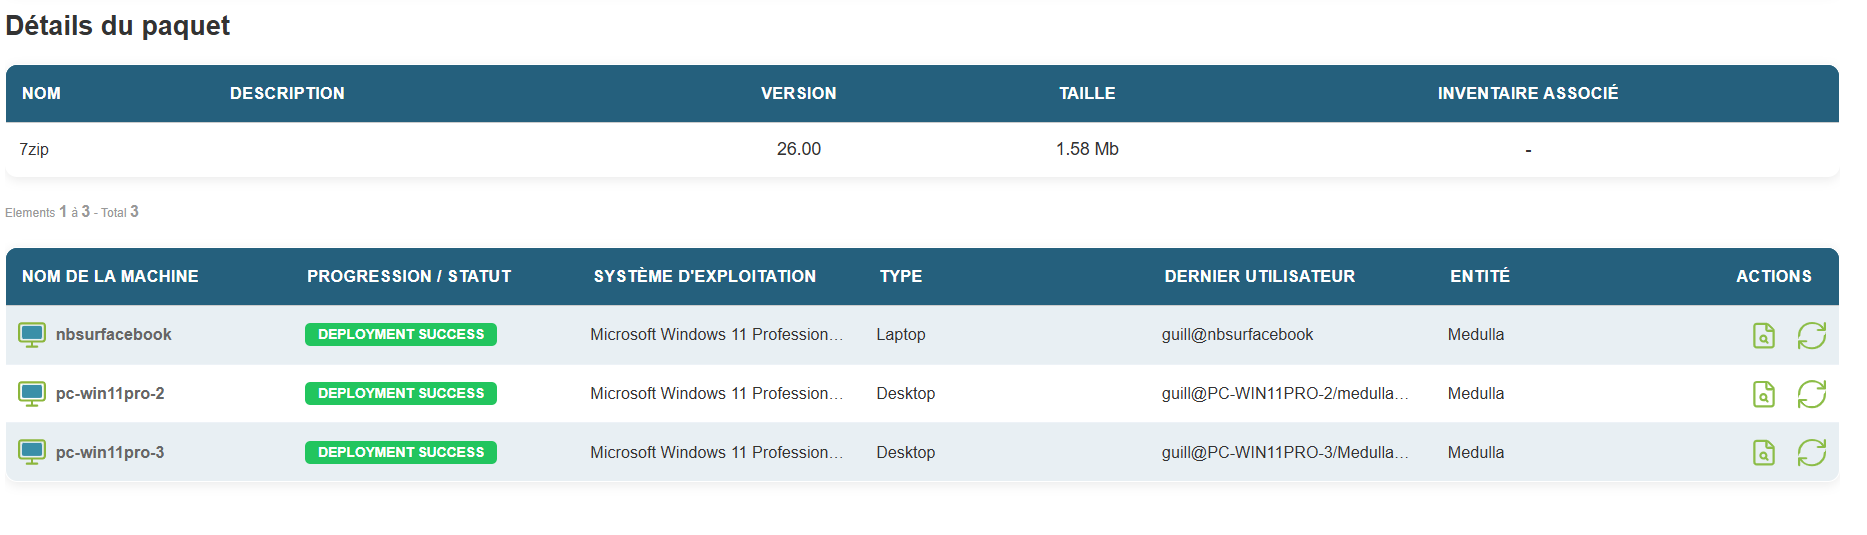
In the second section of the page, you’ll see details about the machines included in the group, along with summary information and two buttons that allow you to:
- view deployment details for the individual machine
- to retry the deployment if it failed.
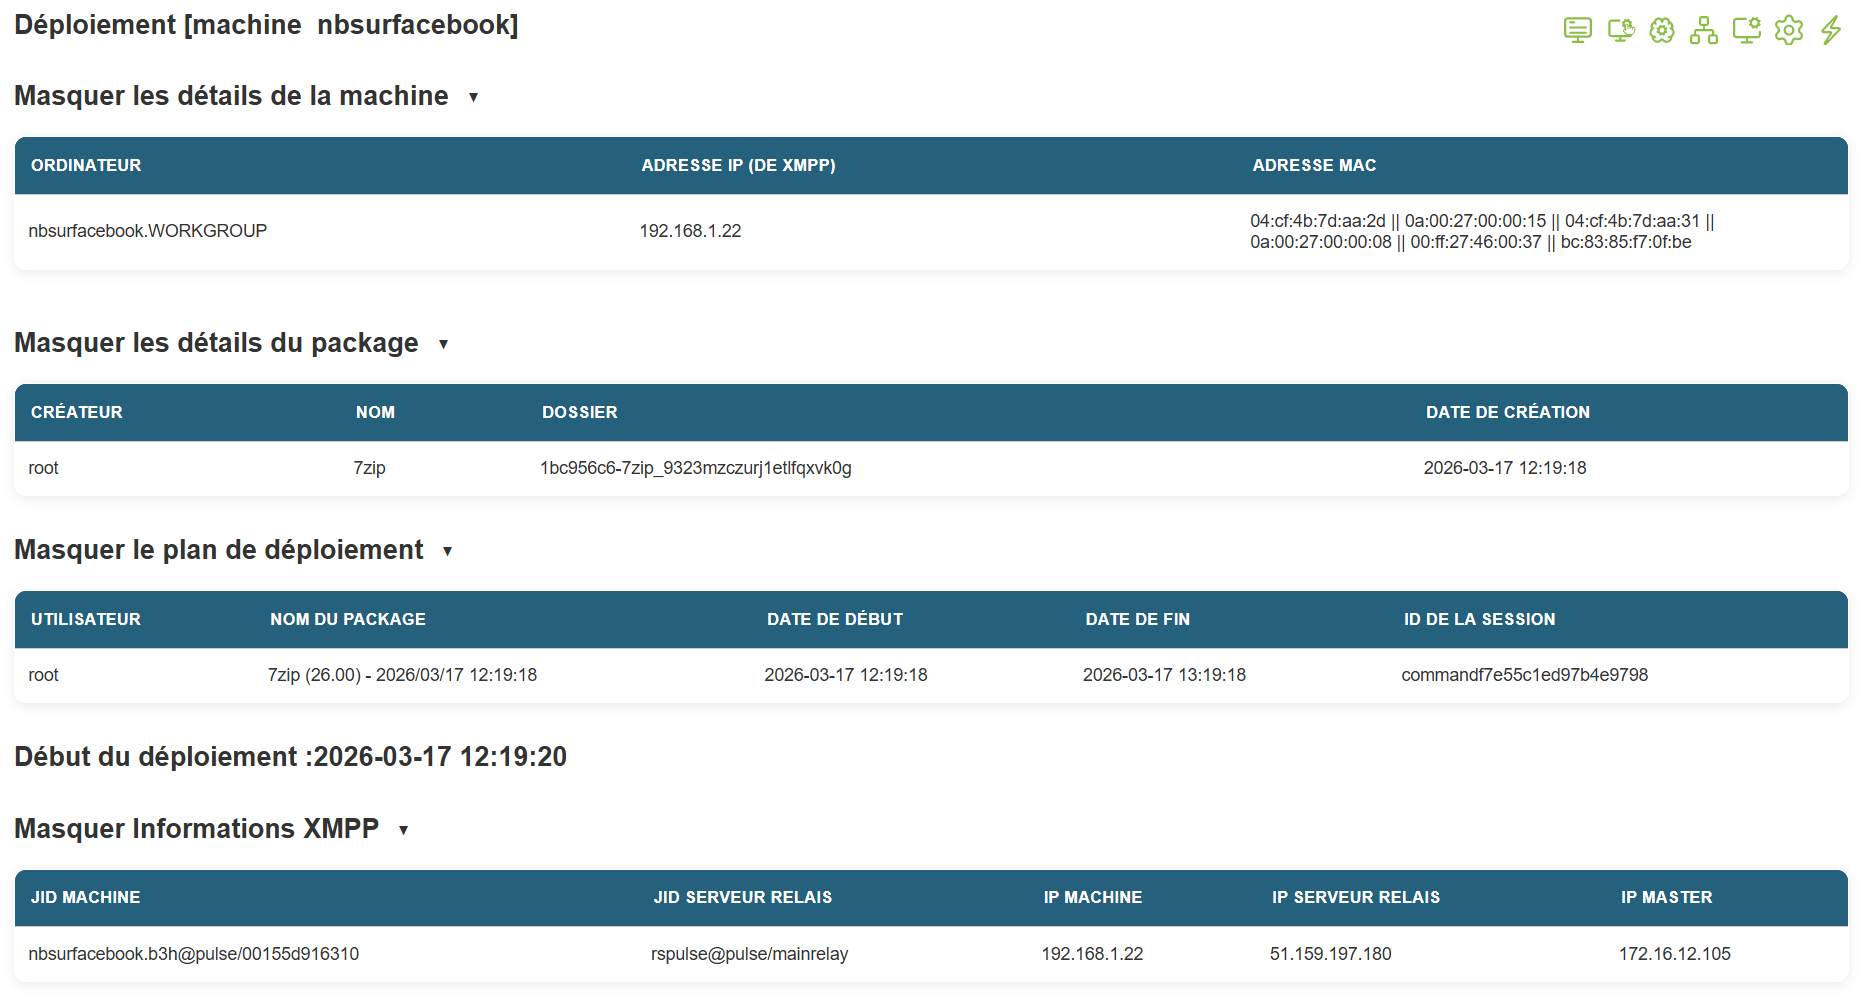
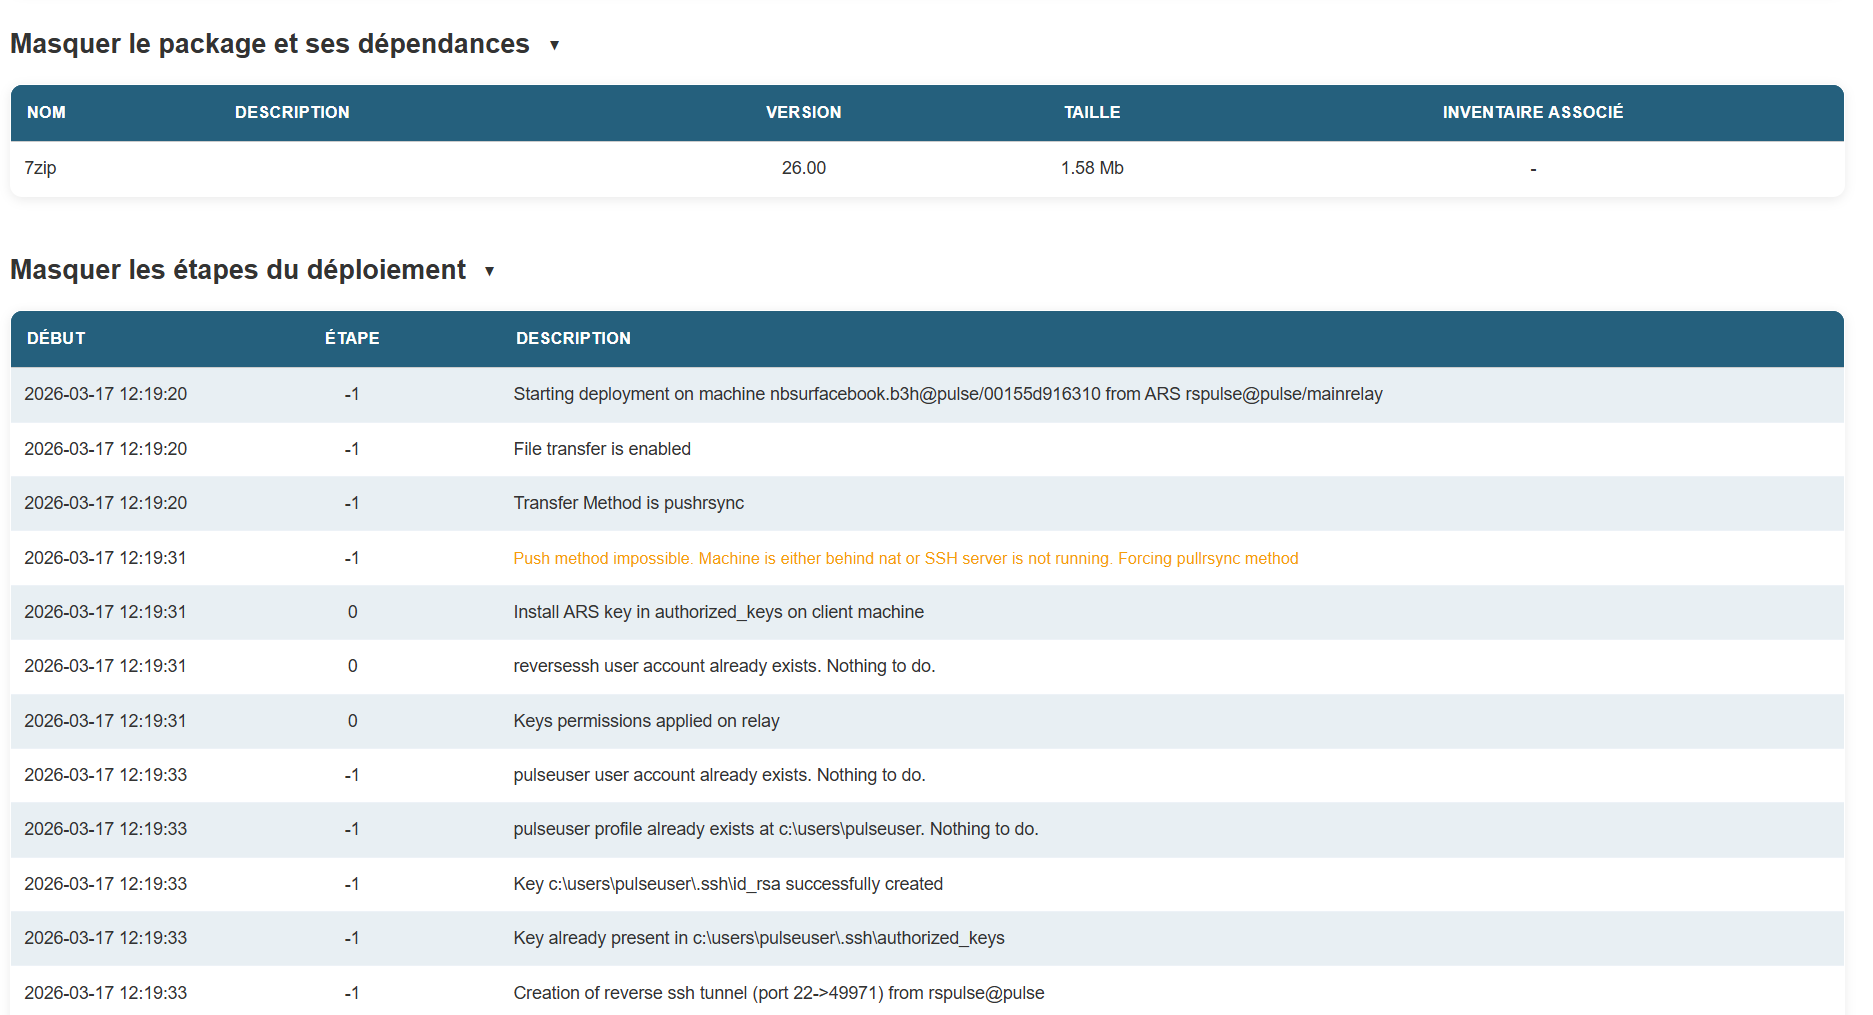
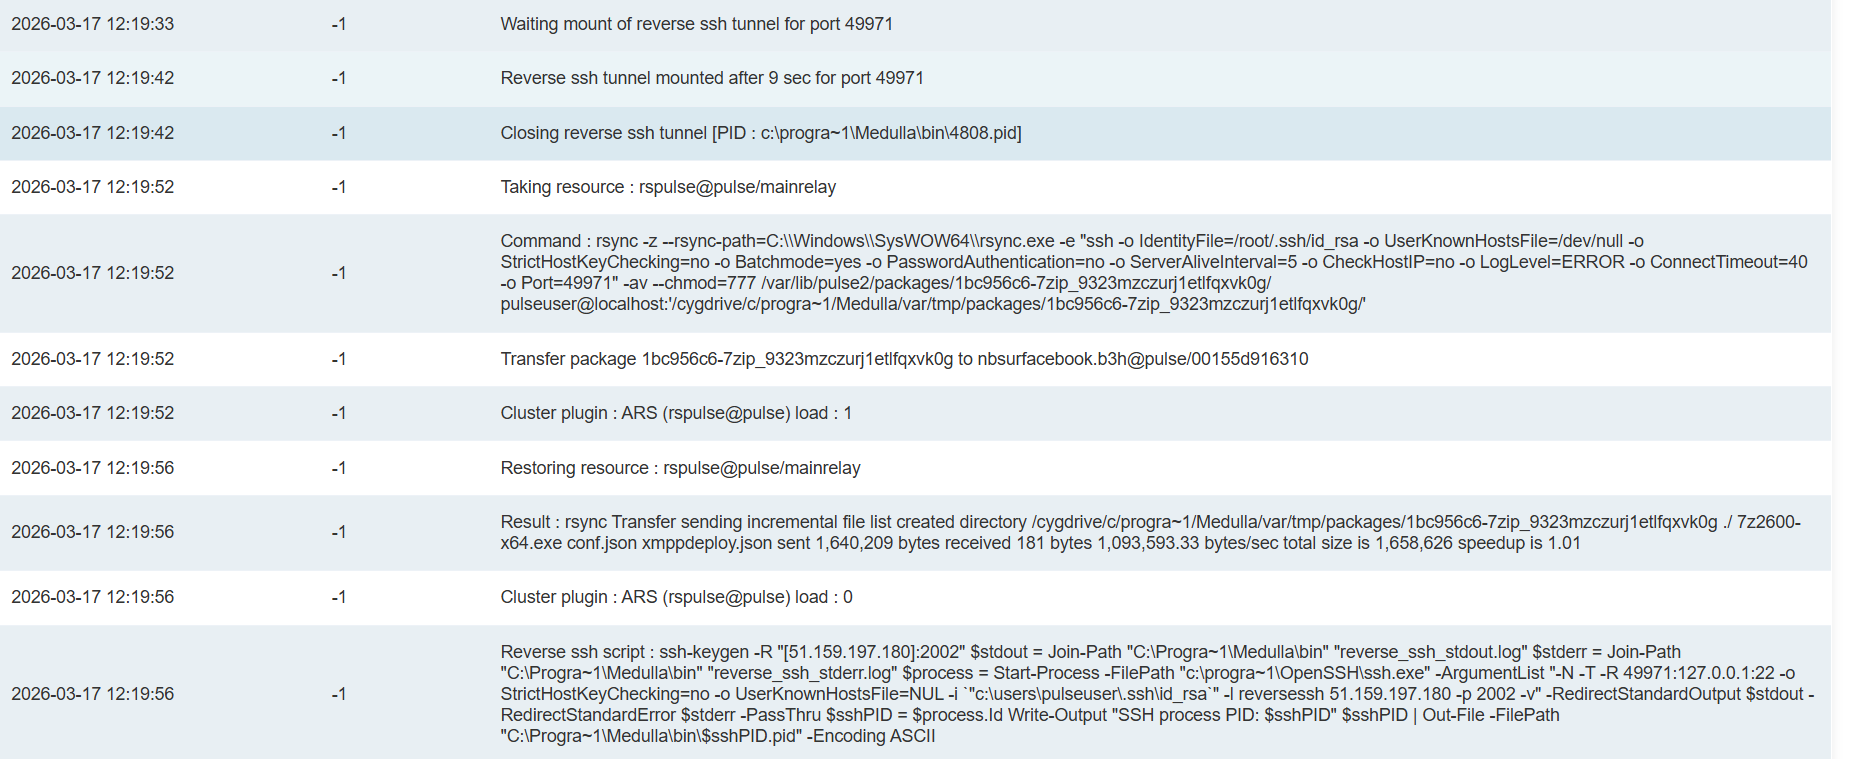
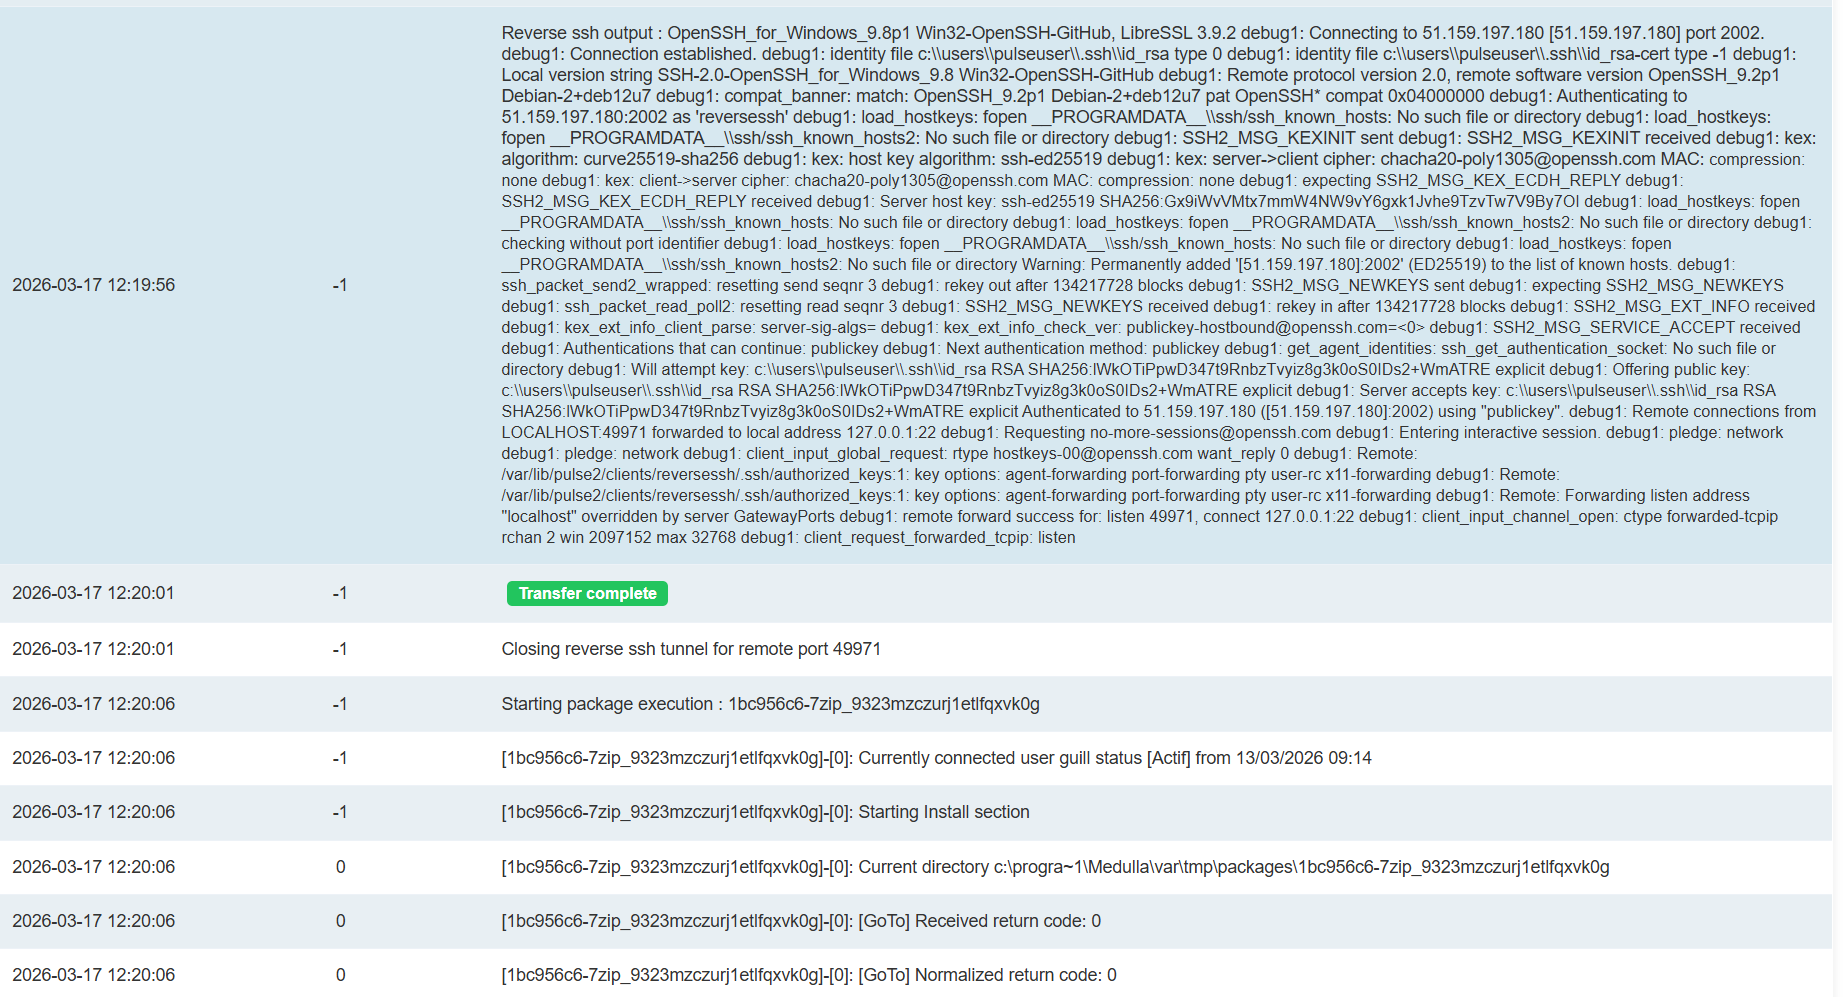
Deployment details for a single machine:
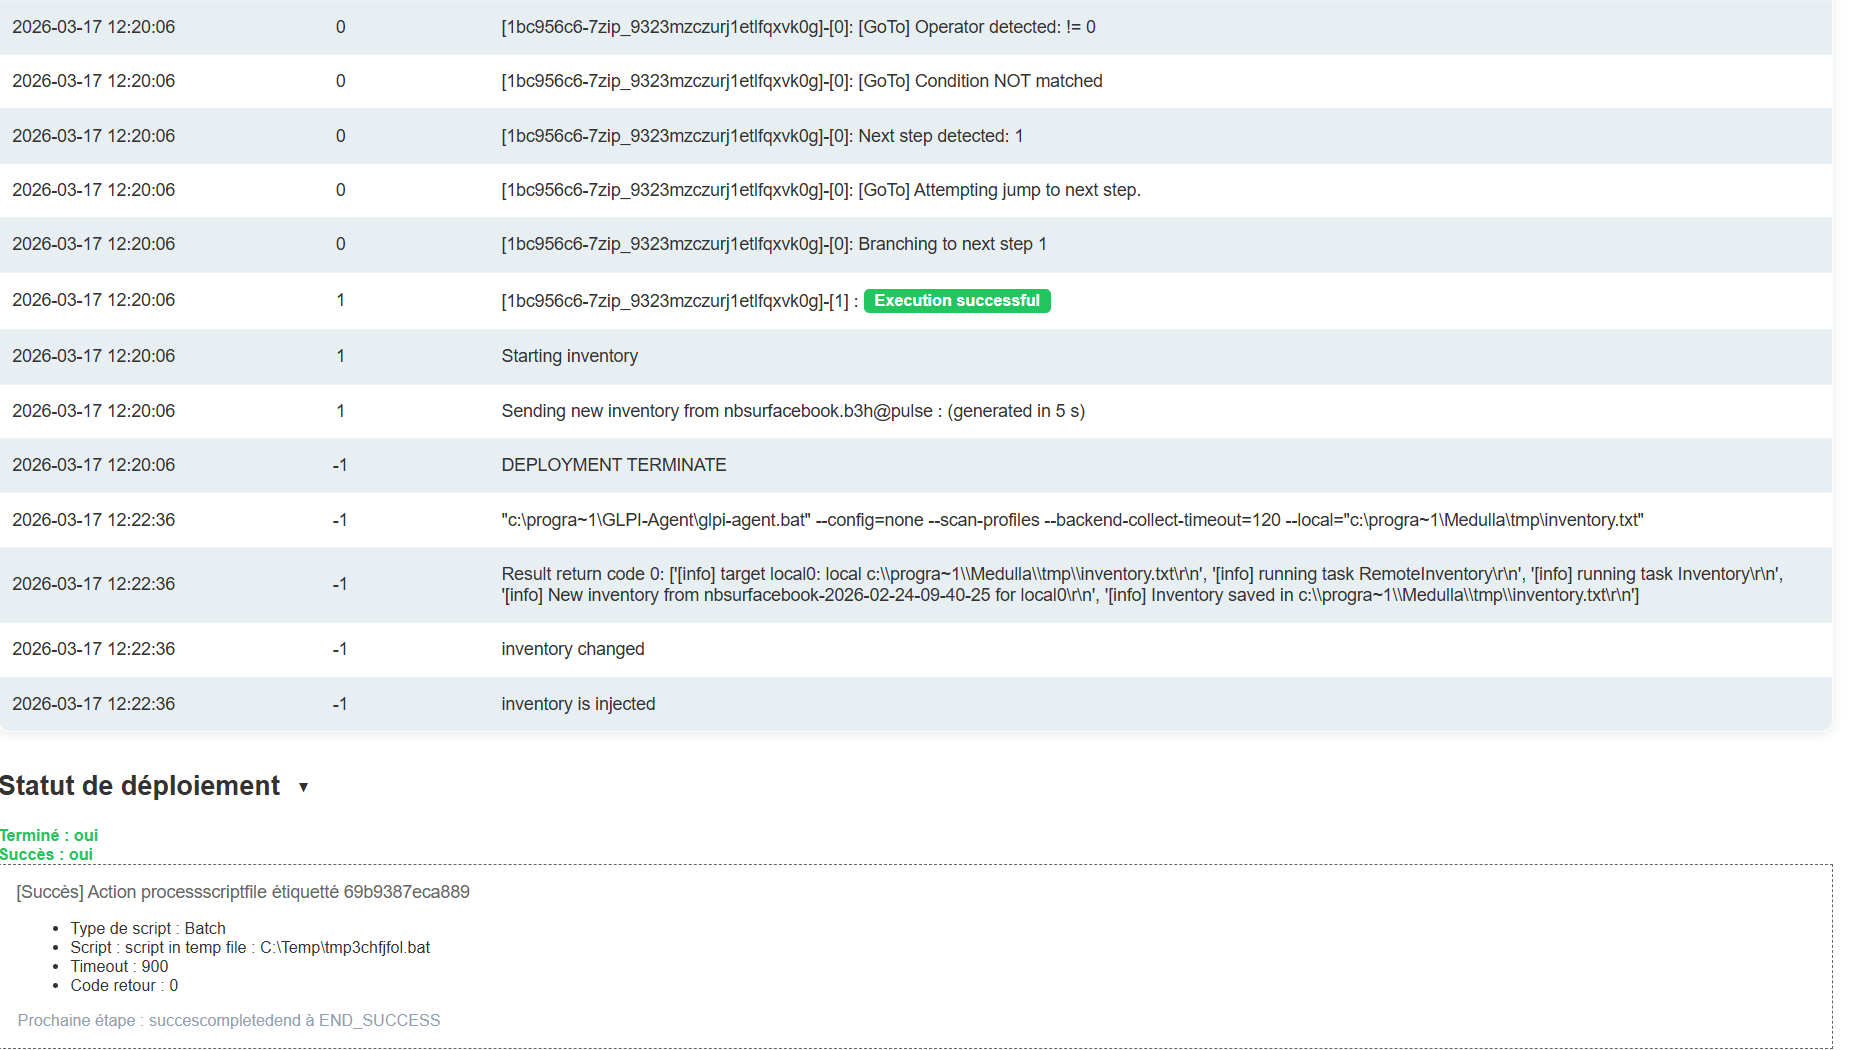
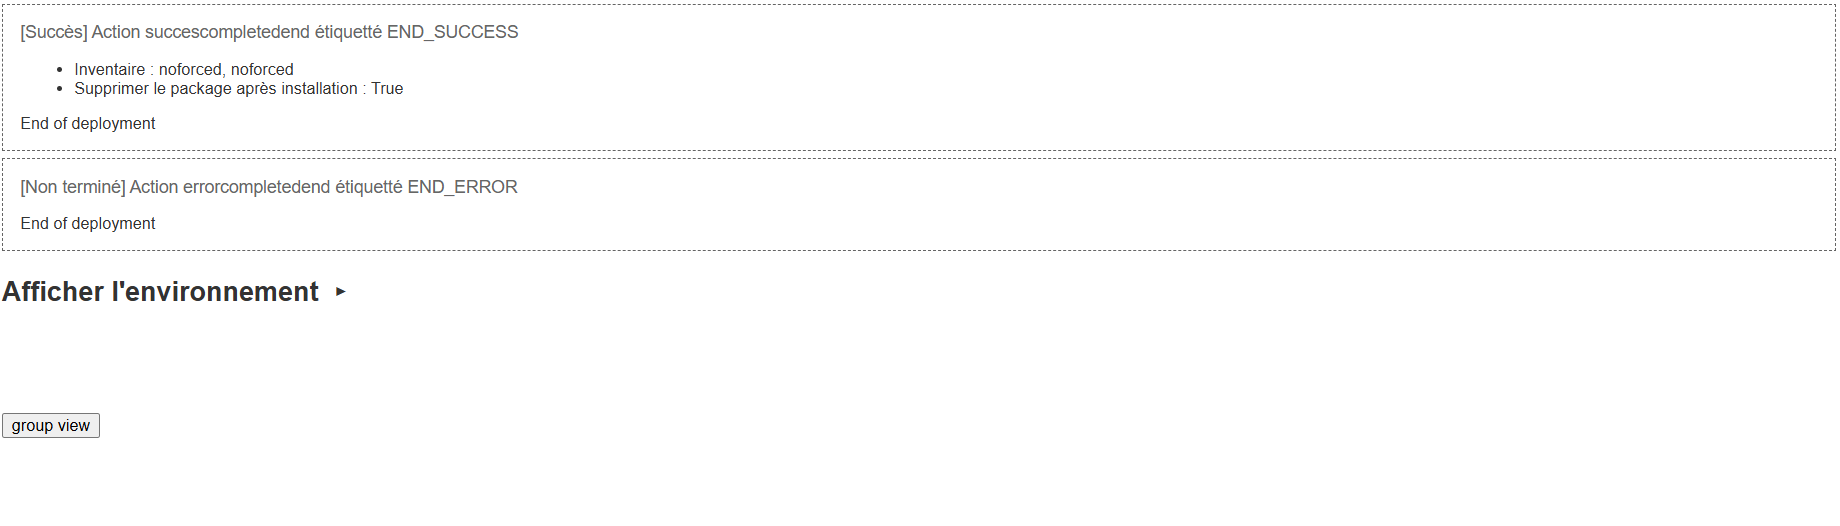
The deployment details list every action that was performed during the deployment phase.
The deployment process at Medulla is divided into three parts:
- Sending the binary to the workstation;
- Executing the installation;
- running an inventory.