
Assigning a probe to the fleet
A probe shipped with Medulla measures nothing until you have assigned it. This is deliberate: you decide what is watched, and where.
The Probes screen shows the catalog.
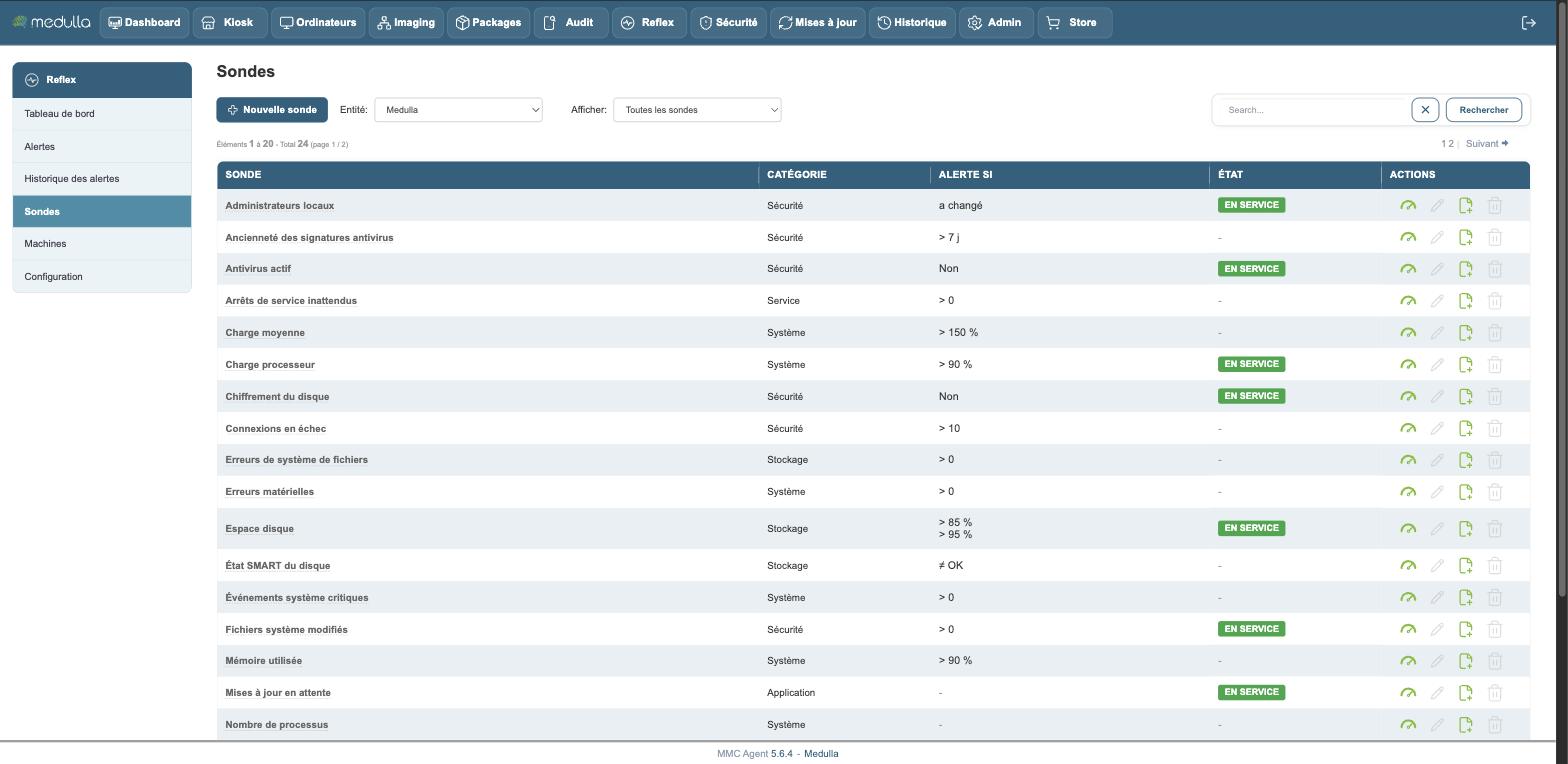
Each row carries the name of the probe, its category, the condition that triggers an alert — the Alert when column — and its state. The In service mention marks the probes already assigned somewhere on the fleet.
Hover over the name of a probe: a tooltip describes exactly what it measures. "Disk space", for instance, says Space used on each partition or volume, as a percentage.
The Entity selector changes the point of view: you see the catalog as it applies to the chosen entity, with its own thresholds.
Opening a probe
The name of a probe opens its sheet.
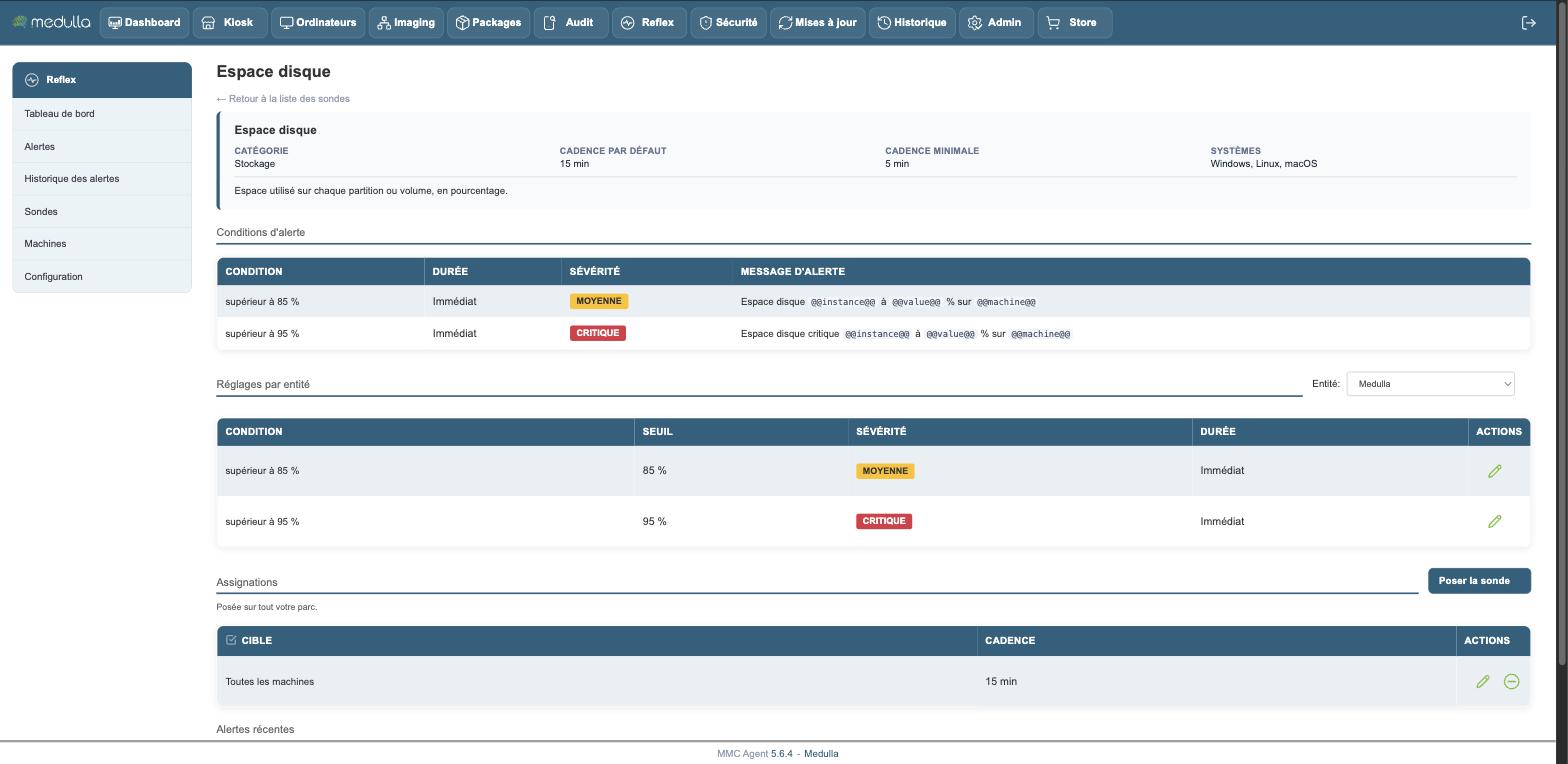
The header recalls the essentials: the category, the default interval, the minimum interval and the systems on which the probe can measure. Disk space, for example, measures every 15 minutes by default, never more often than every 5 minutes, on Windows, Linux and macOS.
The rest reads in three parts.
Alert conditions
The condition or conditions that trigger, each with its duration, its severity and its message. A probe can carry several: Disk space alerts as medium above 85 %, and as critical above 95 %.
The messages contain tokens that the server replaces at the time of the alert:
| Token | Replaced by |
|---|---|
@@machine@@ |
the name of the machine |
@@value@@ |
the measured value |
@@threshold@@ |
the threshold crossed |
@@instance@@ |
what is measured, when the probe measures several things — the mount point, the volume |
Settings per entity
The same probe can alert at different thresholds depending on the entity. A production server and a desktop computer do not tolerate the same load.
The Entity selector, to the right of this section, shows the thresholds in force for the chosen entity and lets you change them condition by condition. Entities without settings of their own apply the original ones.
Assignments
Where the probe is assigned, and at what interval. A row shows the target and its interval. A probe assigned everywhere simply shows Placed on your whole estate.
Assigning the probe
The Assign probe button opens the choice of target:
- a specific machine
- a group of machines
- a whole entity
- all machines
Agents start measuring as soon as you save. They receive their configuration at the next cycle, which takes a few minutes.
Choosing the interval
Each assignment carries its interval. The interval starts at five minutes.
Each probe also carries a minimum interval of its own. Some query the system at a negligible cost, others walk through files or read a database: the module refuses an interval that would bring the machine to its knees.
Choose the interval according to what you measure, not for display comfort. Disk space that fills up over weeks does not need to be measured every five minutes; a critical service does.
The edit action on an assignment row changes its interval without touching the rest.
Removing a probe
Three different actions, which must not be confused.
Removing an assignment — the remove action on an assignment row. The agents of the machines concerned stop measuring, and the alerts open on the machines that lose the probe are closed. The checkboxes let you remove several at once.
Removing the probe from a single machine — from the supervision sheet of that machine. That machine stops being measured, the other machines of the same assignment keep it. The alerts open on that probe and that machine are closed.
This is what creates an exception: assigning a probe to a whole entity and then removing three computers from it is simpler than assigning it machine by machine. These removals appear in an Exceptions section of the probe sheet, which is only shown if there are any.
Lifting an exception — the opposite action, from the same section. The machine is measured again as its assignments require, without having to assign the probe again.