
The dashboard
The dashboard is the home page of the module. It answers a single question: where does the fleet stand right now?
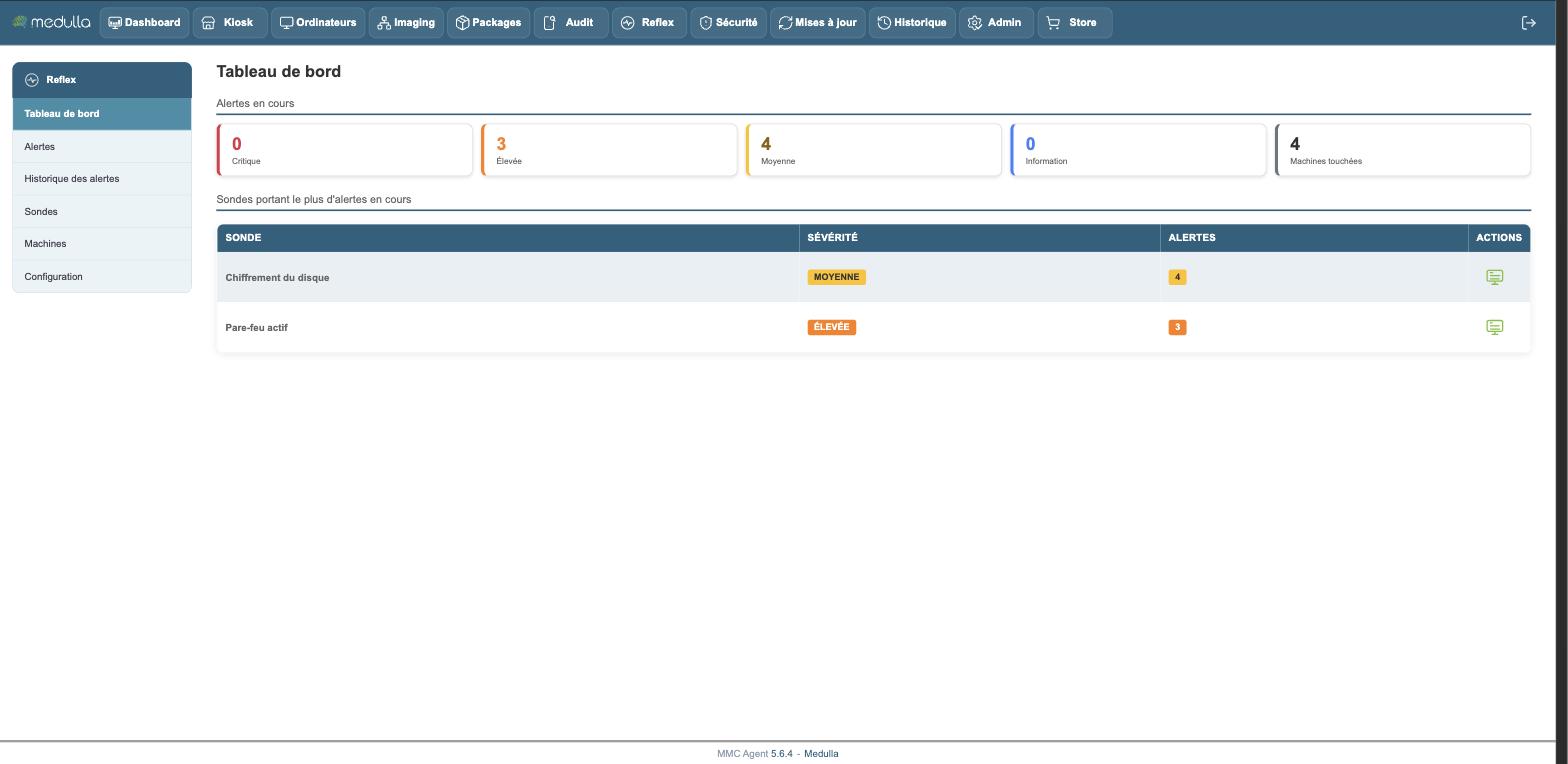
The alerts in progress banner
Five counters sum up the situation:
- the number of critical alerts
- the number of high alerts
- the number of medium alerts
- the number of info alerts
- the number of machines impacted
This last counter cannot be worked out from the others. One machine can carry several alerts, and ten alerts on a single machine do not describe the same situation as ten alerts on ten machines.
Each counter can be clicked and opens the list of alerts filtered on the matching severity.
Probes carrying the most alerts
For each probe, you read its name, the severity of its condition, the number of open alerts, and a shortcut to the list filtered on that probe.
If no alert is open, the table gives way to a message that says so. This is the normal result for a healthy fleet.