
Creating a personal probe
The shipped catalog cannot foresee everything. A business application, a file that must exist, a service specific to your organization: Reflex lets you create your own probes.
The principle
A personal probe is a command run on the machine by the agent. The first line it prints is the measure.
That is all. If your command prints 42, the measure is 42. If it prints
Non, the measure is "Non". You have nothing else to produce.
The four fields that matter
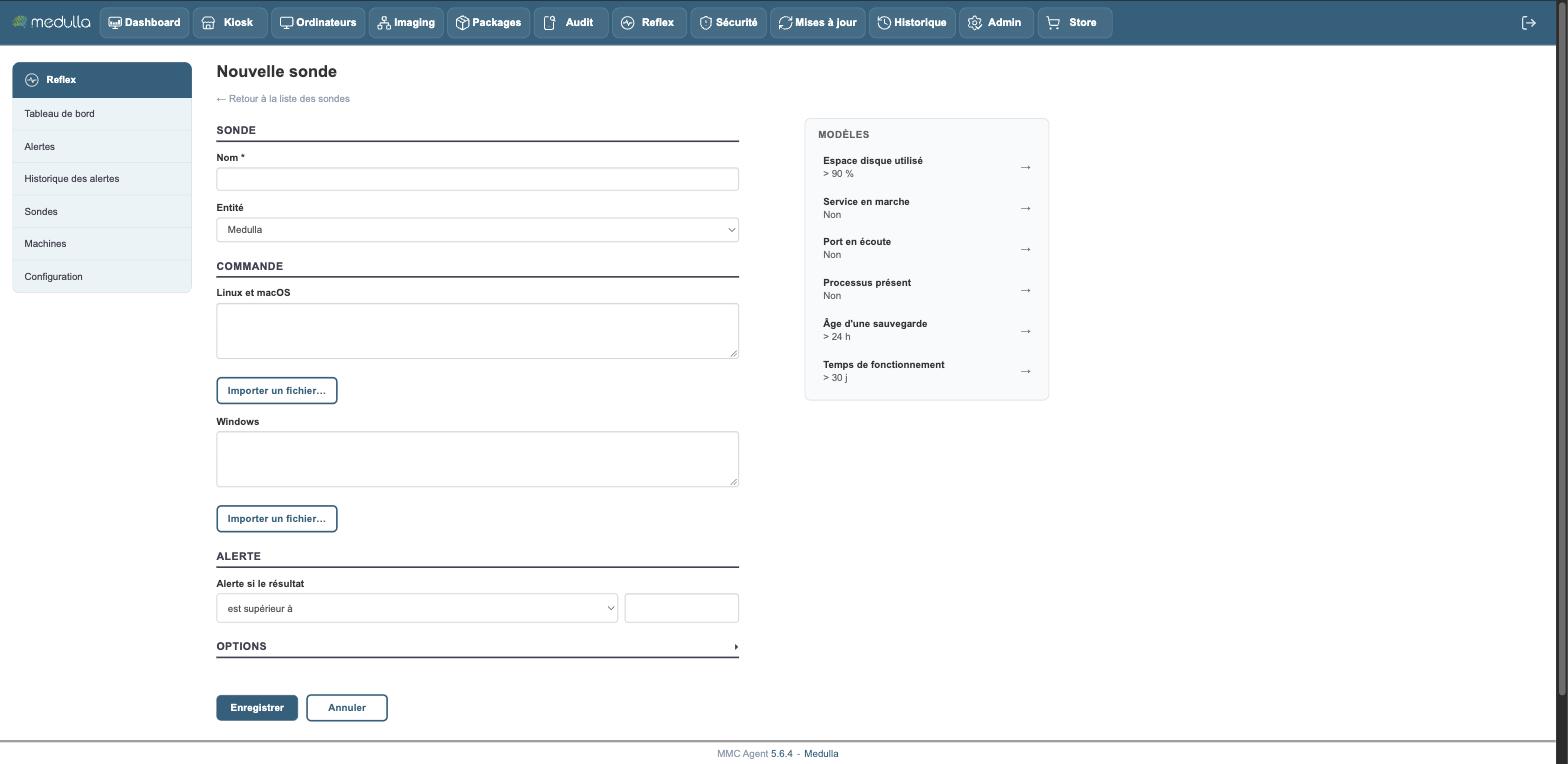
The form comes down to four fields. Everything else has a suitable default value and waits under Options.
Name — what the probe measures, not what it reports as wrong. Write "Backup service running" rather than "Backup stopped": the name appears in the lists, including when all is well.
Entity — a personal probe belongs to the entity that creates it. It is never visible to the others.
Command — two separate fields:
- Linux and macOS, interpreted by
sh - Windows, interpreted by PowerShell
Fill in at least one of the two. An Import a file… button under each field loads the content of a script already written, which saves pasting it by hand.
A probe with no command for a system will measure nothing on that system, and will say so rather than show an empty cell.
Alert if the result — the trigger condition, an operator and a value. The type is worked out from what you enter: comparing to a number treats the measure as a number, comparing to a text treats it as a text.
Among the operators, has changed triggers as soon as the measure differs from the previous one, with no threshold to set. It is the one to use for watching what must not move.
Templates
The Templates panel, on the right, fills the form with an example ready to adapt:
| Template | Alert when |
|---|---|
| Disk space used | > 90 % |
| Service running | No |
| Port listening | No |
| Process running | No |
| Backup age | > 24 h |
| Uptime | > 30 d |
One click fills in the command and the condition; you only have to change the name of the service, the port number or the path.
Options
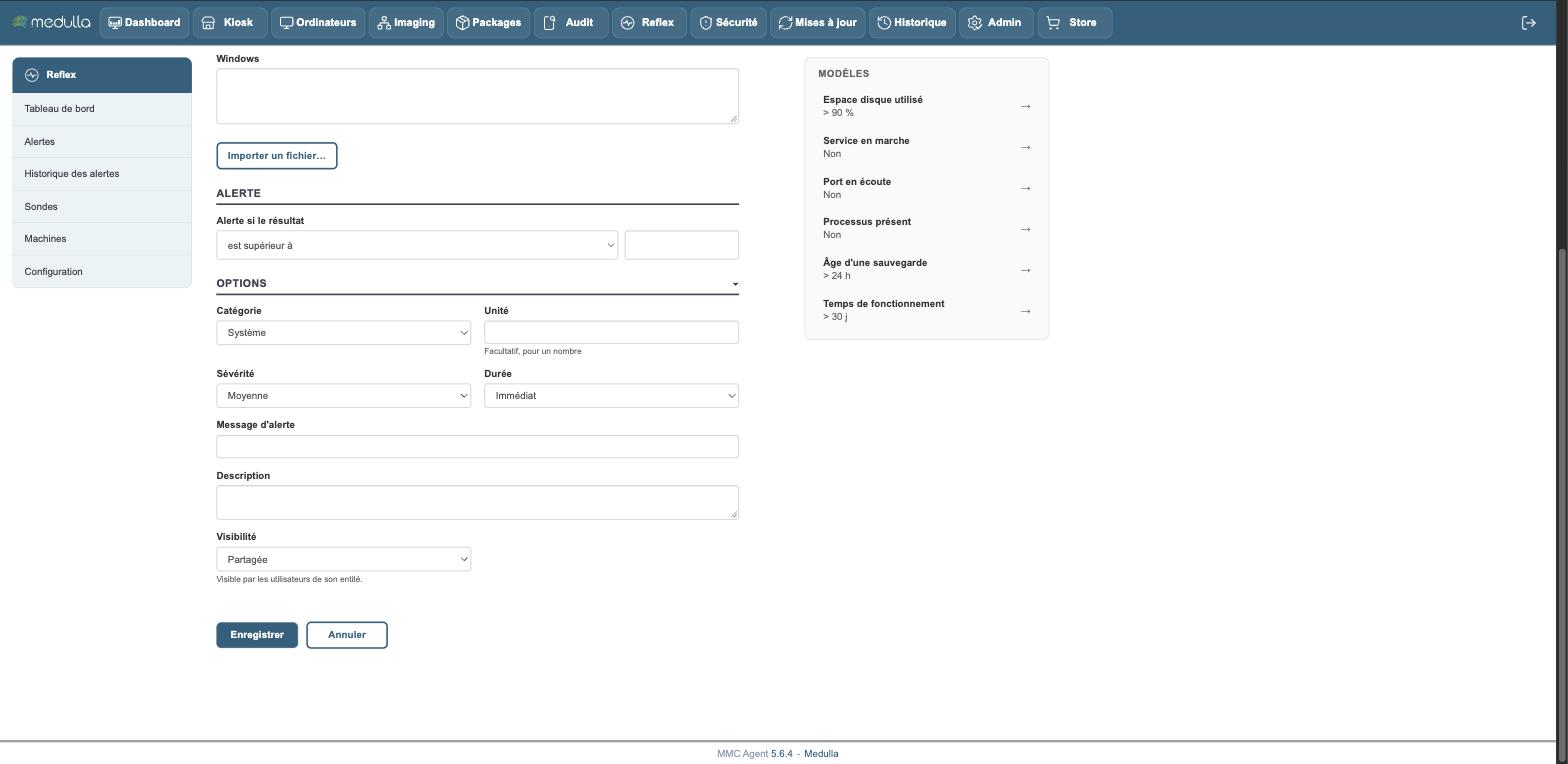
The Options section gathers what already has a reasonable value:
Category — so that the probe sits with its peers in the catalog.
Unit — optional, for a numeric measure: %, Mo, jours. It
is used for display and for the curves.
Severity — the level of the alert produced, Medium by default.
Duration — Immediate by default. Another value requires the condition to hold for that long before an alert opens, which avoids alerts on a passing spike: a load at 95 % for ten seconds is not an incident.
Alert message — the text that will appear in the list and in the
email. It accepts the same tokens as the shipped probes, @@machine@@ and
@@value@@ in particular. Write it for someone who discovers the alert at three
in the morning.
Description — what this probe is for. It is shown as a tooltip in the catalog. Your colleagues will read it, and so will you in six months.
What you need to know
Warning: the command runs on the machine with the rights of the agent, that is, as administrator. A personal probe is therefore a powerful tool, to be handled with the same care as a deployed package. Test your command on one computer before assigning it to the fleet.
An alert triggered by the has changed operator does not close by itself. This is intended: a modified system file remains a fact, even if the next measure no longer changes. Acknowledge it once you have dealt with it.