
The sheet of a machine
The Machines screen lists the supervised computers, with for each one the number of assigned probes, the alerts in progress by severity and the date of the last measure received.
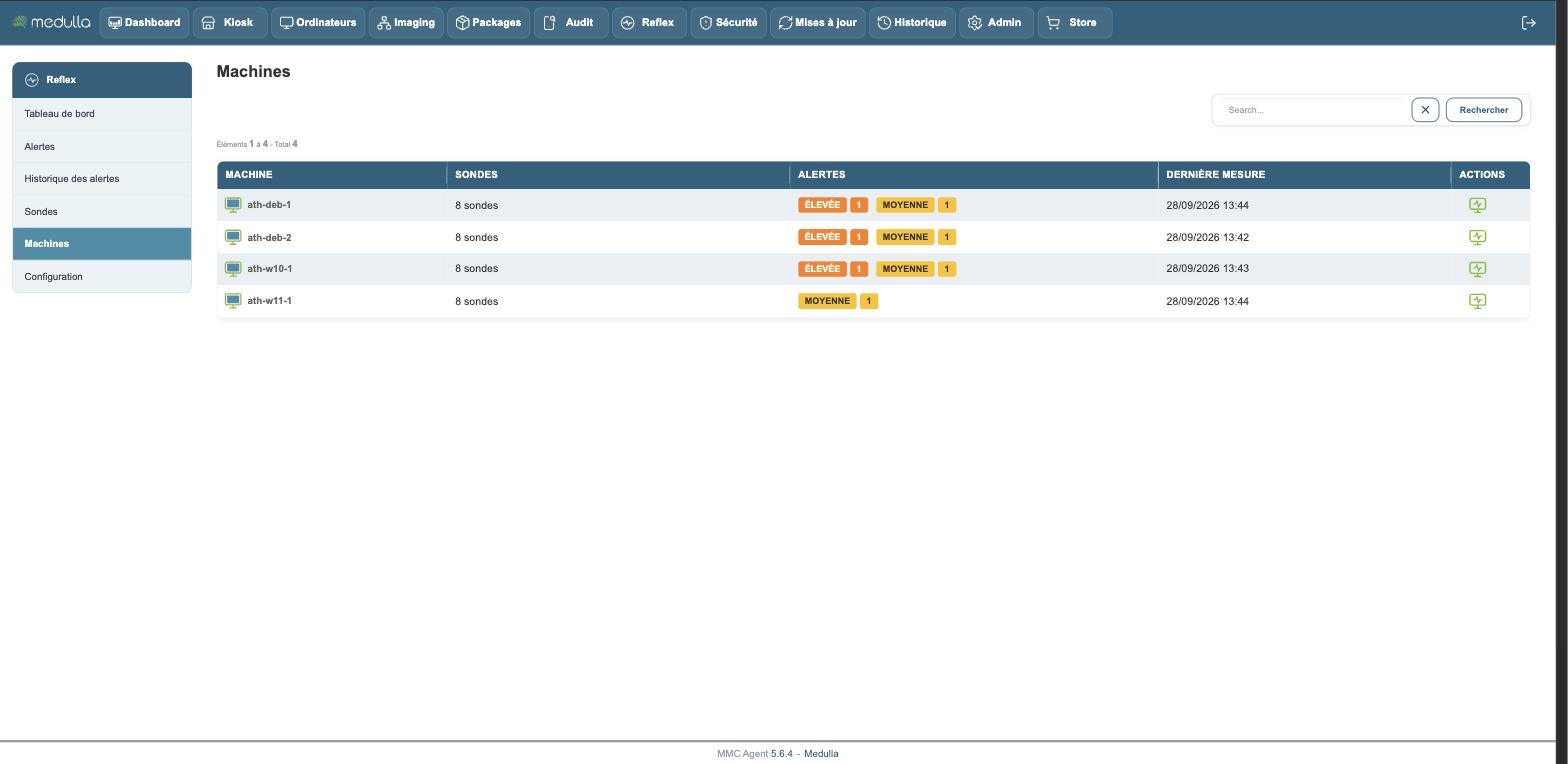
This last column deserves a regular look: a date that no longer moves points to a machine that no longer answers, which no alert will say since a silent machine triggers nothing.
The action at the end of the row opens the supervision sheet of the machine.
The supervision sheet
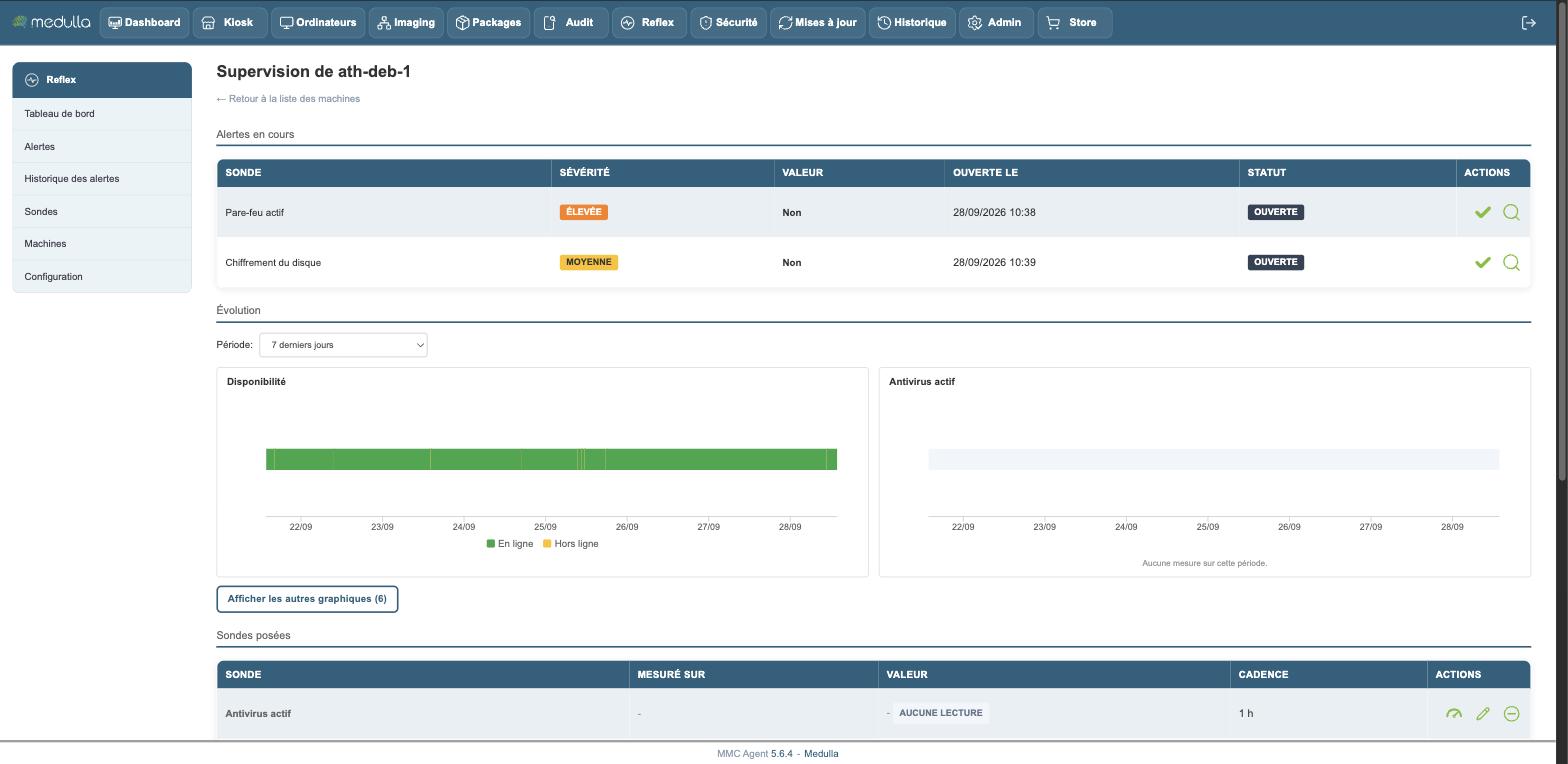
It reads in three steps.
Alerts in progress
What is open on this particular machine, with the measured value and the opening date. You can acknowledge from this page, without going back through the general list.
Evolution
The curves of the probes assigned to the machine, over the chosen period — the last seven days by default. They show what a table does not: a memory that has been rising steadily for ten days has not yet triggered an alert, but it will.
Not all probes draw a curve. A probe has none when the evolution of its measure teaches nothing: the number of local administrators, for example, is read in its list, not in its curve. These probes remain present in the assigned probes.
The probes that answer "Yes" or "No" do have a curve: knowing when the firewall was switched off is a piece of information.
The first two curves are shown straight away, the others behind a button.
Assigned probes
The table of the probes active on the machine: the name of the probe, the value of its last measure, its interval, and the possible actions — see the curve, change the interval, remove the probe from this machine.
A probe can show No reading: the agent did receive it, but has not yet been able to measure, or the measure makes no sense on this system. The module prefers to say so rather than show an empty cell.